. 2022 May;63(5):100205.
doi: 10.1016/j.jlr.2022.100205. Epub 2022 Mar 25.

Maternal obesogenic diet enhances cholestatic liver disease in offspring

Affiliations

Maternal obesogenic diet enhances cholestatic liver disease in offspring

Michael D Thompson et al. J Lipid Res. 2022 May.

Abstract

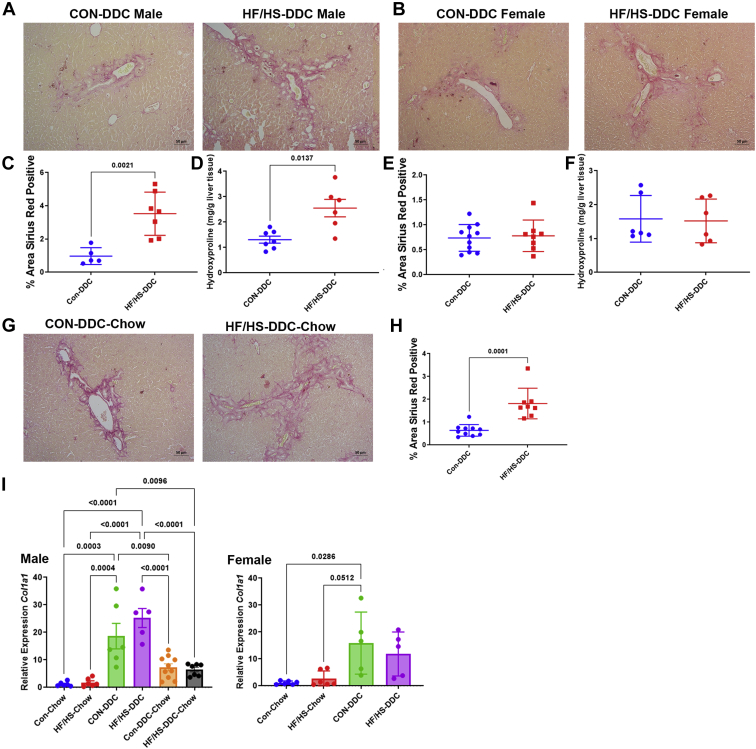
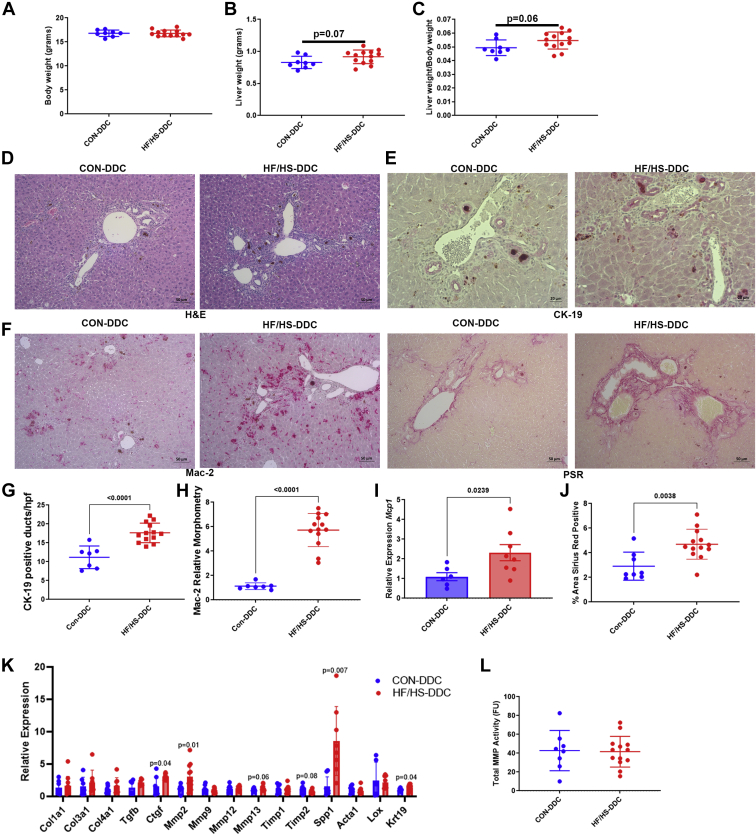
Human and animal model data show that maternal obesity promotes nonalcoholic fatty liver disease in offspring and alters bile acid (BA) homeostasis. Here we investigated whether offspring exposed to maternal obesogenic diets exhibited greater cholestatic injury. We fed female C57Bl6 mice conventional chow (CON) or high fat/high sucrose (HF/HS) diet and then bred them with lean males. Offspring were fed 3,5-diethoxycarbonyl-1,4-dihydrocollidine (DDC) for 2 weeks to induce cholestasis, and a subgroup was then fed CON for an additional 10 days. Additionally, to evaluate the role of the gut microbiome, we fed antibiotic-treated mice cecal contents from CON or HF/HS offspring, followed by DDC for 2 weeks. We found that HF/HS offspring fed DDC exhibited increased fine branching of the bile duct (ductular reaction) and fibrosis but did not differ in BA pool size or intrahepatic BA profile compared to offspring of mice fed CON. We also found that after 10 days recovery, HF/HS offspring exhibited sustained ductular reaction and periportal fibrosis, while lesions in CON offspring were resolved. In addition, cecal microbiome transplant from HF/HS offspring donors worsened ductular reaction, inflammation, and fibrosis in mice fed DDC. Finally, transfer of the microbiome from HF/HS offspring replicated the cholestatic liver injury phenotype. Taken together, we conclude that maternal HF/HS diet predisposes offspring to increased cholestatic injury after DDC feeding and delays recovery after returning to CON diets. These findings highlight the impact of maternal obesogenic diet on hepatobiliary injury and repair pathways during experimental cholestasis.

Keywords: NAFLD; animal models; bile acid metabolism; cecal transplant; cholestatic liver disease; ductular reaction; liver; maternal high fat/high sucrose; microbiome; obesity.


Conflict of interest statement

Conflict of interest The authors declare that they have no conflicts of interest with the contents of this article.

Figures

Fig. 1
Fig. 1
Experimental design. Breeding scheme, diet feeding, and cecal microbiome transplant for mouse models in this manuscript. DDC, 3,5-diethoxycarbonyl-1,4-dihydrocollidine; HF/HS, high fat/high sucrose. Created with BioRender.com.
Fig. 2
Fig. 2
Morphometric and serum analysis in offspring after DDC feeding and recovery. A: Body weights (BW) of male and female offspring from maternal CON and HF/HS lineage fed chow or DDC. Male recovery mice also included. B: Percent and absolute body weight loss in male offspring fed DDC diet for 2 weeks. C: Liver weights (LWs) of male and female offspring from maternal CON and HF/HS lineage fed chow or DDC. Male recovery mice also included. D: Liver to body weight (LW/BW) ratios of male and female offspring from maternal CON and HF/HS lineage fed chow or DDC. Male recovery mice also included. E: Serum analysis for ALT, AST, ALP, and bilirubin in male offspring fed chow, DDC, or DDC followed by chow. ALP, alkaline phosphatase; ALT, alanine transaminase; AST, aspartate transaminase; DDC, 3,5-diethoxycarbonyl-1,4-dihydrocollidine; HF/HS, high fat/high sucrose.
Fig. 3
Fig. 3
Maternal obesogenic diet increases biliary ductular reaction in offspring fed DDC. A: Representative photomicrographs of H&E staining of liver from male and female offspring fed chow and H&E staining and IHC for CK-19 of liver from male and female offspring fed DDC. B: Quantification of CK-19-positive bile ducts in liver of offspring fed DDC. C: Representative photomicrographs of IHC for CK-19 of liver from male offspring fed DDC for 2 weeks and transitioned to chow for 10 days to recover with quantification of CK-19-positive bile ducts to the right. D: relative expression of Krt19 in male offspring at baseline, after 2 weeks of DDC, and 2 weeks of DDC with 10 days of chow diet for recovery. E: Relative expression of Krt19 in female offspring at baseline and after 2 weeks of DDC. Quantitative data presented as mean (±SD) with n ≥ 5 in each group and ≥5 separate litters represented in each group. P values indicated on graph. DDC, 3,5-diethoxycarbonyl-1,4-dihydrocollidine; H&E, hematoxylin and eosin; HF/HS, high fat/high sucrose.
Fig. 4
Fig. 4
DDC feeding blunts inflammation in offspring exposed to maternal obesogenic diet. A: Representative photomicrographs of IHC for Mac-2 and CD45 in male and female offspring fed DDC. B: Quantification of Mac-2 and CD45 staining from male offspring fed DDC. C: Quantification of Mac-2 and CD45 staining from female offspring fed DDC. D: Representative photomicrographs of IHC for Mac-2 in male offspring from recovery cohort. E: Quantification of Mac-2 staining in male offspring from recovery cohort. F: Gene expression analysis by qPCR for F4/80 and Vcam1 in male offspring fed DDC. Recovery cohort data included. G: Gene expression analysis by qPCR for F4/80 and Vcam1 in female offspring fed DDC. Quantitative data presented as mean ± SD with n ≥ 5 in each group and ≥5 separate litters represented in each group. P values as indicated on graph. DDC, 3,5-diethoxycarbonyl-1,4-dihydrocollidine; HF/HS, high fat/high sucrose.
Fig. 5
Fig. 5
Cytokine expression after DDC feeding in offspring. A: Relative expression of proinflammatory cytokine genes in male offspring at baseline, after 2 weeks of DDC, and 2 weeks of DDC with 10 days of chow diet for recovery. B: Relative expression of proinflammatory cytokine genes in female offspring at baseline and after 2 weeks of DDC. Quantitative data presented as mean ± SD with n ≥ 5 in each group and ≥5 separate litters represented in each group. P values as indicated on graph. DDC, 3,5-diethoxycarbonyl-1,4-dihydrocollidine; HF/HS, high fat/high sucrose.
Fig. 6
Fig. 6
Increased fibrosis after DDC feeding with delayed resolution in male offspring exposed to maternal obesogenic diet. A: Representative photomicrographs of PSR staining of liver from male offspring fed DDC. B: Representative photomicrographs of PSR staining of liver from female offspring fed DDC. C: Percent area of PSR staining in liver of male offspring fed DDC. D: Hepatic hydroxyproline content in male offspring fed DDC. E: Percent area of PSR staining in liver of female offspring fed DDC. F: Hepatic hydroxyproline content in female offspring fed DDC. G: Representative photomicrographs of PSR staining of liver from male offspring fed DDC followed by chow for recovery. H: Percent area of PSR staining in liver of male offspring during recovery. Gene expression analysis by qPCR for Col1a1 in liver of male offspring fed DDC. I: Gene expression analysis by qPCR for Col1a1 in liver of female offspring fed DDC. Quantitative data presented as mean ± SD with n ≥ 5 in each group and ≥5 separate litters represented in each group. P values as indicated on graph. DDC, 3,5-diethoxycarbonyl-1,4-dihydrocollidine; HF/HS, high fat/high sucrose; PSR, picrosirius red.
Fig. 7
Fig. 7
Decreased MMP activity in liver of offspring exposed to maternal obesogenic diet during DDC feeding and recovery. A: Gene expression analysis by qPCR for Mmp2, Mmp9, Mmp12, and Mmp13 in livers of male offspring fed DDC. B: Gene expression analysis by qPCR for Timp1 and Timp2 in livers of male offspring fed DDC. C: MMP enzymatic activity in livers of male offspring fed DDC. D: Gene expression analysis by qPCR for Mmp2, Mmp9, Mmp12, and Mmp13 in liver of male offspring fed DDC followed by chow for recovery. E: Gene expression analysis by qPCR for Timp1 and Timp2 in liver of male offspring fed DDC followed by chow for recovery. F: MMP enzymatic activity in liver of male offspring fed DDC followed by chow for recovery. Quantitative data presented as mean ± SD with n ≥ 5 in each group and ≥5 separate litters represented in each group. P values as indicated on graph. DDC, 3,5-diethoxycarbonyl-1,4-dihydrocollidine; HF/HS, high fat/high sucrose.
Fig. 8
Fig. 8
No difference in BA homeostasis after DDC feeding in maternal CON and HF/HS offspring. A: BA pool size male and female offspring fed DDC. B: Abundance of BA species in livers of male and female offspring fed DDC. C: Hydrophobicity index for liver BAs in male and female offspring at baseline and after 2 weeks DDC feeding. D: Serum C4 concentrations in male offspring fed DDC. Quantitative data presented as mean ± SD with n ≥ 5 in each group and ≥5 separate litters represented in each group. P values as indicated on graph. BA, bile acid; DDC, 3,5-diethoxycarbonyl-1,4-dihydrocollidine; HF/HS, high fat/high sucrose.
Fig. 9
Fig. 9
Expression of genes involved in BA metabolism after DDC feeding in maternal CON and HF/HS offspring. A: Gene expression analysis by qPCR for Cyp7a1, Cyp8b1, Cyp3a11, and Shp in liver of male offspring. B: Gene expression analysis by qPCR for Bsep, Ntcp, and Mdr2 in liver of male offspring. C: Gene expression analysis by qPCR for Nr1h4, Shp, and Fgf15 in distal ileum of male offspring. Quantitative data presented as mean ± SD with n ≥ 5 in each group and ≥5 separate litters represented in each group. P values as indicated on graph. BA, bile acid; DDC, 3,5-diethoxycarbonyl-1,4-dihydrocollidine; HF/HS, high fat/high sucrose.
Fig. 10
Fig. 10
Shift in the cecal microbiome of HF/HS offspring fed DDC. A: Bray-Curtis plots for beta-diversity of cecal microbiome from HF/HS and CON offspring. B: Measures of alpha-diversity (Observed OTUs, Faith PD, and Shannon Diversity) in cecal microbiome of HF/HS and CON offspring. C: Relative abundance of each bacterial phyla in cecal microbiome of HF/HS and CON offspring. D: Relative abundance of each bacterial genus in cecal microbiome of HF/HS and CON offspring. E: High abundance genera with a trend toward a difference in cecal microbiome of HF/HS and CON offspring. F: Genera with significantly differential abundance in cecal microbiome of HF/HS and CON offspring. Quantitative data presented as mean ± SD with n = 6 in each group and ≥5 separate litters represented in each group. P values as indicated on graph. DDC, 3,5-diethoxycarbonyl-1,4-dihydrocollidine; HF/HS, high fat/high sucrose.
Fig. 11
Fig. 11
Transfer of the cecal microbiome from HF/HS lineage offspring leads to worse cholestatic liver injury. A: BW of CMT recipient mice fed DDC. B: LW of recipient mice fed DDC. C: LW/BW of recipient mice fed DDC. D: Representative photomicrographs of H&E staining of liver from CMT recipient mice fed DDC. E: Representative photomicrographs of IHC for CK-19 in liver of CMT recipient mice fed DDC. F: Quantification of CK-19-positive bile ducts and gene expression analysis by qPCR for Krt19 in livers of CMT recipient mice fed DDC. G: Representative photomicrographs of Mac-2 IHC and PSR staining in liver of CMT recipient mice fed DDC. H: Quantification of Mac-2 staining in livers of CMT recipient mice fed DDC. I: Gene expression analysis by qPCR for Mcp1 in liver of CMT recipient mice fed DDC. J: Quantification of PSR staining in livers of CMT recipient mice fed DDC. K: Gene expression analysis by qPCR for Col1a1, Mmp2, and Mmp13 in livers of CMT recipient mice fed DDC. L: MMP enzymatic activity in livers of CMT recipient mice fed DDC. Donor and recipient mice were male. Quantitative data presented as mean ± SD with n ≥ 6 in each group. P values as indicated on graph. CMT, cecal microbiome transplantation; DDC, 3,5-diethoxycarbonyl-1,4-dihydrocollidine; HF/HS, high fat/high sucrose; LW/BW, liver to body weight.
Fig. 12
Fig. 12
Shift in the cecal microbiome of HF/HS CMT recipient mice fed DDC. A: Bray-Curtis plots for beta-diversity of cecal microbiome from HF/HS and CON CMT recipients. B: Measures of alpha-diversity (Observed OTUs, Faith PD, and Shannon Diversity) in cecal microbiome of HF/HS and CON CMT recipients. C: Relative abundance of each bacterial phyla in cecal microbiome of HF/HS and CON CMT recipients. D: Relative abundance of each bacterial genus in cecal microbiome of HF/HS and CON CMT recipients. E: Genera with significantly differential abundance in cecal microbiome of HF/HS and CON CMT recipients. F: Abundance of Parabacteroides distasonis in baseline offspring fed DDC and CMT recipient mice fed DDC. Donor and recipient mice were male. Quantitative data presented as mean ± SD with n = 6 in each group and ≥5 separate litters represented in each group. P values as indicated on graph. CMT, cecal microbiome transplantation; DDC, 3,5-diethoxycarbonyl-1,4-dihydrocollidine; HF/HS, high fat/high sucrose.

Similar articles

Cited by

References

    1. Hanson M.A., Gluckman P.D. Early developmental conditioning of later health and disease: physiology or pathophysiology? Physiol. Rev. 2014;94:1027–1076. - PMC - PubMed
    1. Hinkle S.N., Sharma A.J., Kim S.Y., Park S., Dalenius K., Brindley P.L., Grummer-Strawn L.M. Prepregnancy obesity trends among low-income women, United States, 1999-2008. Matern. Child Health J. 2012;16:1339–1348. - PubMed
    1. Boney C.M., Verma A., Tucker R., Vohr B.R. Metabolic syndrome in childhood: association with birth weight, maternal obesity, and gestational diabetes mellitus. Pediatrics. 2005;115:e290–e296. - PubMed
    1. Plagemann A., Harder T., Kohlhoff R., Rohde W., Dorner G. Glucose tolerance and insulin secretion in children of mothers with pregestational IDDM or gestational diabetes. Diabetologia. 1997;40:1094–1100. - PubMed
    1. Plagemann A., Harder T., Kohlhoff R., Rohde W., Dorner G. Overweight and obesity in infants of mothers with long-term insulin-dependent diabetes or gestational diabetes. Int. J. Obes. Relat. Metab. Disord. 1997;21:451–456. - PubMed

Publication types

Substances