. 2022 Jul:160:116397.
doi: 10.1016/j.bone.2022.116397. Epub 2022 Mar 25.

Progressive skeletal defects caused by Kindlin3 deficiency, a model of autosomal recessive osteopetrosis in humans

Affiliations

Progressive skeletal defects caused by Kindlin3 deficiency, a model of autosomal recessive osteopetrosis in humans

Tejasvi Dudiki et al. Bone. 2022 Jul.

Abstract

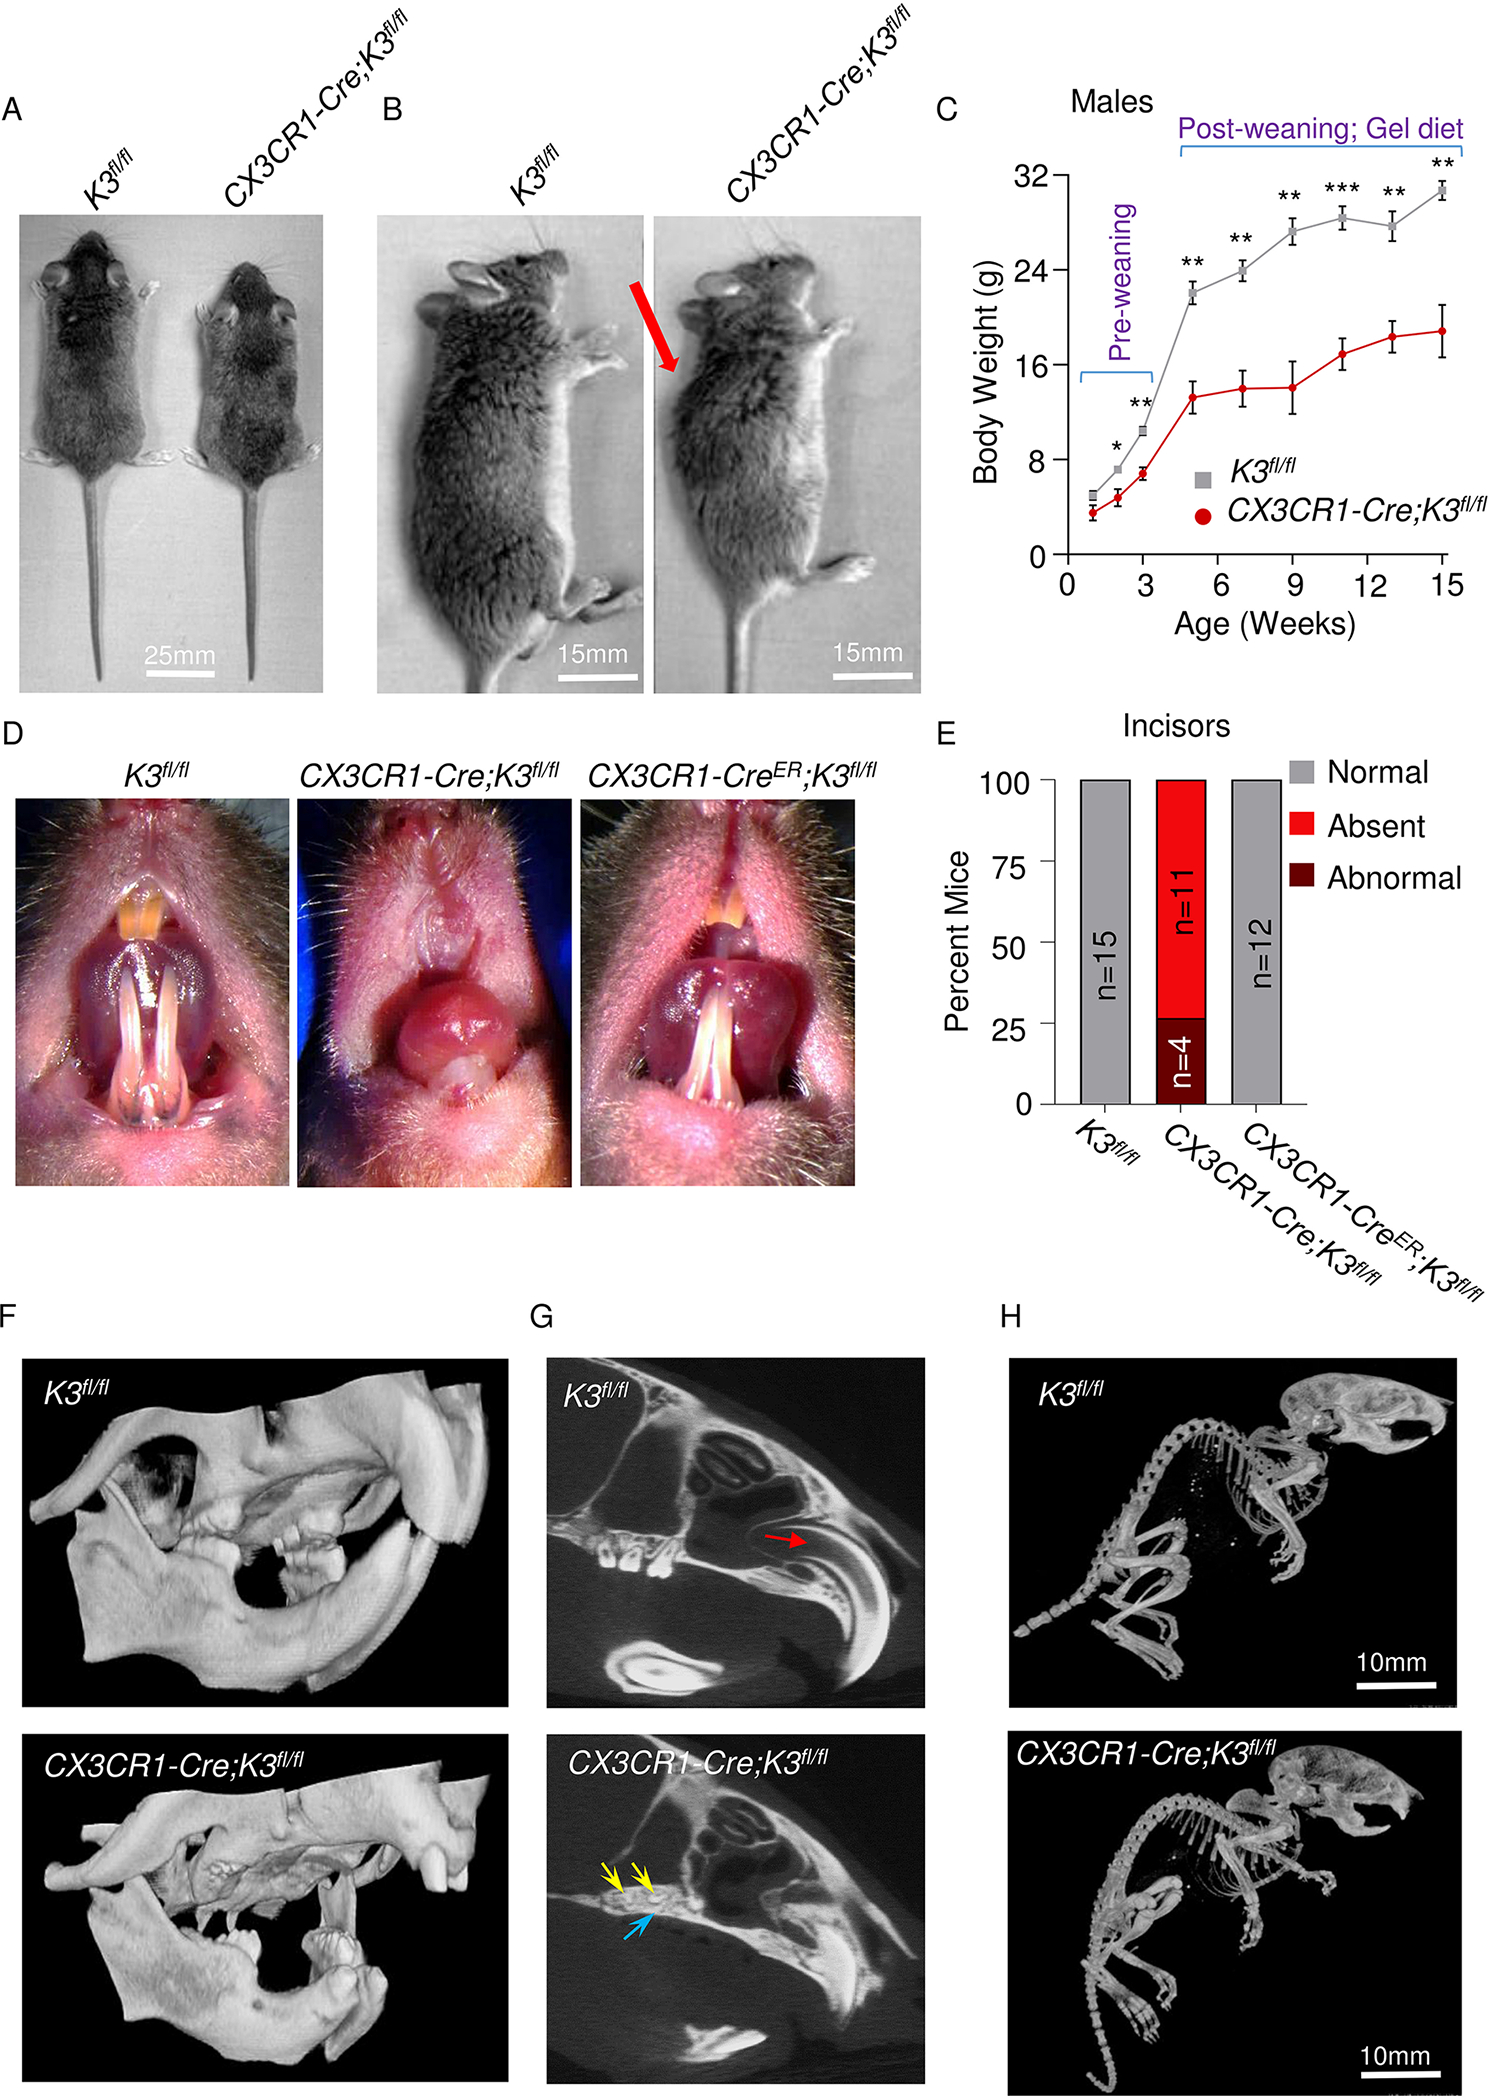
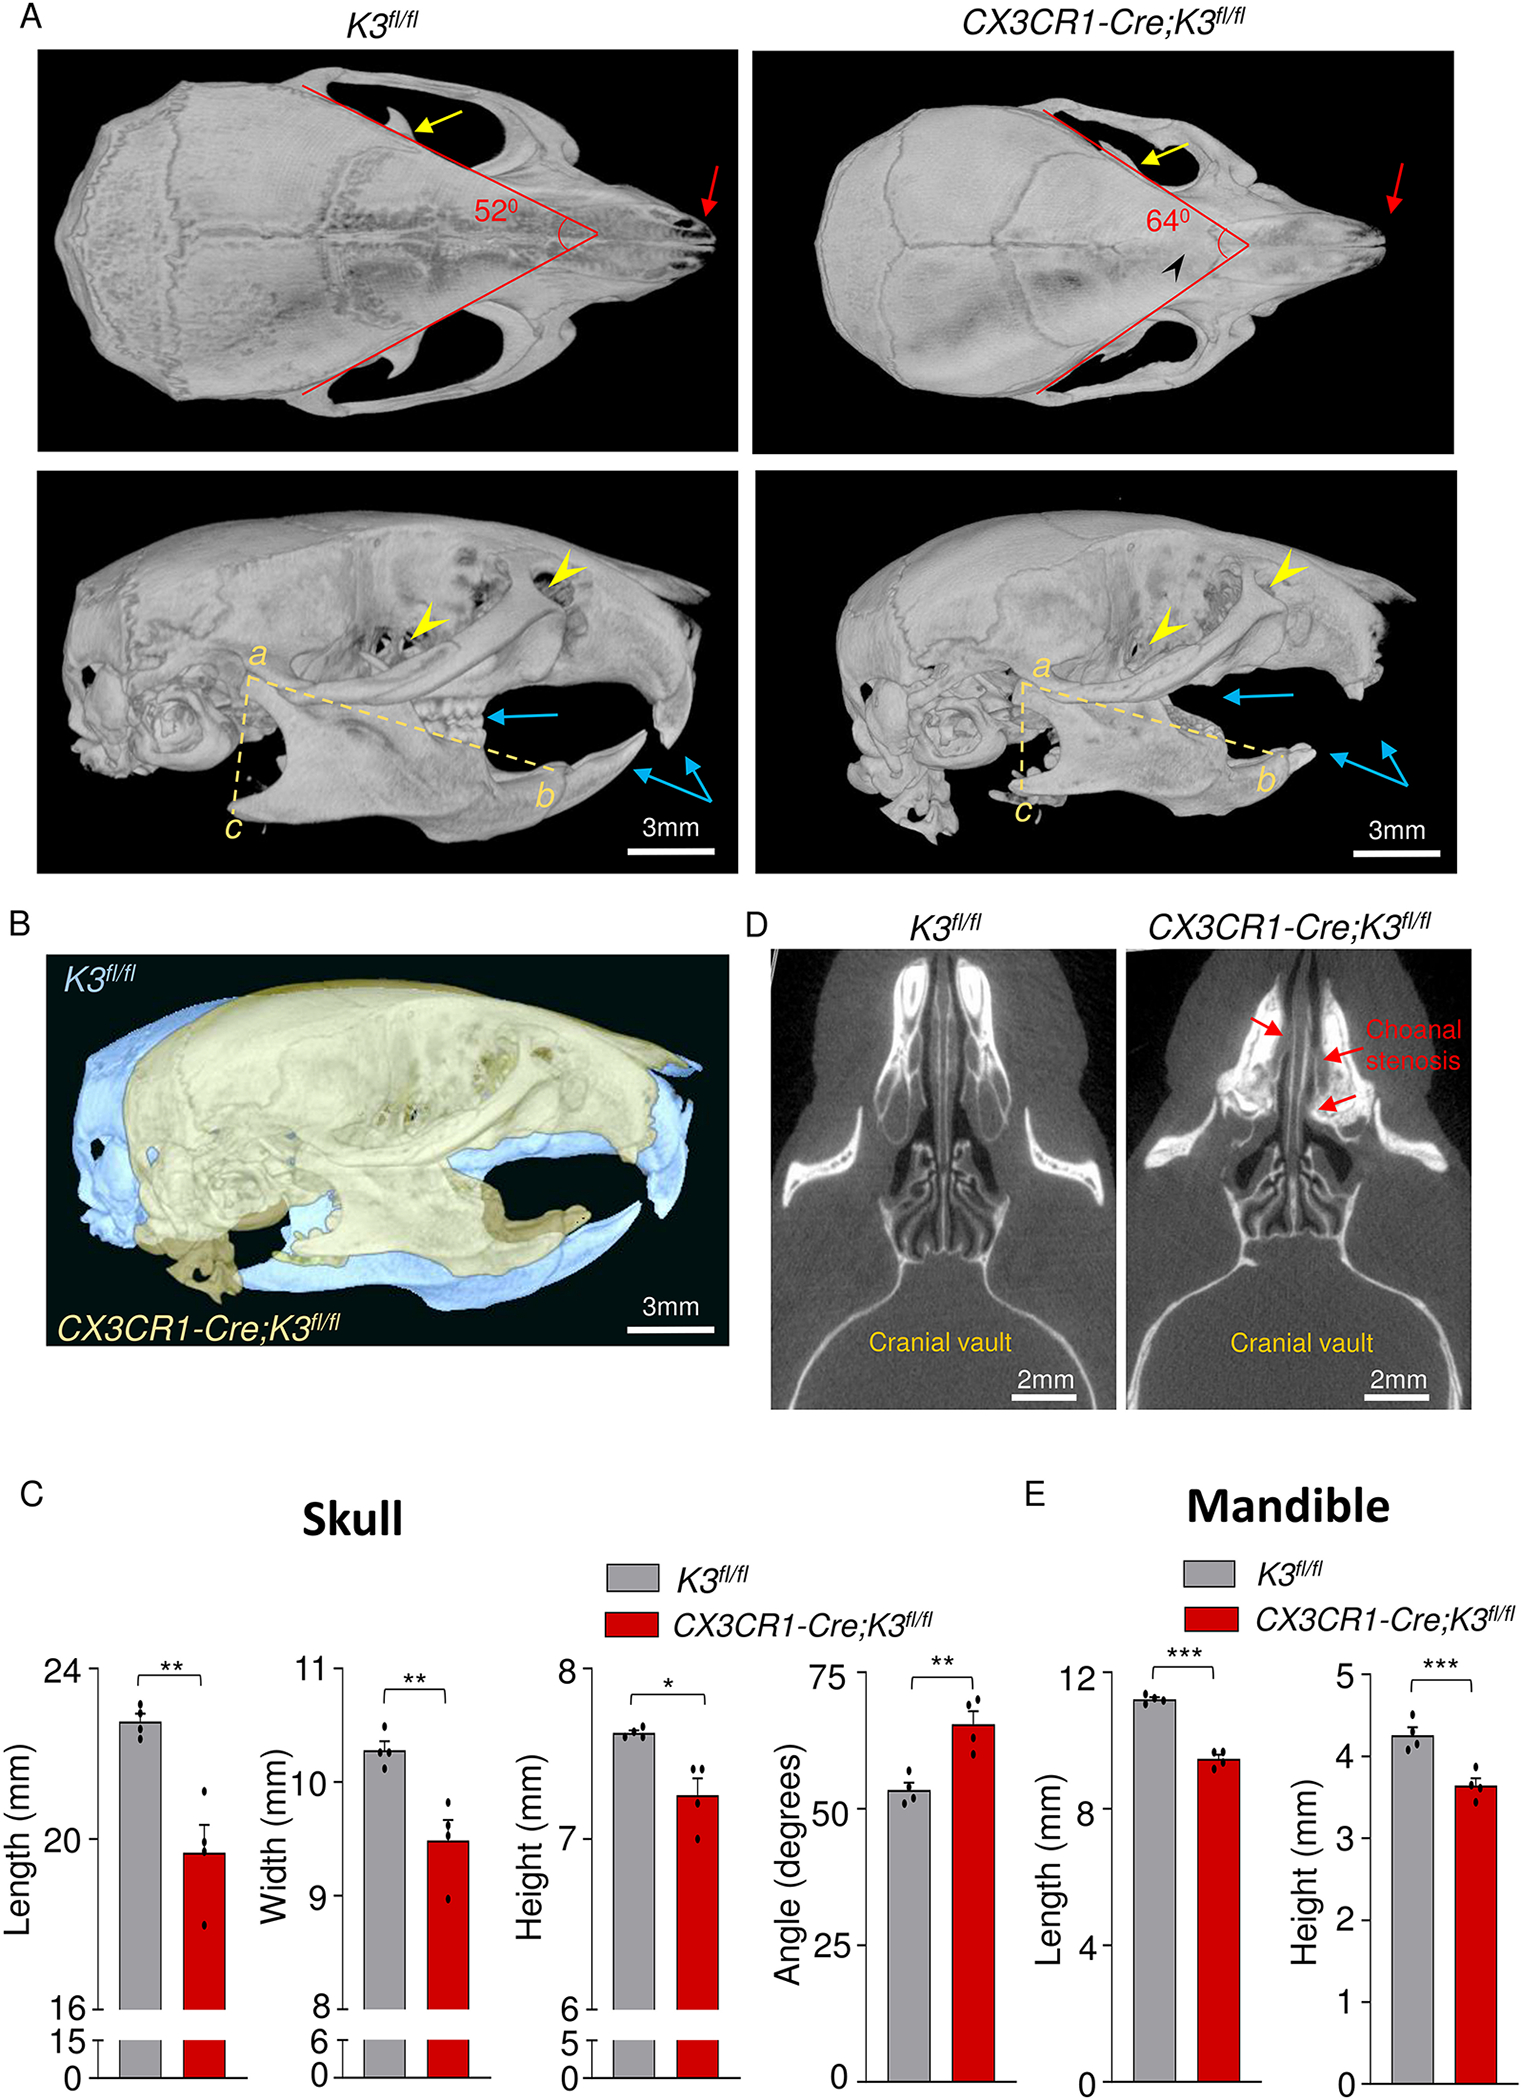
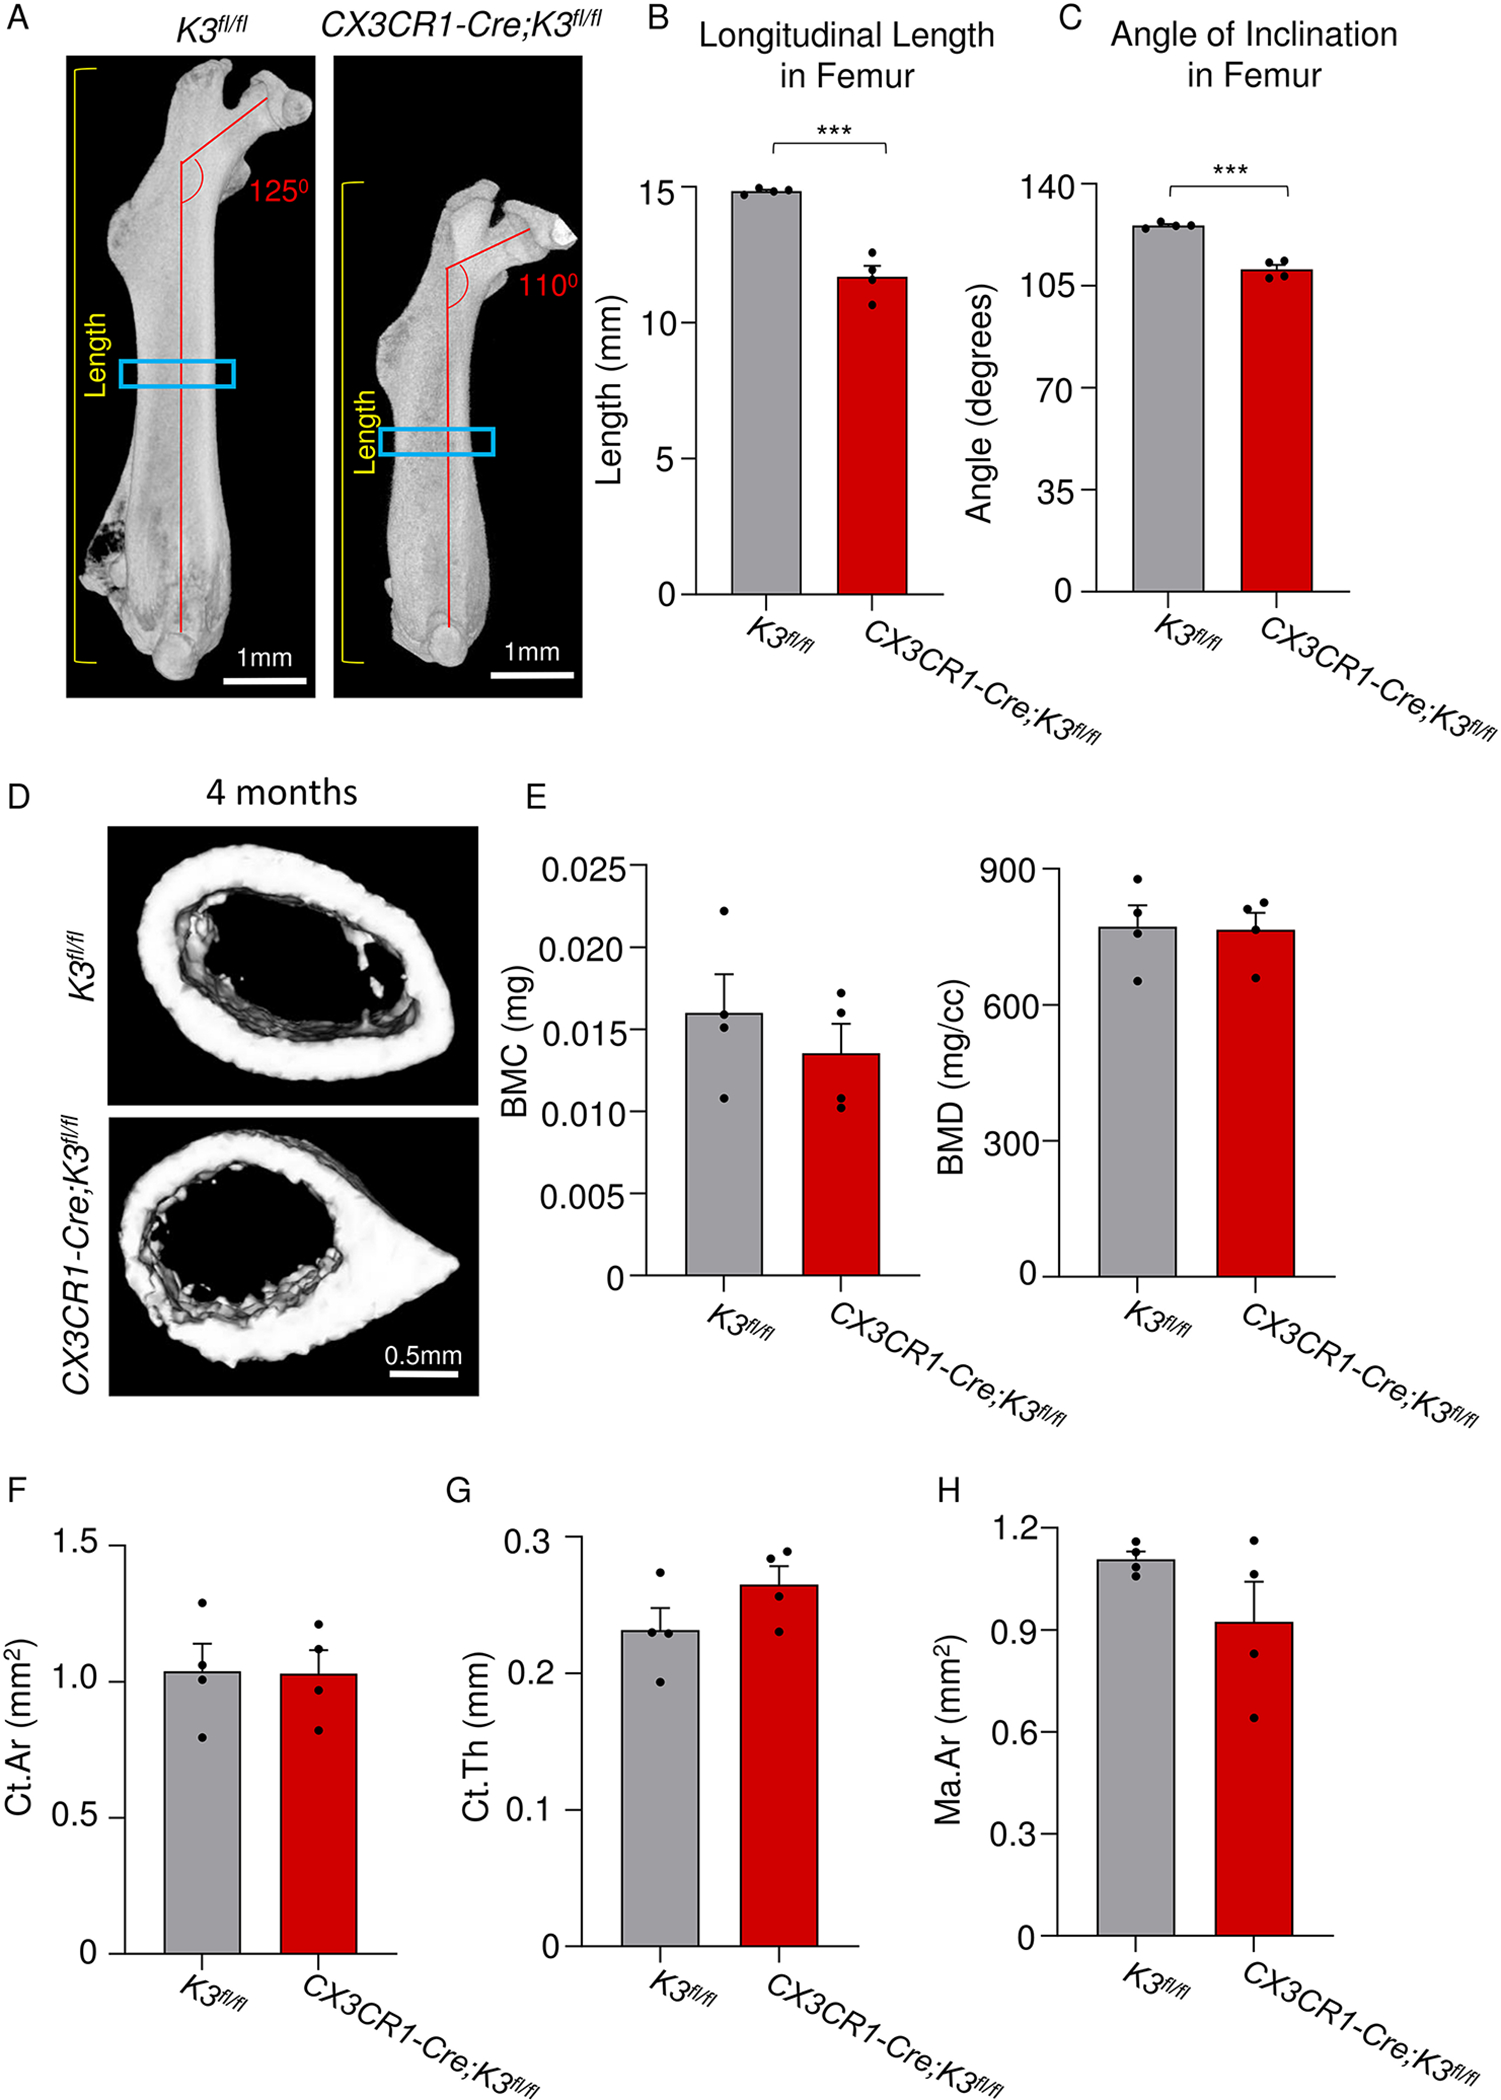
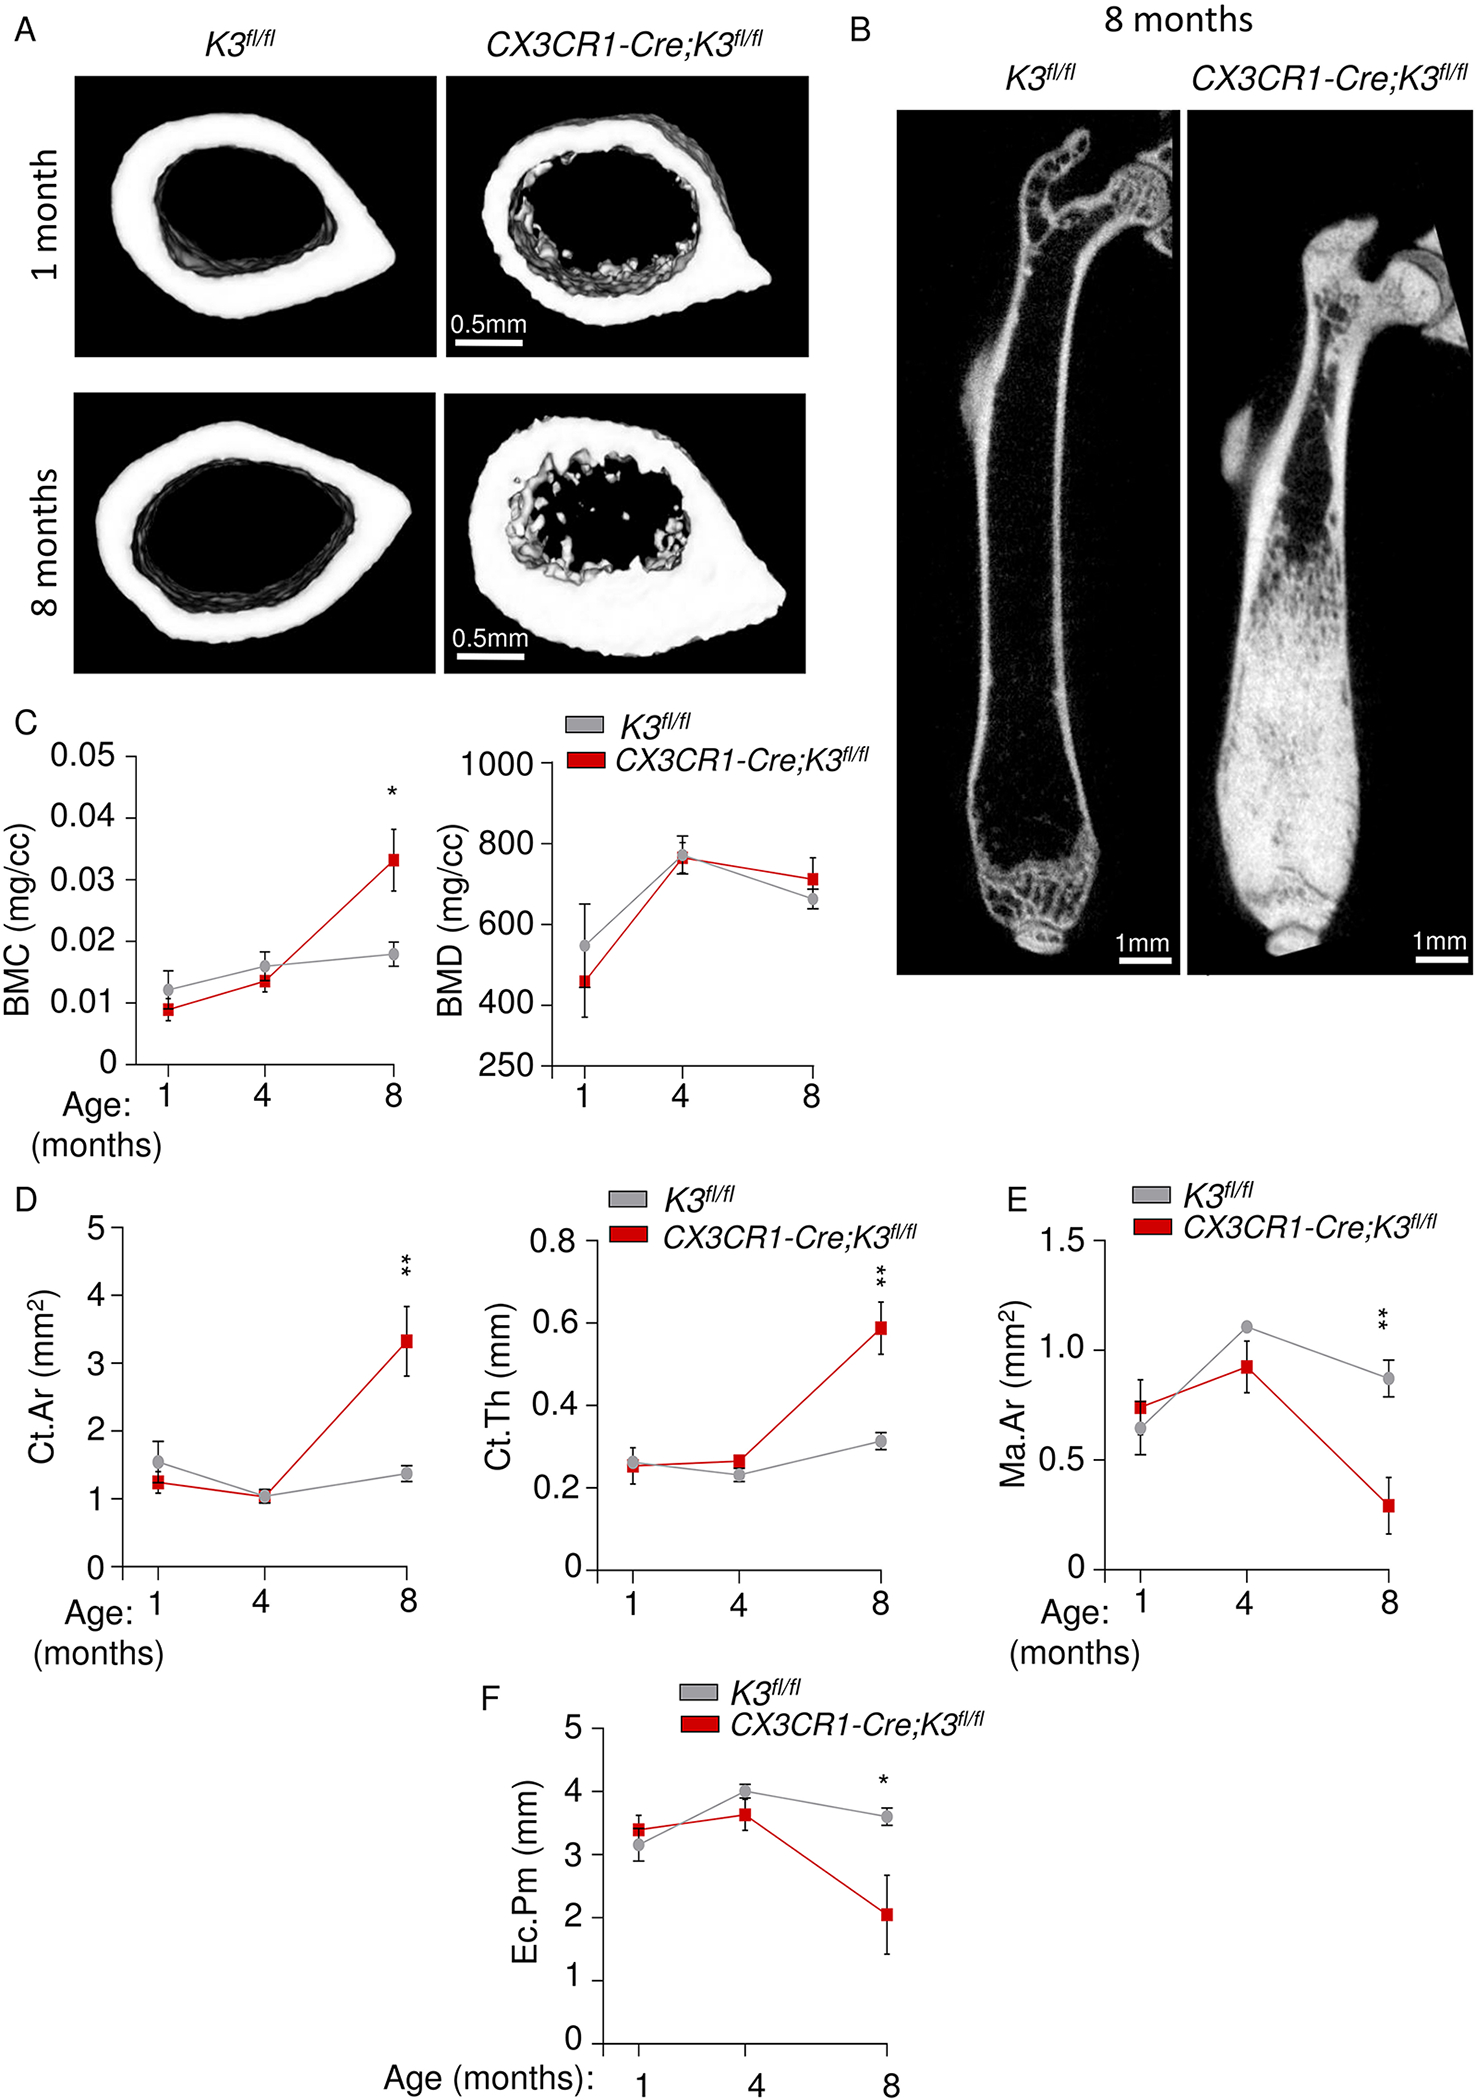
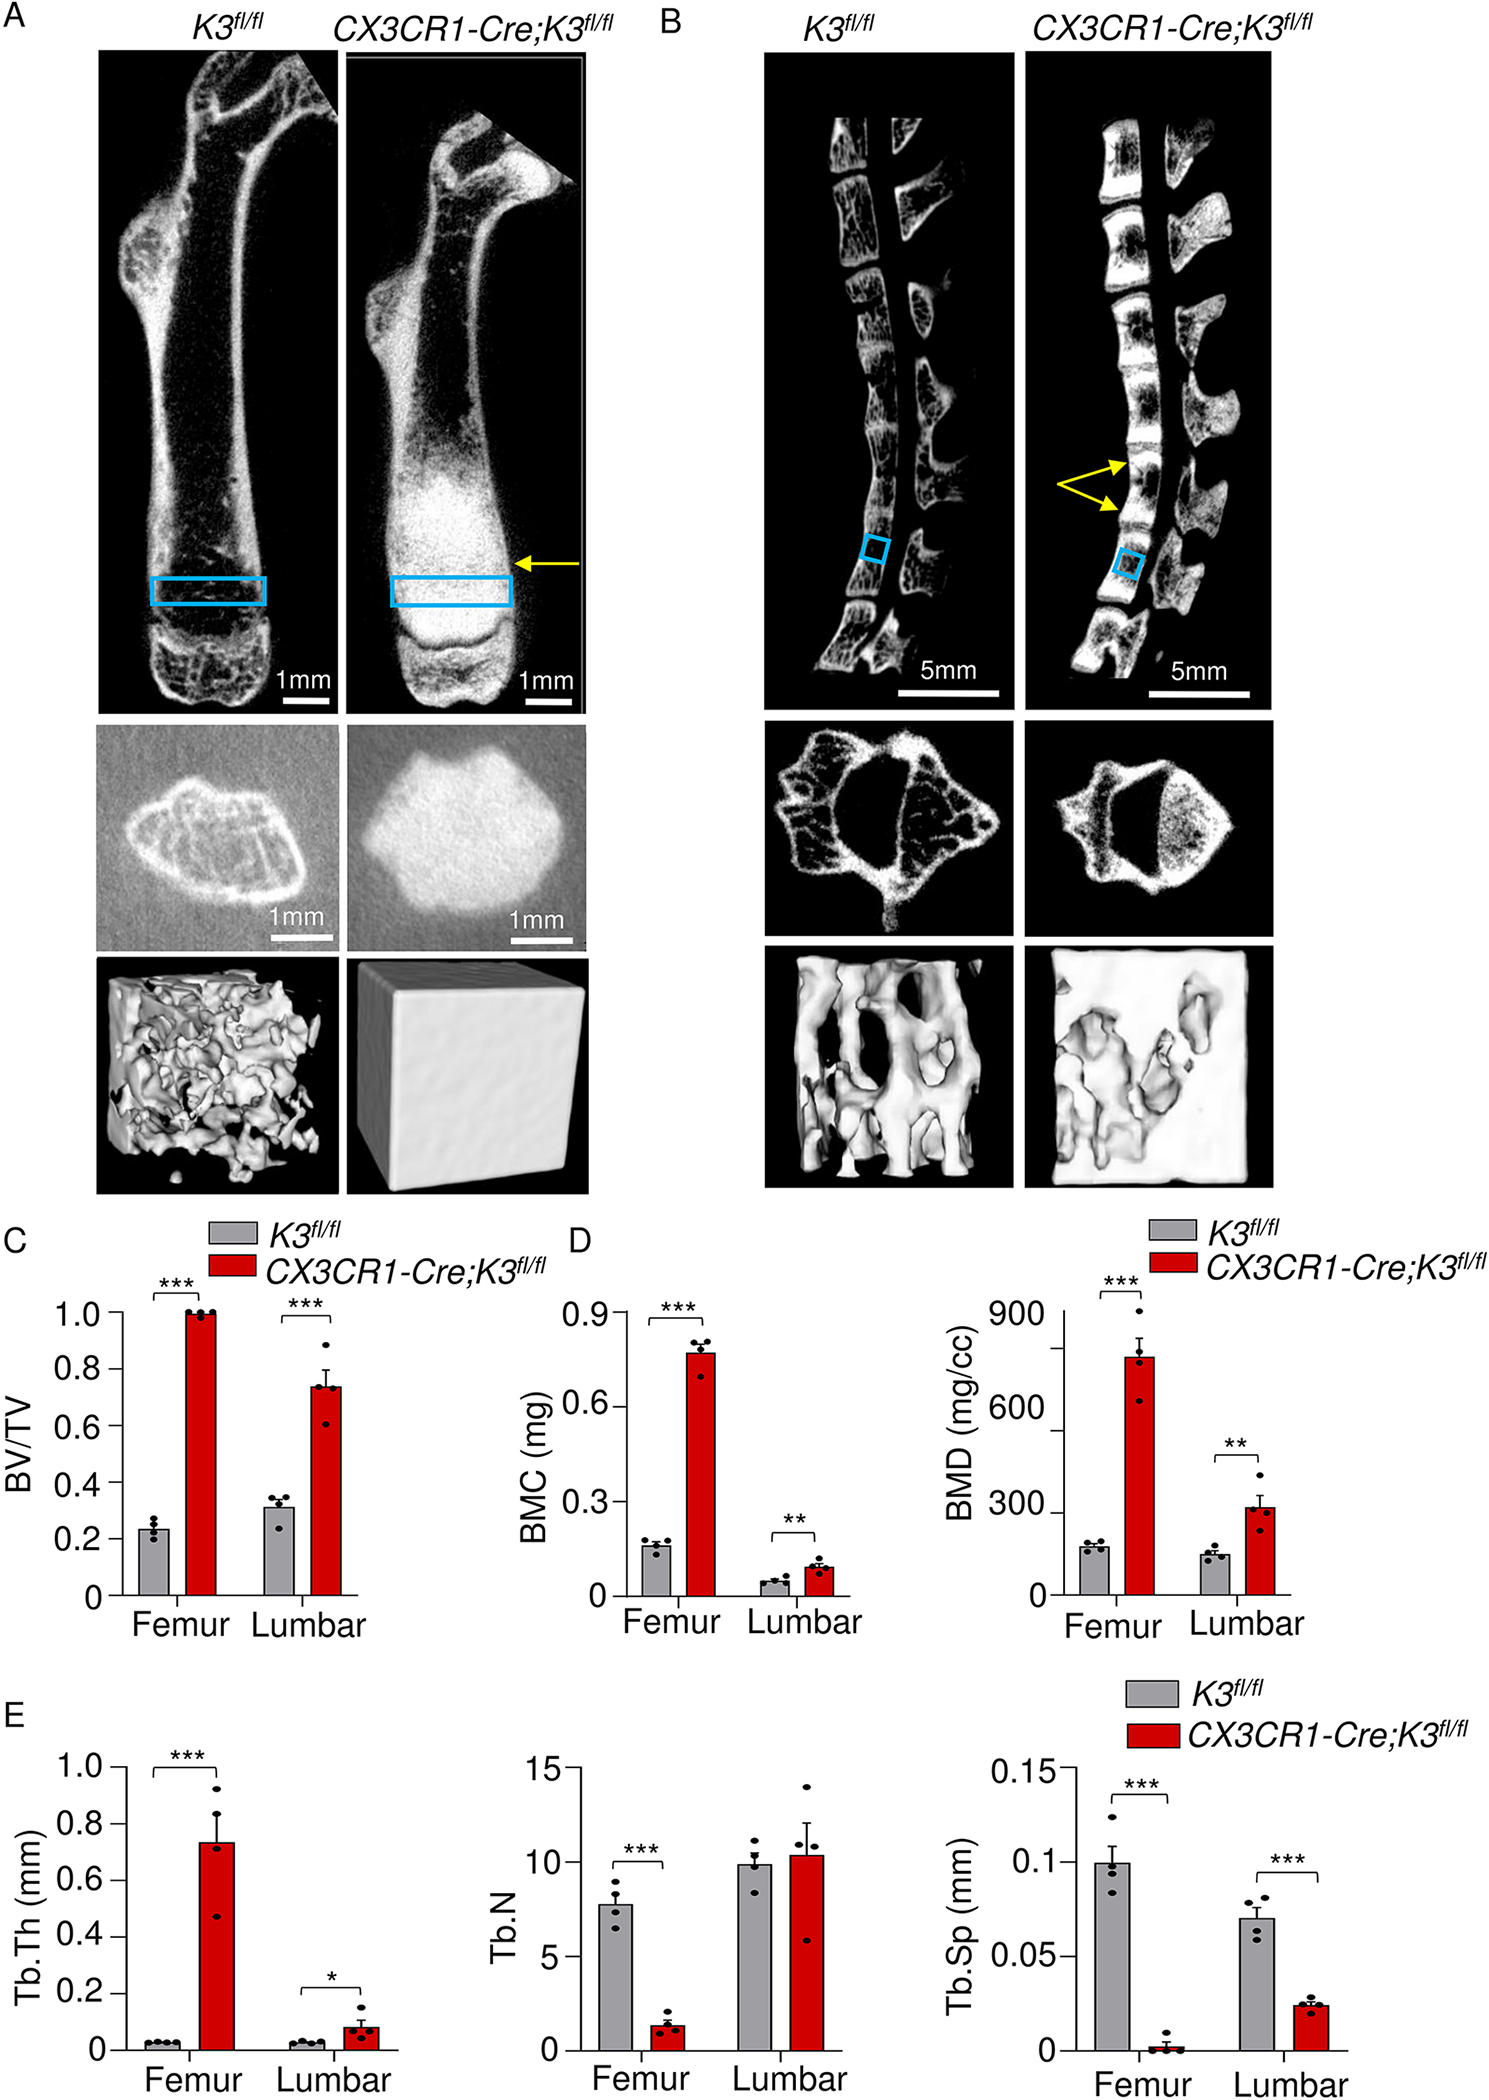
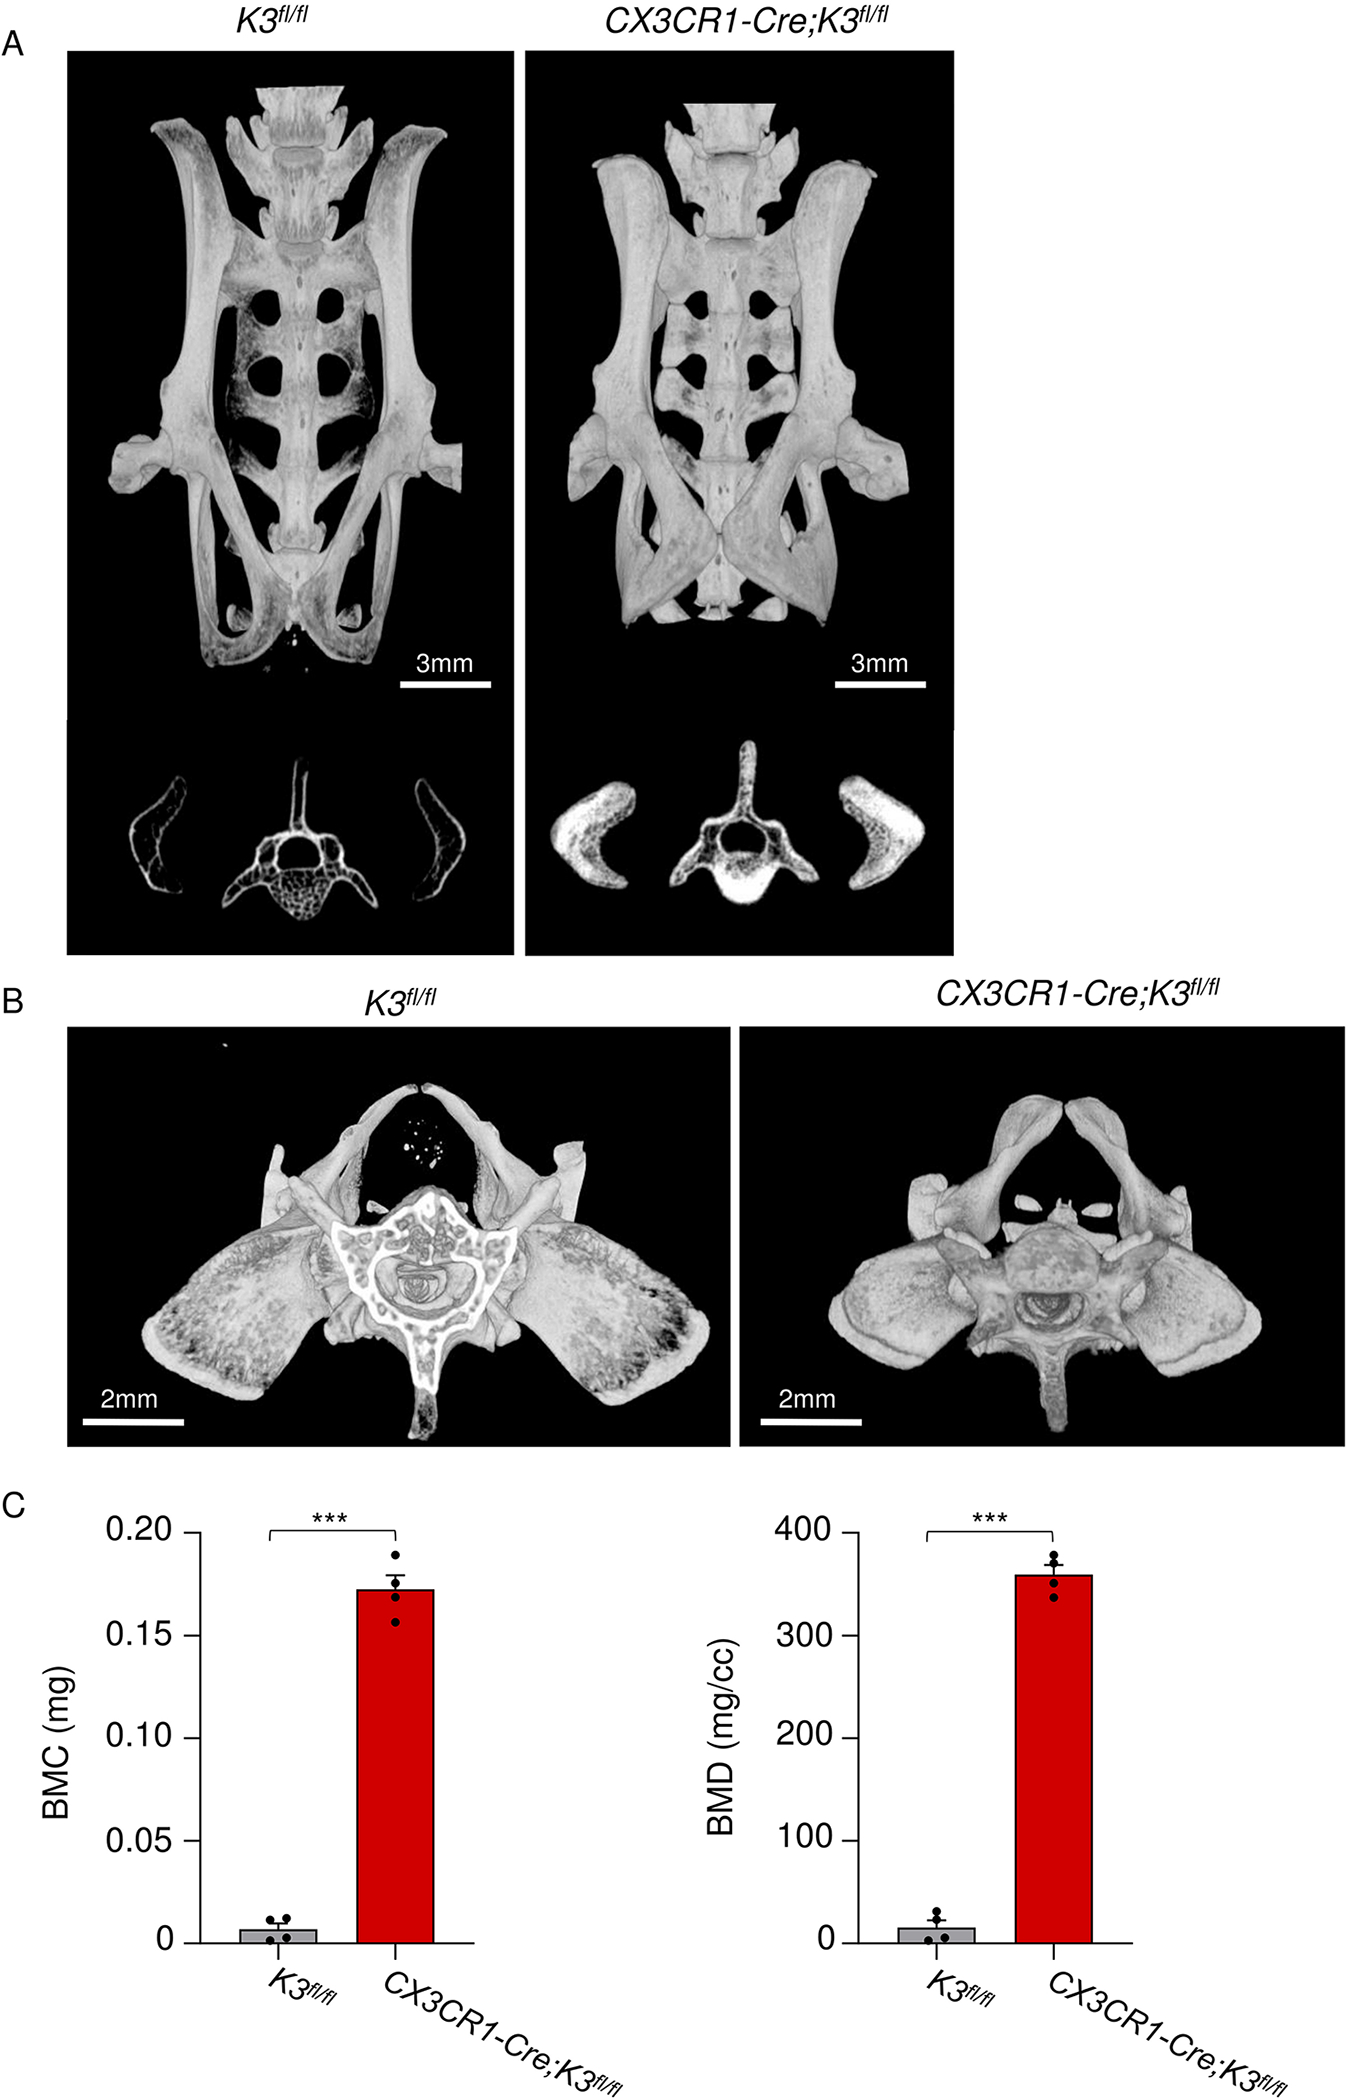
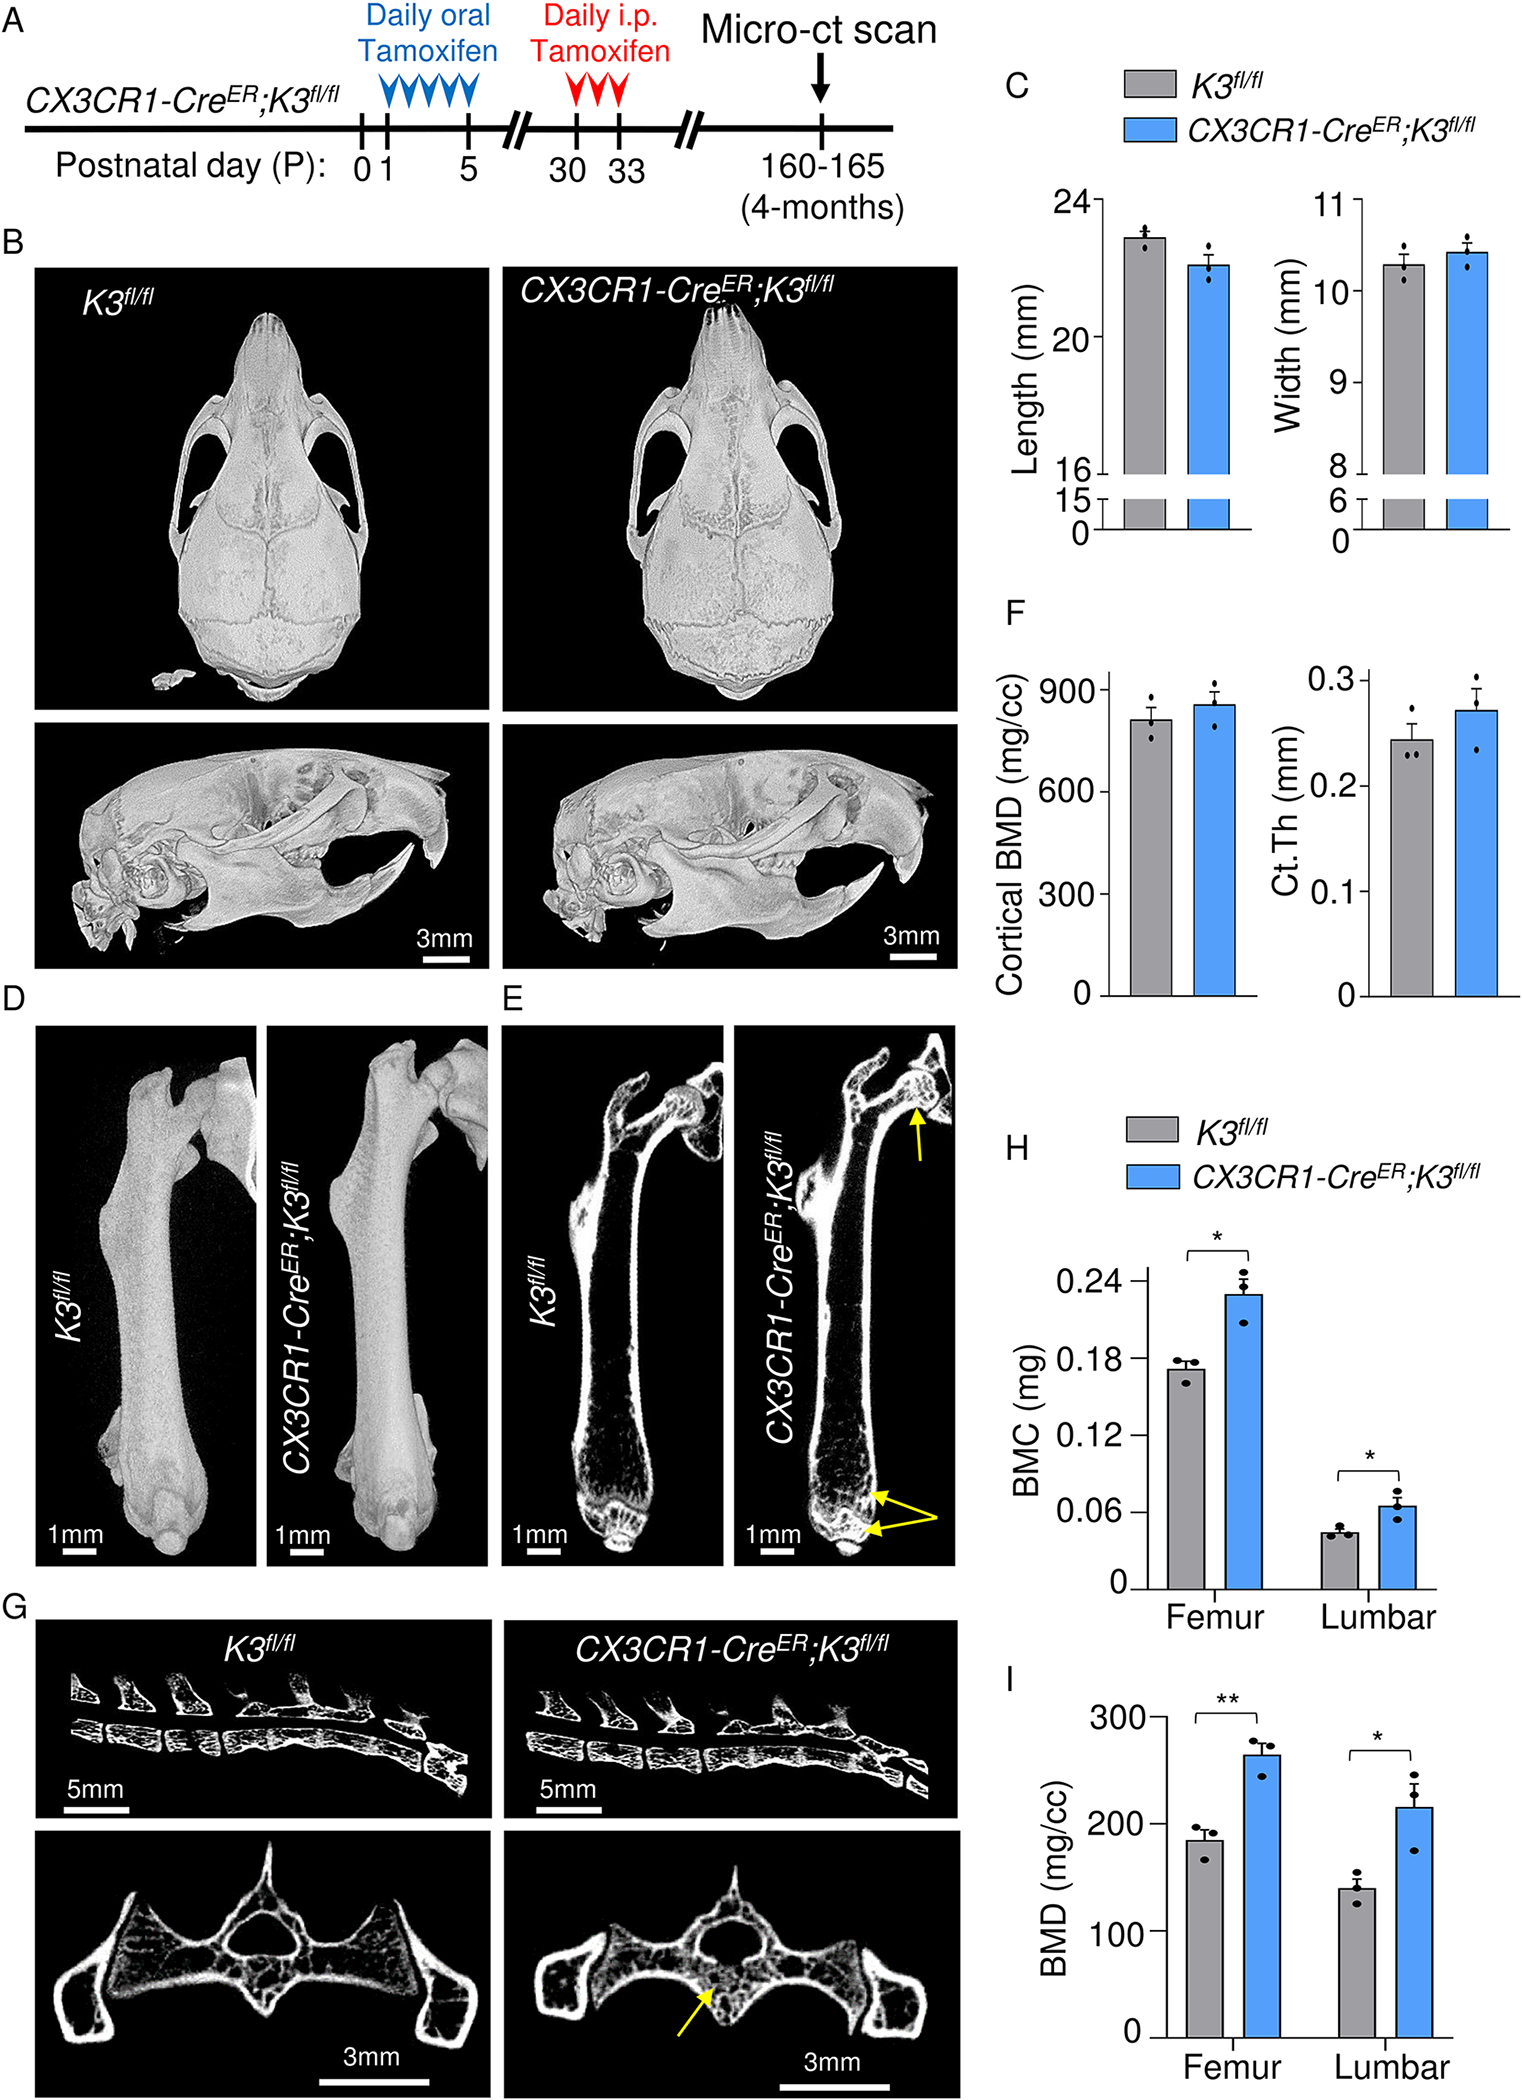
The cellular and molecular mechanisms of bone development and homeostasis are clinically important, but not fully understood. Mutations in integrins and Kindlin3 in humans known as Leukocyte adhesion deficiencies (LAD) cause a wide spectrum of complications, including osteopetrosis. Yet, the rarity, frequent misdiagnosis, and lethality of LAD preclude mechanistic analysis of skeletal abnormalities in these patients. Here, using inducible and constitutive tissue-specific Kindlin3 knockout (K3KO) mice, we show that the constitutive lack of embryonic-Kindlin3 in myeloid lineage cells causes growth retardation, edentulism, and skull deformity indicative of hydrocephaly. Micro-CT analysis revealed craniosynostosis, choanal stenosis, and micrognathia along with other skeletal abnormalities characteristic of osteopetrosis. A marked progression of osteosclerosis occurs in mature to middle-aged adults, resulting in the narrowing of cranial nerve foramina and bone marrow cavities of long bones. However, postnatal-Kindlin3 is less critical for bone remodeling and architecture. Thus, myeloid Kindlin3 is essential for skeletal development and its deficiency leads to autosomal recessive osteopetrosis (ARO). The study will aid in the diagnosis, management, and treatment choices for patients with LAD-III and ARO.

Keywords: Bone analysis; Computerized tomography (CT); Integrins; LAD-III; Osteopetrosis; Teeth.


Conflict of interest statement

1.9 Conflict of interest

The authors declare no competing interests.

Figures

Figure 1:
Figure 1:. Growth retardation and partial edentulism in embryonic Kindlin3-deficient mice.
A. Comparison showing smaller body size for CX3CR1-Cre;K3fl/fl mice. B. Side view of the body of K3fl/fl and CX3CR1-Cre;K3fl/fl mice. The abnormal curvature of the spine in the CX3CR1-Cre;K3fl/fl mouse is indicated by the red arrow. C. Line graph representing weights (grams) of K3fl/fl and CX3CR1-Cre;K3fl/fl mice measured at p-7, p-14, p-21 and every 2 weeks thereafter until 15 weeks. CX3CR1-Cre;K3fl/fl consistently had lower body weights. Every week after p-7, CX3CR1-Cre;K3fl/fl mice were significantly smaller in body weight compared to K3fl/fl. (n=4 mice/group/week; data is represented as mean ± SEM). D. Representative images comparing incisor morphology of K3fl/fl, CX3CR1-Cre;K3fl/fl, and CX3CR1-CreER;K3fl/fl mice. Note the absence of incisors only in the CX3CR1-Cre;K3fl/fl mice. E. Bar graph representing the percentage of mice with normal and abnormal incisors. K3fl/fl (n=15) and CX3CR1-CreER;K3fl/fl (n=12) mice exhibited normal incisor growth with little variation. The CX3CR1-Cre;K3fl/fl (n=15) mouse showed varying levels of dental anomalies, ranging from an absence of incisors to hypoplastic incisors. F. 3D-reconstructed micro-CT scans of K3fl/fl and CX3CR1-Cre;K3fl/fl, with a focus on the oral cavity showing abnormal incisors and missing molars in CX3CR1-Cre;K3fl/fl. G. A sagittal plane micro-CT scan through the maxillary incisors and molars showing anatomical differences in teeth and the surrounding maxillary bone. The K3fl/fl show the normal anatomy of maxillary open-rooted incisors with a prominent pulp cavity (indicated by the red arrow). The maxillary incisor root is significantly smaller and the pulp cavity is non-existent in CX3CR1-Cre;K3fl/fl mice. The K3fl/fl mice show complete maxillary molar eruption, whereas the molars of CX3CR1-Cre;K3fl/fl mice (yellow arrows) fail to erupt due to the presence of bone (purple arrow) over the molars. H. Whole-body micro-CT scans of K3fl/fl and CX3CR1-Cre;K3fl/fl mice at 1 month of age showing no missing bones. The same thresholding and scale bars were applied to both images. *p-value <0.05, **p-value <0.01, ***p-value <0.001. Statistics performed were 2-sample Student’s t-tests.
Figure 2:
Figure 2:. Dome-shaped skull and micrognathia in embryonic Kindlin3-deficient mice.
A. Top (top panel) and side views (bottom panel) of skull and mandible obtained from micro-CT scans of 4-month-old K3fl/fl and CX3CR1-Cre;K3fl/fl mice. CX3CR1-Cre;K3fl/fl mice show cranial sclerosis and fused interfrontal suture (black arrowhead, top panel) and a dome-shaped skull (bottom panel). Red arrows point to the differences in nasal bone structure in the top panel. The yellow arrows in the top panels point to the coronoid process of the mandible. The lower panel shows the increased curvature of the skull and smaller mandible with missing and abnormal teeth (blue arrows) in CX3CR1-Cre;K3fl/fl. Yellow arrowheads in the bottom panel indicate the point to the optic canal and infraorbital foramen. B. An overlay of K3fl/fl (yellow) and CX3CR1-Cre;K3fl/fl (blue) 4-month-old skulls exhibiting a smaller overall skull size and abnormal shape. The same thresholding and scale bars were applied to both skulls. C. Bar graphs showing quantification of skull length, width, height, and angle (n=4 mice/group). In every instance, CX3CR1-Cre;K3fl/fl mice had a significantly smaller length, width, and height, further indicating that the overall skull size is smaller compared to K3fl/fl. The angles obtained from the red lines in the top left and right panels of A show that the CX3CR1-Cre;K3fl/fl mice had a wider skull compared to K3fl/fl. D. Axial plane micro-CT scan showing the posterior nasal aperture (choanae) of mice. CX3CR1-Cre;K3fl/fl mice show narrowing or complete blockage of the choanae (choanal stenosis), as indicated by the red arrows. E. Bar graphs showing quantification of mandible parameters. The yellow dashed lines in the bottom left and right panels of A were used to estimate mandible length (ab) and height (ac) (n=4 mice/group). The CX3CR1-Cre;K3fl/fl mice had both smaller mandible length and height compared to K3fl/fl. *p-value <0.05, **p-value <0.01, ***p-value <0.001. Data shown represent mean ± SEMs. Statistics performed were 2-sample Student’s t-tests.
Figure 3:
Figure 3:. Abnormal long-bone architecture with normal cortical bone parameters in embryonic Kindlin3-deficient mice.
A. Side view of the right femur for 4-month-old K3fl/fl and CX3CR1-Cre;K3fl/fl mice. Yellow lines on both panels indicate how the length of the femur was obtained. Red lines show the abnormal femoral neck-shaft angle of CX3CR1-Cre;K3fl/fl mice. Blue boxes indicate the location of where the ROIs were taken for cortical analysis. The same thresholding and scale bars were applied to both images. B. Bar graph showing quantification of the longitudinal length of the femur (yellow lines in panel A; n=4 mice/group). CX3CR1-Cre;K3fl/fl mice had a significantly shorter length compared to K3fl/fl mice, indicating abnormal longitudinal growth. C. Bar graph showing quantification of the angle of inclination in the femoral neck (red lines in panel A; n=4 mice/group). CX3CR1-Cre;K3fl/fl mice had a significantly smaller angle (110.6 ± 1.5) exhibiting a coxa vara phenotype consistent with osteopetrosis. D. Top (K3fl/fl) and bottom (CX3CR1-Cre;K3fl/fl) panels represent 1-mm sections taken distally at the mid-diaphysis from the right femur. The same thresholding and scale bars were applied to both images. E. Bar graphs representing the values obtained for cortical analysis by Microview Bone Analysis. BMC (bone mineral content) and BMD (bone mineral density) values from ROIs in D (n=4 mice/group). There were no statistically significant differences between K3fl/fl and CX3CR1-Cre;K3fl/fl mice. F. Bar graphs representing the values obtained for cortical analysis by Microview Bone Analysis. Ct.Ar (cortical area), Ct.Th (cortical thickness), and Ma.Ar (marrow area) values from ROIs in D (n=4 mice/group). There were no statistically significant differences between K3fl/fl and CX3CR1-Cre;K3fl/fl mice. ***p-value <0.001. Data shown represent mean ± SEMs. Statistics performed were 2-sample Student’s t-tests.
Figure 4:
Figure 4:. Cortical bone analysis of embryonic Kindlin3-deficient mice at different stages of life.
A. Representative images of 1-mm cortical bone sections taken distally at the mid-diaphysis from the right femur of 1- (top panel) and 8-month old (bottom panel) K3fl/fl and CX3CR1-Cre;K3fl/fl mice. B. Representative cross-sectional view of the right femur from 8-month-old mice showing a near complete absence of central bone marrow cavity in CX3CR1-Cre;K3fl/fl mice. C. Line graphs representing the progression of BMC and BMD values from ROIs in 4A (1 month), 3D (4 months), and 4B (8 months) (n=4 mice/group). A significant increase in BMC is seen only in 8-month-old CX3CR1-Cre;K3fl/fl mice. D. Line graphs representing the progression of Ct.Ar and Ct.Th values from the ROIs used above (n=4 mice/group). The CX3CR1-Cre;K3fl/fl mice showed a significant increase in Ct.Ar and Ct.Th at 8 months. E, F. Line graphs representing the progression of marrow area (Ma.Ar) and Ec.Pm (endocortical perimeter) values from the ROIs above (n=4 mice/group). A significant decrease in Ma.Ar and Ec.Pm is seen in CX3CR1-Cre;K3fl/fl mice only at 8 months. *p-value <0.05, **p-value <0.01. Data shown represent mean ± SEMs. Statistics performed were 2-sample Student’s t-tests.
Figure 5:
Figure 5:. High trabecular BMC and BMD in embryonic Kindlin3-deficient mice.
A. The top panels are representative cross-sectional views of the right femur from 4-month-old K3fl/fl and CX3CR1-Cre;K3fl/fl mice. The yellow arrows point to osteopetrotic and broadened metaphysis. Blue boxes represent where the ROIs were selected for the trabecular analysis, i.e. 1 mm proximally from the epiphyseal line. Middle panels represent a cross-sectional view of the metaphysis. The bottom panels represent the ROIs that were used for trabecular analysis, i.e. 1 mm3 rectangular prisms standardized across all samples (n=4 mice/group). Note the complete absence of trabeculae. The same thresholding and scale bars were applied to each pair of images. B. Top panels are representative cross-sectional views of the spine from 4-month-old K3fl/fl and CX3CR1-Cre;K3fl/fl mice. Yellow arrows point to the over-mineralization at the endplates of the L4 vertebra producing a sclerotic-lucent-sclerotic/sandwich appearance in the CX3CR1-Cre;K3fl/fl mice. Blue boxes represent where the ROIs were selected for the trabecular analysis, i.e. the fifth lumbar vertebrae (L5). Middle left panels represent a cross-sectional view of L5. The bottom panels represent the ROIs used for trabecular analysis. The same thresholding and scale bars were applied to each pair of images. C,D. Bar graphs representing the values obtained for trabecular analysis by Microview Bone Analysis. BV/TV (bone volume/tissue volume) (C), BMC and BMD (D) values were significantly higher in both femur and vertebra of CX3CR1-Cre;K3fl/fl mice (n=4 mice/group). E. Bar graphs comparing Tb.Th (trabecular thickness), Tb.N (trabecular number), and Tb.Sp (trabecular spacing) of K3fl/fl and CX3CR1-Cre;K3fl/fl mice (n=4 mice/group). Tb.Th and Tb.Sp were significantly different in both femur and vertebra of the CX3CR1-Cre;K3fl/fl mice compared to K3fl/fl. Tb.N was lower in the femur, but not the vertebrae, of CX3CR1-Cre;K3fl/fl mice in comparison to K3fl/fl. *p-value <0.05, **p-value <0.01, ***p-value <0.001. Data shown represent mean ± SEMs. Statistics performed were 2-sample Student’s t-tests.
Figure 6:
Figure 6:. Bone-in-bone appearance of embryonic Kindlin3-deficient mouse pelvis.
A. Top panels are micro-CT scans representing the pelvis of 4-month-old mice. Note the decreased length and sclerosis of the CX3CR1-Cre;K3fl/fl pelvis. The bottom panels represent a cross-sectional view at L5 showing the bone-in-bone appearance. The same thresholding and scale bars were applied to each pair of images. B. Top view of the CX3CR1-Cre;K3fl/fl mice pelvis showing the smaller size of the pelvis with square-shaped iliac bone and prominent sclerosis. C. Bar graphs representing BMC and BMD values obtained from the iliac bones (n=4 mice/group). ***p-value <0.001. Data shown represent mean ± SEMs. Statistics performed were 2-sample Student’s t-tests.
Figure 7:
Figure 7:. Mild osteopetrosis in postnatal Kindlin3-deficient mice.
A. CX3CR1-CreER;K3fl/fl mice were administered tamoxifen orally from P1 to P5 (red arrowheads) and injected on P30 for three consecutive days (red arrowheads). Micro-CT scans were taken at 4 months (indicated by black arrows). B. Top (top panel) and side views (bottom panel) of skull and mandible obtained from micro-CT scans of 4-month-old K3fl/fl and CX3CR1-CreER;K3fl/fl mice. No significant differences in teeth, skull shape, mandible, or foramen were observed between the two genotypes. C. Bar graphs showing quantification of skull length and width (n=3 mice/group). D. Side view of the right femur from 4-month-old K3fl/fl and CX3CR1-CreER;K3fl/fl mice. E. Representative cross-sectional views of the right femur from 4-month-old K3fl/fl and CX3CR1-CreER;K3fl/fl mice. Yellow arrows indicate sclerosis at the proximal epiphysis (femoral head), metaphysis, and distal epiphysis. F. Bar graphs representing the BMD and Ct.Th values obtained for cortical analysis ROIs in D (n=3 mice/group). G. Top panels are representative cross-sectional views of the spine from 4-month-old K3fl/fl and CX3CR1-CreER;K3fl/fl mice. Lower panels represent a cross-sectional view of L6 vertebra and pelvis. Yellow arrows indicate sclerosis of the trabecular compartment in the body of L6. H, I. Bar graphs representing the BMC and BMD values obtained from trabecular bone analysis of femur and L5 vertebra. They were significantly higher in both femur and vertebra of CX3CR1-CreER;K3fl/fl mice (n=3 mice/group). *p-value <0.05, **p-value <0.01. Data shown represent mean ± SEMs. Statistics performed were 2-sample Student’s t-tests.

Similar articles

Cited by

References

    1. Sobacchi C, Schulz A, Coxon FP, Villa A, Helfrich MH. Osteopetrosis: genetics, treatment and new insights into osteoclast function. Nat Rev Endocrinol. 2013;9(9):522–36. Epub 2013/07/24. doi: 10.1038/nrendo.2013.137. - DOI - PubMed
    1. Lazner F, Gowen M, Pavasovic D, Kola I. Osteopetrosis and osteoporosis: two sides of the same coin. Hum Mol Genet. 1999;8(10):1839–46. Epub 1999/09/02. doi: 10.1093/hmg/8.10.1839. - DOI - PubMed
    1. Kant P, Sharda N, Bhowate RR. Clinical and Radiological Findings of Autosomal Dominant Osteopetrosis Type II: A Case Report. Case Rep Dent. 2013;2013:707343. Epub 2013/11/22. doi: 10.1155/2013/707343. - DOI - PMC - PubMed
    1. Reddy Mh R Osteopetrosis (Marble Bone Disease): A Rare Disease in Children. Int J Clin Pediatr Dent. 2011;4(3):232–4. Epub 2011/09/01. doi: 10.5005/jp-journals-10005-1115. - DOI - PMC - PubMed
    1. Yadav S, Chalise S, Chaudhary S, Shah GS, Gupta MK, Mishra OP. Osteopetrosis in two siblings: two case reports. BMC Res Notes. 2016;9:55. Epub 2016/01/31. doi: 10.1186/s13104-016-1869-x. - DOI - PMC - PubMed

Publication types