. 2022 Jun;49(6):3999-4017.
doi: 10.1002/mp.15637. Epub 2022 Apr 12.

A high-resolution dose calculation engine for X-ray microbeams radiation therapy

Affiliations

A high-resolution dose calculation engine for X-ray microbeams radiation therapy

Sarvenaz Keshmiri et al. Med Phys. 2022 Jun.

Abstract

Background: Microbeam radiation therapy (MRT) is a treatment modality based on spatial fractionation of synchrotron generated X-rays into parallel, high dose, microbeams of a few microns width. MRT is still an underdevelopment radiosurgery technique for which, promising preclinical results on brain tumors and epilepsy encourages its clinical transfer.

Purpose: A safe clinical transfer of MRT needs a specific treatment planning system (TPS) that provides accurate dose calculations in human patients, taking into account the MRT beam's properties (high-dose gradients, spatial fractionation, polarization effects). So far, the most advanced MRT TPS, based on a hybrid dose calculation algorithm, is limited to a macroscopic rendering of the dose and does not account for the complex dose distribution inherent to MRT if delivered as conformal irradiations with multiple incidences. For overcoming these limitations, a multi-scale full Monte-Carlo calculation engine called penMRT has been developed and benchmarked against two general-purpose Monte Carlo (MC) codes: penmain based on PENELOPE and Gate based on Geant4.

Methods: PenMRT, is based on the PENELOPE (2018) MC code, modified to take into account the voxelized geometry of the patients (computed tomography [CT]-scans) and is offering an adaptive micrometric dose calculation grid independent of the CT size, location, and orientation. The implementation of the dynamic memory allocation in penMRT, makes the simulations feasible within a huge number of dose scoring bins. The possibility of using a source replication approach to simulate arrays of microbeams, and the parallelization using OpenMPI have been added to penMRT in order to increase the calculation speed for clinical usages. This engine can be implemented in a TPS as a dose calculation core.

Results: The performance tests highlight the reliability of penMRT to be used for complex irradiation conditions in MRT. The benchmarking against a standard PENELOPE code did not show any significant difference for calculations in centimetric beams, for a single microbeam and for a microbeam array. The comparisons between penMRT and Gate as an independent MC code did not show any difference in the beam paths, whereas, in valley regions, relative differences between the two codes rank from 1% to 7.5% which are probably due to the differences in physics lists that are used in these two codes. The reliability of the source replication approach has also been tested and validated with an underestimation of no more than 0.6% in low-dose areas.

Conclusions: Good agreements (a relative difference between 0% and 8%) were found when comparing calculated peak to valley dose ratio values using penMRT, for irradiations with a full microbeam array, with calculated values in the literature. The high-resolution calculated dose maps obtained with penMRT are used to extract differential and cumulative dose-volume histograms (DVHs) and analyze treatment plans with much finer metrics regarding the irradiation complexity. To our knowledge, these are the first high-resolution dose maps and associated DVHs ever obtained for cross-fired microbeams irradiation, which is bringing a significant added value to the field of treatment planning in spatially fractionated radiation therapy.

Keywords: Monte Carlo method; dose calculation engine; medium energy X-rays; microbeam radiation therapy; micrometric dose calculation grids; synchrotron radiation.


Conflict of interest statement

The authors have no conflicts to disclose.

Figures

FIGURE 1
FIGURE 1
(a) Block‐diagram of penmain released by Salvat et al. (b) Block‐diagram of penMRT highlighting voxelized geometry processing along with quadric geometry and parallelization
FIGURE 2
FIGURE 2
Geometric characteristics of penMRT. (a) A quadric geometry (b) or/and a voxelized geometry can be taken into account. A source replication option is added to penMRT in order to discard the need to model the multislit collimator. A typical synchrotron‐generated X‐ray filtered spectrum, as used in small animals studies, is represented on the left
FIGURE 3
FIGURE 3
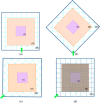
Multi‐scale dose calculation grid configuration. The green arrow represents the direction of the incident beam. Zone (I), zone (II), and zone (III) represent the high‐, medium‐ and low‐resolution regions, respectively. (a) An example of multi‐scale dose calculation grid in which the dose information in the beam entrance and after the target is not needed to be rendered at a micrometric resolution. The high‐resolution calculation grid is confined to the center of the phantom. (b) Same as “a” but with a 45 degrees beam angle. The grid is rotated to remain perpendicular to the beam axis. (c) The dose map obtained in the “b” configuration is rotated to be presented in the same coordinates as the reference orientation. (d) Post‐processing operation performed on the dose map shown in “c”; the dose map is resampled to be presented in an orthonormal grid
FIGURE 4
FIGURE 4
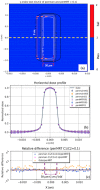
Cross‐validation of dose maps and dose profiles obtained by penmain, Gate and penMRT in a water phantom irradiated by a 2 × 2 cm2 broad beam field at a depth of 2 cm. (a) 2%/1 mm relative gamma index test where the dose map of penmain as the reference is compared to penMRT (C1 = C2 = 0.1). (b) Comparison of horizontal dose profiles, (c) Relative difference between horizontal dose profiles obtained by penMRT, penmain, and Gate (reference: penmain with C1 = C2 = 0.01, 0.1 and Gate, respectively.) (d) Comparison of vertical and horizontal dose profiles obtained with penMRT, penmain (C1 = C2 = 0.1) and Gate. (e) Relative difference between vertical dose profiles obtained by penMRT, penmain and Gate (reference: penmain with C1 = C2 = 0.01, 0.1 and Gate, respectively)
FIGURE 5
FIGURE 5
Cross‐validation of dose maps obtained by penmain, Gate, and penMRT in a water phantom irradiated by a 50 μm × 2 cm single microbeam field. (a) Relative gamma index test of 2%/5 μm where the dose map of penmain as the reference is compared to penMRT (C1 = C2 = 0.1). (b) Horizontal profiles were obtained by penMRT, Gate, and penmain. (c) Relative difference between penMRT, penmain and Gate (reference: penmain with C1 = C2 = 0.01, 0.1 and Gate, respectively)
FIGURE 6
FIGURE 6
(a) PDDs in broad beam obtained by penmain and penMRT with C1 and C2 values of 0.01, 0.05, and 0.1 and Gate. (b) Relative difference between PDD of penMRT/penmain (reference: penmain with C1 = C2 = 0.01 and 0.1) and penMRT/Gate in the broad beam. (c) PDDs in a single microbeam obtained by penmain and penMRT, with C1 and C2 values of 0.01, 0.05, and 0.1 and Gate. (d) Relative difference between the PDD obtained by penMRT/penmain (reference: penmain with C1 = C2 = 0.01 and 0.1) and penMRT/Gate in the single microbeam. PDD, percentage depth dose
FIGURE 7
FIGURE 7
(a) Dose map for a 2 × 2 cm2 MRT irradiation field. The position of the horizontal dose profile is shown with a dashed line. (b) Horizontal dose profile at 2 cm of depth. (c) Central peak. (d) Central valley PDD. MRT, microbeam radiation therapy; PDD, percentage depth dose
FIGURE 8
FIGURE 8
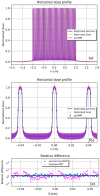
(a) Comparison of horizontal MRT profiles in a field created by penMRT and the fields created using single microbeam replication in penmain and Gate. (b) A zoom on horizontal profile. (c) The relative difference between penMRT/penmain and penMRT/Gate horizontal profiles. MRT, microbeam radiation therapy
FIGURE 9
FIGURE 9
(a) Comparison of dose profiles (zoom on the central peak and valley) obtained by source replication approach and modeling a multislit collimator in a water phantom irradiated by a 2 × 2 cm2 MRT field at a depth of 2 cm (standard deviation of two sigma is demonstrated in this figure). (b) Relative difference of dose profiles of simulated by source replication approach and multislit collimators. MRT, microbeam radiation therapy
FIGURE 10
FIGURE 10
Simulation of a multi‐directional treatment. (a.I) A cross‐fired dose map given by penMRT. (a.II) The penMRT differential dose–volume histogram on a region of interest of 1 × 1 × 0.1 cm3. (b.I) A cross‐fired dose map given by a penmain. (b.II) The penmain differential dose–volume histogram on the same region of interest. (c) Q–Q plot to investigate the similarity between (a.II) and (b.II)
FIGURE 11
FIGURE 11
Dose maps in XY plan for irradiation fields of 2 × 2 cm2, where X is the horizontal direction perpendicular to the microbeam array direction and Y is representing the depth dose plan. The high‐resolution grid of 0.005 (X direction) × 1 (Y‐direction) × 1 (Z‐direction) mm3 covers a 3 × 6 × 3 cm3 zone and the medium resolution dose grid of 1 × 1 × 1 mm3 covers an 18 × 18 × 18 cm3 of the water phantom. The direction of beam propagation is shown with a green arrow. (a.I) The macroscopic vision of the irradiated zone with a single MRT field showing micrometric and millimetric dose calculation grids on the same axis. (a.II) A zoom on a high‐resolution region at the center of the figure. (a.III) dDVH of a ROI irradiated by a single MRT field. To have a better visualization, a zoom on higher dose region is given. (b.I) The macroscopic visualization of the irradiated zone by three MRT fields (0, 35, and 90° incidences). (b.II) A zoom on an ROI with high resolution. The dose hot spots from two and three crossing peaks can be seen here. (b.III) dDVH of an ROI in three irradiation field treatments with a zoom on higher dose area. dDVH, Differential dose‐volume histogram; MRT, microbeam radiation therapy; ROI, region of interest

References

    1. Chargari C, Magne N, Guy JB, et al. Optimize and refine therapeutic index in radiation therapy: overview of a century. Cancer Treat Rev. 2016;45:58–67. 10.1016/j.ctrv.2016.03.001 - DOI - PubMed
    1. Favaudon V, Caplier L, Monceau V, et al. Ultrahigh dose‐rate FLASH irradiation increases the differential response between normal and tumor tissue in mice. Sci Transl Med. 2014;6(245):245ra93. 10.1126/scitranslmed.3008973 - DOI - PubMed
    1. Eling L, Bouchet A, Nemoz C, et al. Ultra high dose rate synchrotron microbeam radiation therapy. Preclinical evidence in view of a clinical transfer. Radiother Oncol. 2019;139:56–61. 10.1016/j.radonc.2019.06.030 - DOI - PubMed
    1. Montay‐Gruel P, Corde S, Laissue JA, Bazalova‐Carter M. FLASH radiotherapy with photon beams. Med Phys. 2022;49(3):2055–2067. 10.1002/mp.15222. Published online September 14, 2021:mp.15222. - DOI - PubMed
    1. Bouchet A, Lemasson B, Christen T, et al. Synchrotron microbeam radiation therapy induces hypoxia in intracerebral gliosarcoma but not in the normal brain. Radiother Oncol. 2013;108(1):143–148. 10.1016/j.radonc.2013.05.013 - DOI - PubMed