. 2022 Sep;11(18):3457-3470.
doi: 10.1002/cam4.4710. Epub 2022 Mar 28.

Exploration of predictive biomarkers for postoperative recurrence of stage II/III colorectal cancer using genomic sequencing

Affiliations

Exploration of predictive biomarkers for postoperative recurrence of stage II/III colorectal cancer using genomic sequencing

Fumishi Kishigami et al. Cancer Med. 2022 Sep.

Abstract

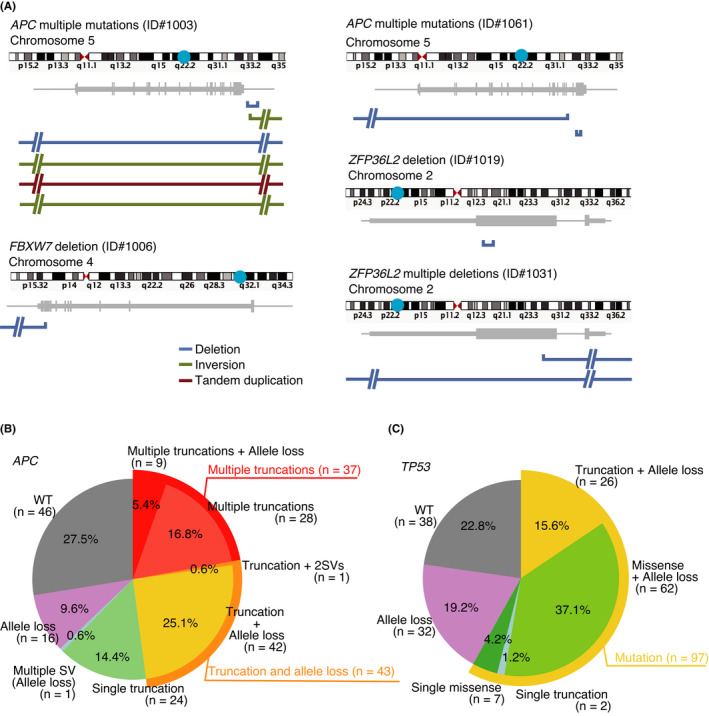
Postoperative recurrence of colorectal cancer (CRC) eventually leads to therapeutic failure; therefore, treatment strategies based on accurate prediction of recurrence are urgently required. To identify biomarkers that can predict treatment outcomes, we compared the mutational profiles of surgically resected specimens from patients with recurrent cancer with those from patients with non-recurrent cancer. Target sequencing, whole-exome sequencing (WES), or whole-genome sequencing (WGS) was performed on 89 and 58 tumors from recurrent and non-recurrent cases, respectively. WGS revealed the driver mutations that were not detected with target sequencing or WES, including the structural variations affecting ZFP36L2. Loss of function of ZFP36L2 was frequently observed in primary tumors from recurrent cases. Furthermore, the recurrence-free survival of patients with loss of function of ZFP36L2 was significantly shorter relative to patients with no loss of ZFP36L2 function. In summary, the study demonstrated that detailed genomic analysis could help improve precision medicine for CRC.

Keywords: ZFP36L2; colorectal cancer; precision medicine; whole genome sequence.


Conflict of interest statement

All the authors declare that they have no competing interests.

Figures

FIGURE 1
FIGURE 1
Study overview. Numbers outside parenthesis: tumor specimens subjected to genomic analysis; Numbers inside parenthesis: patients from which tumor specimens were collected; CRC, colorectal cancer; nrCRC, non‐recurrent CRC; rCRC, recurrent CRC; RNA‐seq, transcriptome sequencing; Target seq, target sequencing
FIGURE 2
FIGURE 2
Mutational profiles in colorectal cancer. (A) Thirty most frequently mutated genes detected via whole‐exome sequencing and color‐coded mutation status for individual tumors. Mutation frequencies per gene in each study group are shown on the right. (B) Thirty most frequently mutated genes detected via whole‐genome sequencing and color‐coded mutation status for individual tumors. Structural variation frequencies in individual tumors and genes are shown at the top and on the right, respectively. Tumor pairs from the same patient are marked by brown squares. Frequencies of synonymous or non‐synonymous substitutions and insertions/deletions are shown at the top. Percentages of the mutational signatures are shown at the bottom. The cosine similarity of detected mutational signatures with COSMIC signatures is shown in the right panel
FIGURE 3
FIGURE 3
Copy number alterations in colorectal cancer. (A) Copy number alterations per subtype. Red and blue lines indicate Q‐values for gains and losses, respectively. (B) Overall survival and recurrence‐free survival according to the presence of indicated copy number alterations. Survival curves were estimated using the Kaplan–Meier method and compared using a two‐sided log‐rank test. (C) Pathways enriched in genes whose expression was upregulated in tumors with the copy number gain of chr 1: 144,000,000–164,000,000. (D) Pathways enriched in genes whose expression was downregulated in tumors with the copy number gain of chr 1: 144,000,000–164,000,000. CRC, colorectal cancer; nrCRC, non‐recurrent CRC; rCRC, recurrent CRC
FIGURE 4
FIGURE 4
Structural variations in colorectal cancer. (A) Schematic diagrams of structural variations in representative genes. Chromosomes are shown at the top and genes are shown in the middle. In the lower part, deletions are shown in blue, inversions in green, and tandem duplications in red. (B and C) Biallelic mutational status of APC and TP53, respectively
FIGURE 5
FIGURE 5
Clinical implication of mutations in ZFP36L2. (A) Mutations in ZFP36L2 identified in this study. (B) Recurrence‐free survival and overall survival of patients with colorectal tumors according to the mutational status of ZFP36L2. Survival curves were estimated using the Kaplan–Meier method and compared using a two‐sided log‐rank test. Analysis of recurrence‐free survival and overall survival with key features using Cox proportional‐hazards model are also shown. (C) Pathways enriched in genes whose expression was upregulated in tumors with ZFP36L2 mutations. (D) Pathways enriched in genes whose expression was downregulated in tumors with ZFP36L2 mutations. (E) Recurrence‐free survival and overall survival of patients with colorectal tumors according to the mutational status of ZFP36L2, KRAS, or BRAF. (F) Recurrence‐free survival and overall survival of patients with colorectal tumors by mutational status of KRAS or BRAF. (G) Euler diagram showing the number of patients with mutations in ZFP36L2, KRAS, or BRAF. Survival curves were estimated using the Kaplan–Meier method and compared using a two‐sided log‐rank test
FIGURE 6
FIGURE 6
Clonal analysis of metachronous and synchronous tumors. Metachronous tumors are shown on the left side, and synchronous tumors are shown on the right side. For individual cases, the anatomical locations are shown on the left, and the clonal evolutionary process is shown on the right. Cases in which tumors were derived from the same clone are marked by a blue box and those derived from independent clones by an orange box. Cases where the origin of tumors was difficult to infer clinically are marked by dotted‐line boxes. Numbers in circles indicate the number of mutations considered for clonal analysis. Tumor identification is indicated by four‐digit numbers. Anast, anastomosis; GL, germ line; Rec, recurrence

References

    1. Gill S, Loprinzi CL, Sargent DJ, et al. Pooled analysis of fluorouracil‐based adjuvant therapy for stage II and III colon cancer: who benefits and by how much? J Clin Oncol. 2004;22:1797‐1806. - PubMed
    1. Figueredo A, Charette ML, Maroun J, Brouwers MC, Zuraw L. Adjuvant therapy for stage II colon cancer: a systematic review from the Cancer Care Ontario program in evidence‐based Care's gastrointestinal cancer disease site group. J Clin Oncol. 2004;22:3395‐3407. - PubMed
    1. Kannarkatt J, Joseph J, Kurniali PC, al‐Janadi A, Hrinczenko B. Adjuvant chemotherapy for stage II colon cancer: a clinical dilemma. J Oncol Pract. 2017;13:233‐241. - PubMed
    1. Seshagiri S, Stawiski EW, Durinck S, et al. Recurrent R‐spondin fusions in colon cancer. Nature. 2012;488:660‐664. - PMC - PubMed
    1. The Cancer Genome Atlas Network . Comprehensive molecular characterization of human colon and rectal cancer. Nature. 2012;487:330‐337. - PMC - PubMed

Publication types

LinkOut - more resources