. 2022 Sep;18(9):2198-2215.
doi: 10.1080/15548627.2022.2025570. Epub 2022 Mar 28.

The role of FYCO1-dependent autophagy in lens fiber cell differentiation

Affiliations

The role of FYCO1-dependent autophagy in lens fiber cell differentiation

Shahid Y Khan et al. Autophagy. 2022 Sep.

Abstract

FYCO1 (FYVE and coiled-coil domain containing 1) is an adaptor protein, expressed ubiquitously and required for microtubule-dependent, plus-end-directed transport of macroautophagic/autophagic vesicles. We have previously shown that loss-of-function mutations in FYCO1 cause cataracts with no other ocular and/or extra-ocular phenotype. Here, we show fyco1 homozygous knockout (fyco1-/-) mice recapitulate the cataract phenotype consistent with a critical role of FYCO1 and autophagy in lens morphogenesis. Transcriptome coupled with proteome and metabolome profiling identified many autophagy-associated genes, proteins, and lipids respectively perturbed in fyco1-/- mice lenses. Flow cytometry of FYCO1 (c.2206C>T) knock-in (KI) human lens epithelial cells revealed a decrease in autophagic flux and autophagic vesicles resulting from the loss of FYCO1. Transmission electron microscopy showed cellular organelles accumulated in FYCO1 (c.2206C>T) KI lens-like organoid structures and in fyco1-/- mice lenses. In summary, our data confirm the loss of FYCO1 function results in a diminished autophagic flux, impaired organelle removal, and cataractogenesis.Abbreviations: CC: congenital cataracts; DE: differentially expressed; ER: endoplasmic reticulum; FYCO1: FYVE and coiled-coil domain containing 1; hESC: human embryonic stem cell; KI: knock-in; OFZ: organelle-free zone; qRT-PCR: quantitative real-time PCR; PE: phosphatidylethanolamine; RNA-Seq: RNA sequencing; SD: standard deviation; sgRNA: single guide RNA; shRNA: shorthairpin RNA; TEM: transmission electron microscopy; WT: wild type.

Keywords: Autophagy; cataracts; lens fiber cells; organelle removal; organelle-free zone.


Conflict of interest statement

No potential conflict of interest was reported by the author(s).

Figures
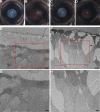
Figure 1.
Figure 1.
Phenotypic assessment of fyco1 homozygous knockout (fyco1−/−) mice lenses revealed bilateral cataracts and abnormal morphology of lens epithelial and fiber cells. (A–D) Assessment of lens opacities in the knockout mice lenses. The examination identified cataracts in (A) 16-weeks old Ella-Cre-mediated fyco1−/− and (C) 16-weeks old Prm1-Cre-mediated fyco1−/− mice lenses. No cataracts were observed in age-matched (B) Ella-Cre-mediated fyco1+/− and (D) Prm1-Cre-mediated fyco1+/−. (E–H) Transmission electron microscopy (TEM) of wild type (WT) and fyco1−/− mouse lens at postnatal day 60 (P60). The analysis of WT mouse lens revealed a normal morphology of lens epithelial and fiber cells (E, G). In contrast, fyco1−/− mouse lens epithelial cells show extensive vacuolization while fiber cells are large and exhibit irregular shapes (F, H). Note: Image magnifications: 1,850x (E, F), and 3,400x (G, H); Scale bars: 5 µm (E, F), and 2 µm (G, H). Panels G and H are enlarged images of the boxed areas in panels E and F, respectively.
Figure 2.
Figure 2.
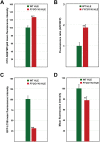
Functional assessment of fyco1 homozygous knockout (fyco1−/−) mice lenses revealed impaired autophagy. (A) Volcano plot illustrating the differential abundance or deficiency of proteins in fyco1−/− mice lenses at postnatal day 0 (P0). A comparative analysis identified 160 proteins (>2 standard deviation (SD)) including 19 proteins exhibiting abundance and 141 with diminished quantities in fyco1−/− mice lenses compared to wild type (WT) mice lenses. Proteins exhibiting abundance are shown in light red (SD > 2) and dark red (SD ≥ 6), and diminished counts are shown in light blue (SD > -2) and dark blue (SD ≥ -6) in fyco1−/− mice lenses. Note: the fold change is represented in log2 scale, depicted on the x-axis and the statistical significance is represented in −log10 scale, depicted on the y-axis. The use of −log10 values means that proteins having greater statistical significance are higher in the plot. (B) The proteome analysis detected a 1.61-fold higher concentration of SQSTM1/p62 in fyco1−/− mice lenses at P0 compared to age-matched WT mice lenses. Asterisks: p < 0.05. (C) Capillary electrophoresis-based Western blot analysis revealed an accumulation of SQSTM1/p62 in fyco1−/− mice lenses at P0. (D) Quantification of Western blot revealed 1.48-fold higher levels of SQSTM1/p62 in fyco1−/− mice lenses at P0 compared to age-matched WT mice lenses. The SQSTM1/p62 levels were normalized against ACTB/β-Actin. Asterisks: p < 0.05. (E,F) Multiphoton laser-scanning microscopy was performed on CAG-RFP-GFP-Map1lc3b WT and CAG-RFP-GFP-Map1lc3b-fyco1−/− mice lenses. The analysis revealed (E) 1.3- and (F) 1.6-fold higher GFP intensity in the whole lens and the anterior lens including lens epithelium, respectively. Asterisks: p < 0.05.
Figure 3.
Figure 3.
Functional analysis of FYCO1 (c.2206C>T) knock-in (KI) human lens epithelial (HLE) cells revealed impaired autophagy. (A) Flow cytometry-based quantification of endogenous SQSTM1/p62 in FYCO1 KI HLE cells. The analysis revealed accumulation of SQSTM1/p62 in FYCO1 KI HLE cells compared to wild type (WT) cells. Asterisks: p < 0.0005. (B) Flow cytometry-based quantification of autophagic flux in FYCO1 KI HLE cells using a tandem fluorescent-tagged LC3B plasmid (mRFP-GFP-LC3). The analysis revealed a higher GFP to RFP ratio in FYCO1 KI HLE cells compared to WT cells. Asterisk: p < 0.05. (C) Flow cytometry-based quantification of exogenously expressed GFP labeled LC3B in FYCO1 KI HLE cells. The analysis revealed a 69% reduced GFP fluorescence intensity in FYCO1 KI HLE cells compared with WT HLE cells. Asterisks: p = 9.068e−12. (D) Flow cytometry-based quantification of CYTO-ID labeled autophagic vesicles in FYCO1 KI HLE cells. The analysis revealed a reduced green fluorescence intensity in FYCO1 KI HLE cells compared with WT HLE cells. Asterisks: p = 3.475e−5.
Figure 4.
Figure 4.
FYCO1 (c.2206C>T) knock-in (KI) human embryonic stem cell (hESC)-derived lentoid bodies revealed opaque central zones. Phase-contrast microscopy was performed on differentiation days 25 and 35 during lentoid body formation. On differentiation day 25, FYCO1 KI hESC-derived lentoid bodies show reduced transparency in the central zones compared with wild type (WT) hESC-derived lentoid bodies. The effect of the KI allele becomes more evident on day 35 with opaque zones present in the FYCO1 KI hESC-derived lentoid bodies, in sharp contrast to the WT hESC-derived lentoid bodies that displayed extensive transparent zones. Note: Image magnification: 5x; Scale bars: 100 μm.
Figure 5.
Figure 5.
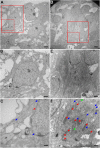
Transmission electron microscopy (TEM) of lens epithelial-like cells revealed retention of cellular organelles in FYCO1 (c.2206C>T) knock-in (KI) human embryonic stem cell (hESC)-derived lentoid bodies on differentiation day 25. (A–C) Wild type (WT) lentoid bodies show relatively fewer endoplasmic reticulum (ER; blue arrow), Golgi apparatus (GA; green arrow), and mitochondria (red arrow), in lens epithelial-like cells. (D–F) In contrast to WT, lens epithelial-like cells in FYCO1 KI hESC-derived lentoid bodies revealed an increased mass of ER, mitochondria, and GA. Note: Image magnifications: 6,000x (A, D), 12,000x (B, E), and 25,000x (C, F); Scale bars: 2 µm (A, D), 1 µm (B, E) and 500 nm (C, F). Panels B and C and panels E and F are enlarged images of the boxed areas (B and E: solid lines; C and F: broken lines) in panels A and D, respectively.
Figure 6.
Figure 6.
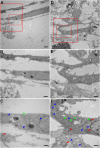
Transmission electron microscopy (TEM) of lens fiber-like cells revealed retention of cellular organelles in FYCO1 (c.2206C>T) knock-in (KI) human embryonic stem cell (hESC)-derived lentoid bodies on differentiation day 25. (A–C) Wild type (WT) lentoid bodies show relatively fewer endoplasmic reticulum (ER; blue arrow), Golgi apparatus (GA; green arrow), and mitochondria (red arrow) in fiber-like cells. (D–F) In contrast to WT, FYCO1 KI hESC-derived lentoid bodies revealed an increased mass of ER, mitochondria, and GA. Note: Image magnifications: 6,000x (A, D), 12,000x (B, E), and 25,000x (C, F); Scale bars: 2 µm (A, D), 1 µm (B, E) and 500 nm (C, F). Panels B and C and panels E and F are enlarged images of the boxed areas (B and E: solid lines; C and F: broken lines) in panels A and D, respectively.
Figure 7.
Figure 7.
Transmission electron microscopy (TEM) of fyco1 homozygous knockout (fyco1−/−) mice lenses showed increased cellular organelles at postnatal day 0 (P0). (A,B) Wild type (WT) mice lenses at P0 exhibit differentiating fiber cells with few endoplasmic reticulum (ER; blue arrow), Golgi apparatus (GA; green arrow), and mitochondria (red arrow). (C,D) In contrast to WT, fyco1−/− mice differentiating lens fiber cells showed retention of ER, mitochondria, and GA. Note: Image magnifications: 9700x (A, C), and 19,400x (B, D); Scale bars: 500 nm (A, C), and 250 nm (B, D). Panels B and D are enlarged images of the boxed areas in panels A and C, respectively.
Figure 8.
Figure 8.
The proposed model for the role of FYCO1-dependent autophagy in organelle removal during lens fiber cell differentiation. (A) The baseline level of macroautophagy can occur independent of FYCO1, while FYCO1 helps with delivering extra autophagosome membranous structures to meet the physiological requirement of elevated levels of autophagy during creation of the organelle-free zone (OFZ). The cellular organelles are sequestered by the expanding phagophore, leading to the formation of the autophagosome. The autophagosome subsequently fuses with lysosomes, and the sequestered cargos are degraded or processed by hydrolases. (B) In the absence of FYCO1, the basal autophagy in the lens remains uninterrupted. However, the absence of FYCO1 results in a decrease in autophagosome formation to meet the physiological requirement of elevated levels of autophagy for organelle removal during the creation of the OFZ, which in turn, results in impaired organelle removal accompanied by altered expression of many proteases and cataractogenesis.

References

    1. Jean D, Ewan K, Gruss P.. Molecular regulators involved in vertebrate eye development. Mech Dev. 1998;76(1–2):3–18. - PubMed
    1. McAvoy JW, Chamberlain CG, de Iongh RU, et al. Lens development. Eye (Lond). 1999;13(Pt 3b):425–437. - PubMed
    1. Bassnett S, Mataic D. Chromatin degradation in differentiating fiber cells of the eye lens. J Cell Biol. 1997;137(1):37–49. - PMC - PubMed
    1. Wride MA. Lens fibre cell differentiation and organelle loss: many paths lead to clarity. Philos Trans R Soc Lond B Biol Sci. 2011;366(1568):1219–1233. - PMC - PubMed
    1. Zandy AJ, Bassnett S. Proteolytic mechanisms underlying mitochondrial degradation in the ocular lens. Invest Ophthalmol Vis Sci. 2007;48(1):293–302. - PubMed

Publication types