. 2022 Mar 28;79(4):213.
doi: 10.1007/s00018-022-04211-7.

ER-mitochondria communication is involved in NLRP3 inflammasome activation under stress conditions in the innate immune system

Affiliations

ER-mitochondria communication is involved in NLRP3 inflammasome activation under stress conditions in the innate immune system

Ana Catarina Pereira et al. Cell Mol Life Sci. .

Abstract

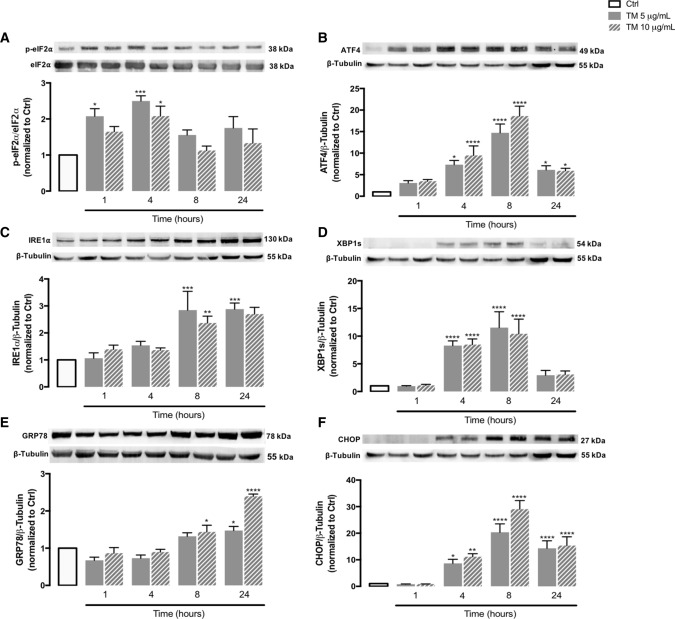
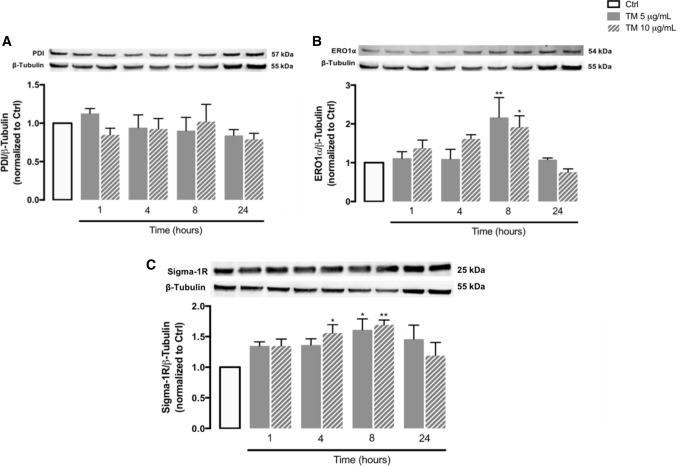
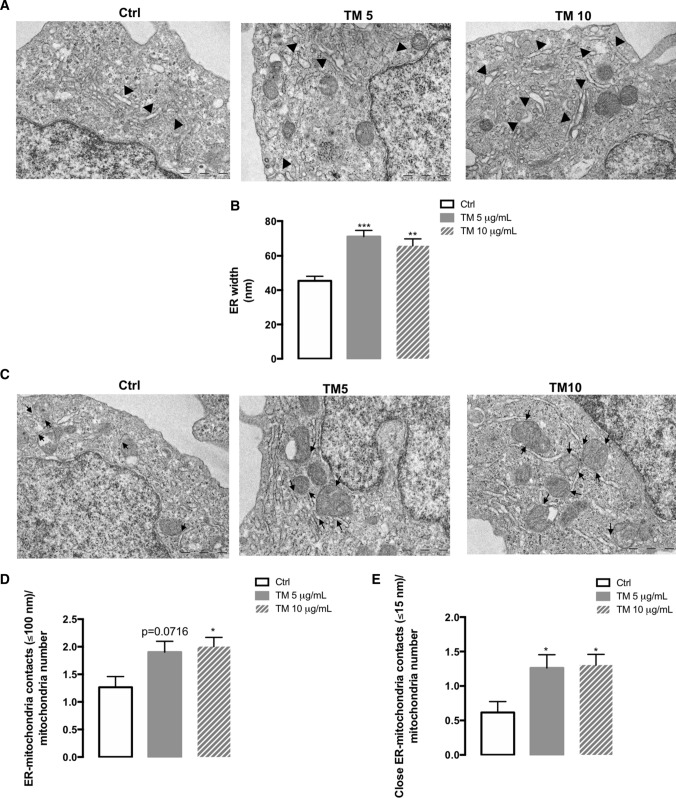
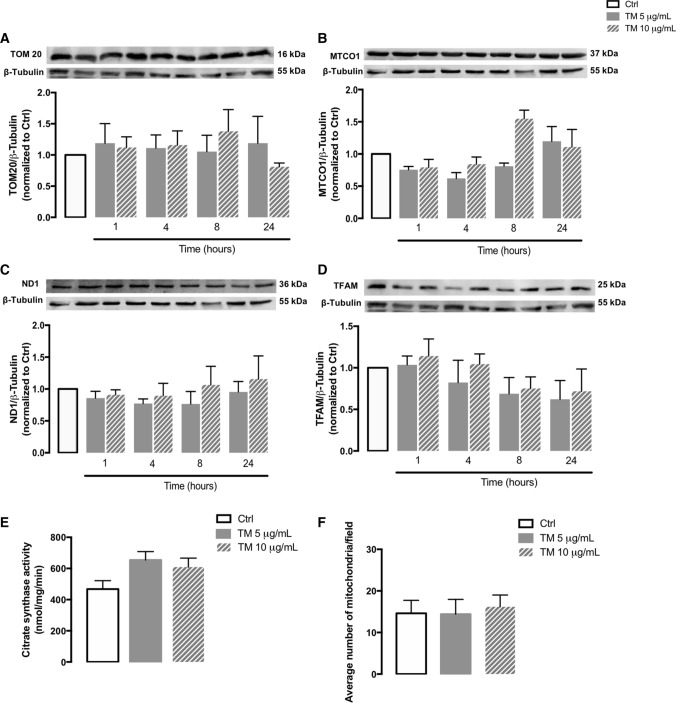
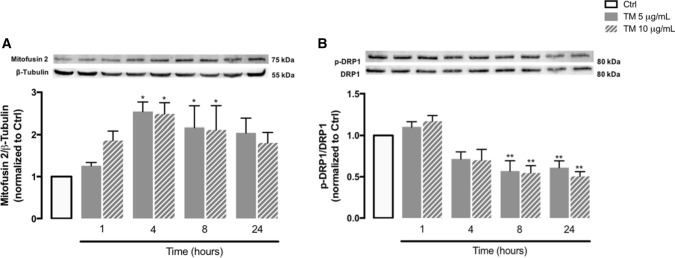
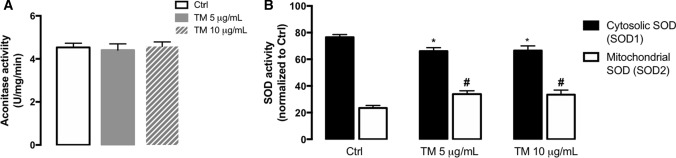
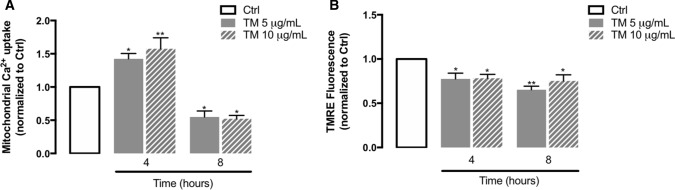
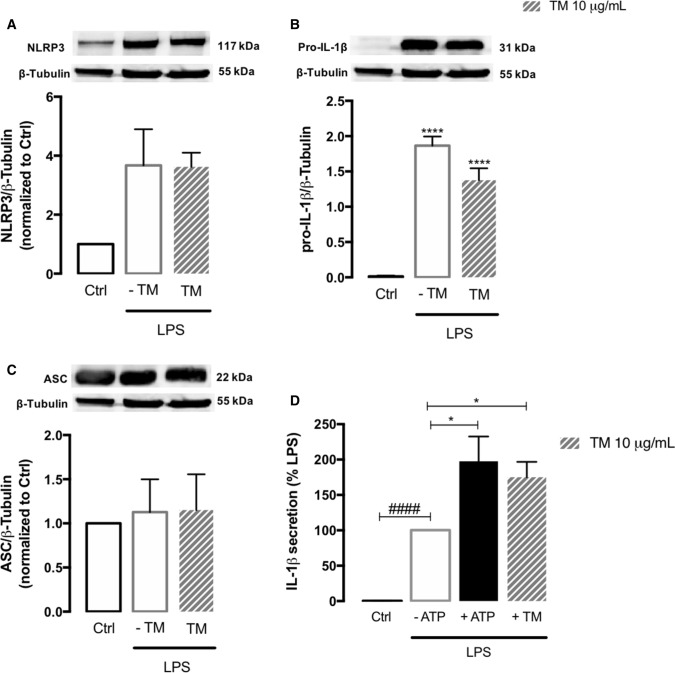
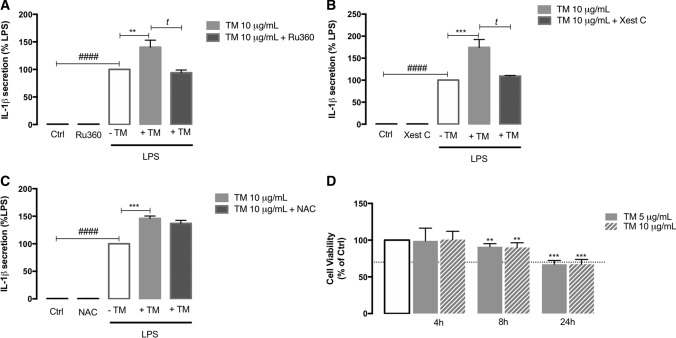
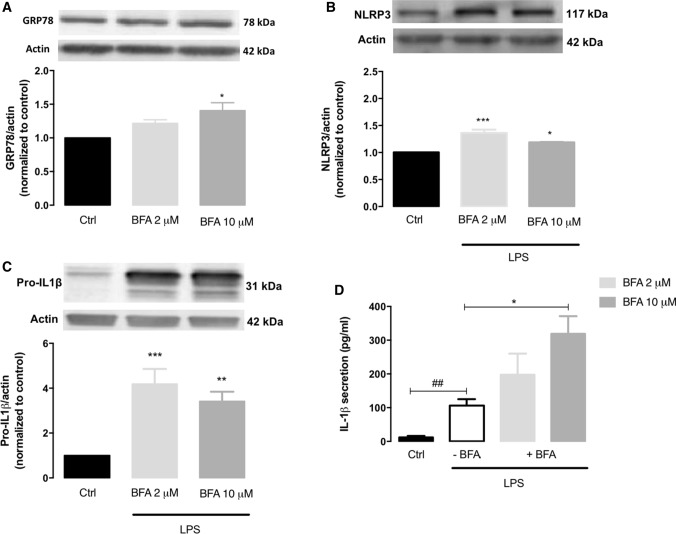
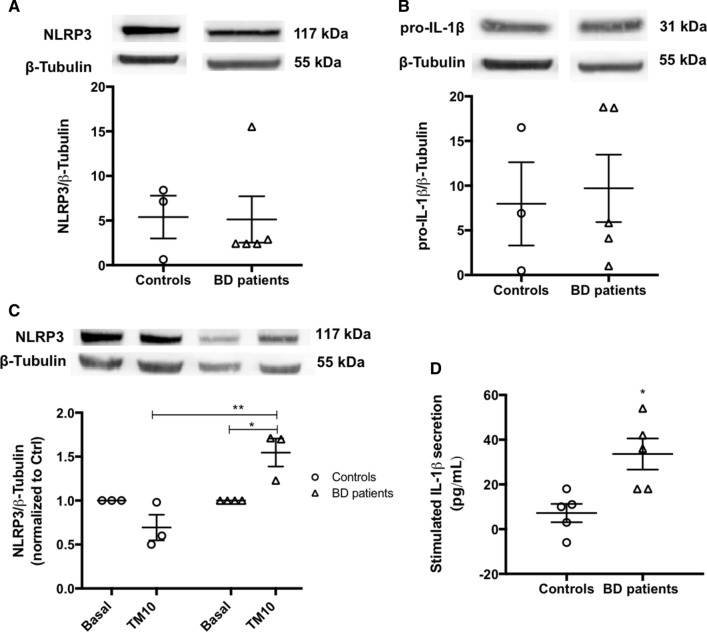
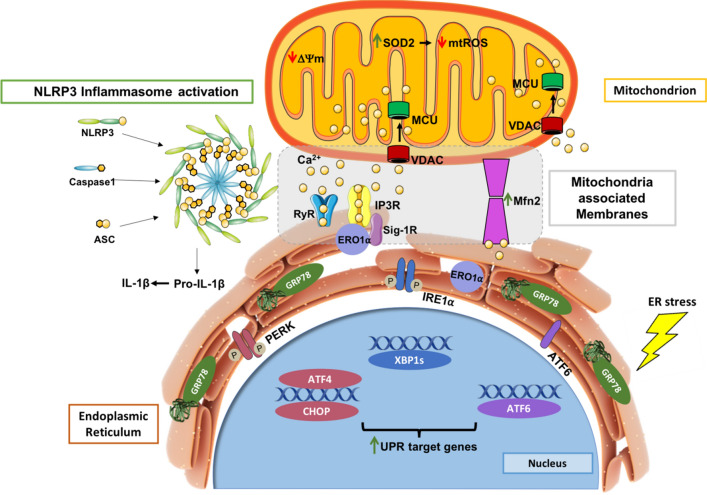
Endoplasmic reticulum (ER) stress and mitochondrial dysfunction, which are key events in the initiation and/or progression of several diseases, are correlated with alterations at ER-mitochondria contact sites, the so-called "Mitochondria-Associated Membranes" (MAMs). These intracellular structures are also implicated in NLRP3 inflammasome activation which is an important driver of sterile inflammation, however, the underlying molecular basis remains unclear. This work aimed to investigate the role of ER-mitochondria communication during ER stress-induced NLRP3 inflammasome activation in both peripheral and central innate immune systems, by using THP-1 human monocytes and BV2 microglia cells, respectively, as in vitro models. Markers of ER stress, mitochondrial dynamics and mass, as well as NLRP3 inflammasome activation were evaluated by Western Blot, IL-1β secretion was measured by ELISA, and ER-mitochondria contacts were quantified by transmission electron microscopy. Mitochondrial Ca2+ uptake and polarization were analyzed with fluorescent probes, and measurement of aconitase and SOD2 activities monitored mitochondrial ROS accumulation. ER stress was demonstrated to activate the NLRP3 inflammasome in both peripheral and central immune cells. Studies in monocytes indicate that ER stress-induced NLRP3 inflammasome activation occurs by a Ca2+-dependent and ROS-independent mechanism, which is coupled with upregulation of MAMs-resident chaperones, closer ER-mitochondria contacts, as well as mitochondrial depolarization and impaired dynamics. Moreover, enhanced ER stress-induced NLRP3 inflammasome activation in the immune system was found associated with pathological conditions since it was observed in monocytes derived from bipolar disorder (BD) patients, supporting a pro-inflammatory status in BD. In conclusion, by demonstrating that ER-mitochondria communication plays a key role in the response of the innate immune cells to ER stress, this work contributes to elucidate the molecular mechanisms underlying NLRP3 inflammasome activation under stress conditions, and to disclose novel potential therapeutic targets for diseases associated with sterile inflammation.

Keywords: Bipolar disorder (BD); Calcium; Endoplasmic reticulum (ER) stress; Mitochondria; Sterile inflammation; Unfolded protein response.


Conflict of interest statement

The authors declare that they have no competing interests.

Figures

Fig. 1
Fig. 1
ER stress-induced UPR in tunicamycin-treated human THP-1 monocytes. Protein levels of markers of ER stress-induced UPR, namely p-eIF2α (A), ATF4 (B), IRE1α (C), XBP1s (D), GRP78 (E) and CHOP (F) were quantified by WB in total cellular extracts obtained from human THP-1 monocytes treated with 5 or 10 μg/mL tunicamycin (TM) during the indicated time periods (1–24 h). β-Tubulin I was used to control protein loading and to normalize the levels of the protein of interest. For p-eIF2α quantification, total eIF2α was used as a protein loading control. Results were calculated relatively to control values and represent the mean ± SEM of at least three independent experiments. Statistical significance between control (untreated cells) and TM-treated cells was determined using the one-way ANOVA test, followed by the Dunnett’s post hoc test: *p < 0.05; **p < 0.01; ***p < 0.001, ****p < 0.0001
Fig. 2
Fig. 2
Stress response mediators under ER stress conditions in human THP-1 monocytes. Protein levels of PDI (A), ERO1α (B) and sigma-1R (C) were quantified by WB in total cellular extracts obtained after treatment of THP-1 cells with 5 or 10 μg/mL tunicamycin (TM), during the indicated time periods (1–24 h). β-Tubulin I was used as a control for protein loading and to normalize the levels of the protein of interest. Results were calculated relatively to control values and represent the mean ± SEM of at least three independent experiments. Statistical significance between control and TM-treated cells was determined using the one-way ANOVA test, followed by Dunnett’s post hoc test: *p < 0.05, **p < 0.01
Fig. 3
Fig. 3
ER morphology and ER-mitochondria contacts under ER stress conditions in human THP-1 monocytes. Alterations in width of ER and in the number of ER-mitochondria contacts due to ER stress were monitored by TEM in human THP-1 monocytes treated with 5 or 10 μg/mL TM for 8 h and compared with untreated cells. (A) Representative images of dilated ER (arrowhead); (B) ER width expressed in nm; (C) Representative images of ER-mitochondria contacts (arrow); (D) Number of ER-mitochondria contacts (≤ 100 nm) normalized to mitochondria number; (E) Number of close ER-mitochondria contacts (≤ 15 nm) normalized to mitochondria number. Results represent the mean ± SEM of 4–5 images per cell obtained from 5 cells analyzed per condition. Statistical significance between control (untreated cells) and TM-treated cells was determined using the one-way ANOVA test, followed by the Dunnett’s post hoc test: *p < 0.05, **p < 0.01, *** p < 0.001
Fig. 4
Fig. 4
Mitochondrial mass and number in human THP-1 monocytes upon ER stress. Protein levels of TOM20 (A), MTCO1 (B), ND1 (C) and TFAM (D) were quantified by WB in total cellular extracts obtained after incubation of THP-1 cells with 5 or 10 μg/mL TM, during the indicated time periods (1–24 h). β-Tubulin I was used as a control for protein loading and to normalize the levels of the protein of interest. Results were calculated relatively to control values and represent the mean ± SEM of at least three independent experiments. Mitochondrial citrate synthase activity (E) was evaluated in total cell lysates obtained after incubation of THP-1 cells with 5 or 10 μg/mL TM for 8 h. Results were expressed in nmol/mg/min and represent the mean ± SEM of at least three independent experiments. The number of mitochondria (F) was also determined in human THP-1 monocytes treated with 5 or 10 μg/mL TM for 8 h and compared to untreated cells, by analyzing TEM images (Fig. 3). Statistical significance between control and TM-treated cells was determined using the one-way ANOVA test, followed by Dunnett’s post hoc test
Fig. 5
Fig. 5
Mitochondrial dynamics in human THP-1 monocytes upon ER stress. Protein levels of Mfn2 (A) and p-DRP1 (B) were quantified by WB in total cellular extracts obtained after incubation of THP-1 cells with 5 or 10 μg/mL TM, during the indicated time periods (1–24 h). β-Tubulin I was used as a control for protein loading and to normalize the levels of the protein of interest. Total DRP1 was used to normalize p-DRP1 levels. The membrane incubated with Sigma-1R antibody was re-probed with Mfn2 antibody and finally, re-probed with the anti-β-Tubulin I antibody. The membrane incubated with p-DRP1 antibody was then re-probed with total DRP1 antibody. Results were calculated relatively to control values and represent the mean ± SEM of at least three independent experiments. Statistical significance between control and TM-treated cells was determined using the one-way ANOVA test, followed by Dunnett’s post hoc test: *p < 0.05, **p < 0.01
Fig. 6
Fig. 6
Redox status under stress conditions in human THP-1 monocytes. Activity of the ROS-sensitive aconitase (A) was evaluated in total cell lysates obtained after incubation of THP-1 cells with 5 or 10 μg/mL TM for 8 h. Results were expressed as U/mg/min and represented as mean ± SEM of three independent experiments. Statistical significance of differences between control and treated cells was determined using the one-way ANOVA test, followed by Dunnett’s post hoc test. The activity of cytosolic SOD1 and mitochondrial SOD2 (B) was analyzed by using a commercial kit in total lysates obtained from cells treated with 5 or 10 µg/mL TM for 4 h. Results were normalized to untreated cells and represented as mean ± SEM of three independent experiments. Statistical differences between control and TM-treated cells were obtained with the two-way ANOVA test, followed by Sidak’s post hoc test: SOD1 (*p < 0.05) and SOD2 (#p < 0.05) activities
Fig.7
Fig.7
Mitochondrial calcium uptake and mitochondrial membrane potential under ER stress conditions in human THP-1 monocytes. Ca2+ influx into mitochondria was measured in THP-1 cells treated with 5 or 10 µg/mL TM for 4 or 8 h with the fluorescent probe Rhod-2/AM, before and after thapsigargin-induced ER Ca2+ depletion. Results were expressed by the difference between the highest post-thapsigargin value and the mean of baseline levels (A). Alterations in mitochondrial membrane potential (B) were measured using the TMRE fluorescent probe in THP-1 monocytes treated with 5 or 10 µg/mL TM for 4 or 8 h. Results were calculated relatively to control values and represent the mean ± SEM of three independent experiments. Statistical differences between control and TM-treated cells were obtained with the one-way ANOVA test, followed by the Dunnett’s post hoc test: *p < 0.05; **p < 0.01
Fig. 8
Fig. 8
NLRP3 inflammasome activation in human monocytes exposed to ER stress. Protein levels of NLRP3 (A), pro-IL-1β (B) and ASC (C) were quantified by WB in total extracts from THP-1 monocytes incubated in the presence or absence of 10 μg/mL TM for 8 h, upon priming with LPS (1 μg/mL) during 24 h. β-Tubulin I was used as a loading control to normalize the levels of the protein of interest. Results were calculated relatively to control values, with exception of pro-IL-1β, and represent the mean ± SEM of at least three independent experiments. Statistical significance between control and TM-treated cells was determined using the one-way ANOVA test, followed by Dunnett’s post hoc test: ****p < 0.0001. Levels of secreted IL-1β were quantified by an ELISA assay in supernatants of THP-1 cells treated with 1 μg/mL LPS alone (24 h), or with LPS (24 h) and then with 10 μg/mL TM for the last 8 h. Cells primed with 1 μg/mL LPS for 24 h and then exposed to 5 μM ATP for 30 min were used as a positive control for NLRP3 activation. Results were calculated relatively to LPS-treated cells and represent the mean ± SEM of at least three independent experiments. Statistical significance between LPS and control conditions (Ctrl), in the absence of treatments, was determined by student’s t-test (####p < 0.0001), and between LPS, LPS plus ATP and LPS plus TM was determined using the one-way ANOVA test, followed by Dunnett’s post hoc test: *p < 0.05
Fig. 9
Fig. 9
Role of Ca2+ on ER stress-induced NLRP3 activation in THP-1 monocytes and susceptibility towards ER stress. By using an ELISA assay, IL-1β secretion was analyzed in supernatants obtained from THP-1 cells primed with 1 μg/mL LPS during 24 h and then treated with 10 μg/mL TM for 8 h in the presence or absence of 10 μM Ru360 (A), or 1 μM Xest C (B), or 5 mM NAC (C) which were pre-incubated during 1 h. Results were calculated relatively to LPS-treated cells and represent the mean ± SEM of at least three independent experiments. Statistical analysis: t-test was used for comparisons between Ctrl and LPS (###p < 0.001), LPS plus TM and LPS (**p < 0.01 or ***p < 0.001), LPS plus TM plus Xest C and LPS plus TM (tp < 0.05), and LPS plus TM plus Ru360 and LPS plus TM (tp < 0.05). Susceptibility of THP-1 cells to ER stress induced by TM (5 or 10 μg/mL) exposure during 4, 8 or 24 h was assessed by the resazurin assay (D). Results represent the mean ± SEM of at least three independent experiments and were calculated relatively to control values (untreated cells). Statistical significance between control and treated cells was determined using the one-way ANOVA test, followed by Dunnett’s post hoc test: **p < 0.01; ***p < 0.001
Fig. 10
Fig. 10
NLRP3 inflammasome activation in microglia cells exposed to ER stress. Protein levels of GRP78 (A) were quantified by WB in total extracts obtained after treatment of BV2 cells with 2 or 10 μg/mL brefeldin A (BFA) for 6 h. NLRP3 (B) and pro-IL-1β (C) content was also quantified by WB in total extracts of BFA-treated BV2 cells upon LPS priming (3 h). Actin was used as a protein loading control to normalize the levels of the protein of interest. Results were calculated relatively to control values and represent the mean ± SEM of at least three independent experiments. Statistical significance between control and BFA-treated cells and between control and LPS plus BFA cells was determined using the one-way ANOVA test, followed by the Dunnett’s post hoc test: *p < 0.05, **p < 0.01, ***p < 0.001. Secreted IL-1β levels (D) were measured using an ELISA assay in the supernatants collected from BV2 microglia cells treated with 300 ng/mL LPS alone (3 h), or primed with LPS and then incubated with BFA 2 or 10 μg/mL) for 6 h. Results represent the mean ± SEM of at least three independent experiments. Statistical significance between LPS and control conditions (Ctrl), in the absence of treatments, was determined by student’s t-test (##p < 0.01), and between LPS and LPS plus BFA cells was determined using the one-way ANOVA test, followed by the Dunnett’s post hoc test: *p < 0.05
Fig. 11
Fig. 11
NLRP3 inflammasome activation in BD-patient derived monocytes. Protein levels of NLRP3 (A) and pro-IL-1β (B) were quantified by WB in total extracts obtained from monocytes derived from healthy controls or BD patients under basal conditions. β-Tubulin I was used as a protein loading control to normalize the levels of the protein of interest. Data represent the mean ± SEM of results obtained in samples from 3–5 participants. Statistical significance between controls and BD patients was determined by Student’s t-test. NLRP3 protein levels were also evaluated by WB in TM-stressed monocytes derived from BD patients and healthy controls (C). β-Tubulin I was used as a protein loading control to normalize the levels of the protein of interest. Results were calculated relatively to respective basal levels and represent the mean ± SEM of results obtained in samples from 3–5 participants. Statistical differences between basal and TM-treated cells within each experimental group, and between the two groups were obtained using the two-way ANOVA test, followed by the Tukey’s post hoc test: (*p < 0.05) and (**p < 0.01). IL-1β levels (D) in supernatants from monocytes derived from healthy controls and BD patients treated with 10 μg/mL TM for 32 h, were quantified using an ELISA kit. Data represent the mean ± SEM of results obtained in samples from 5 participants. Statistical significance between controls and BD patients was determined by Student’s t-test: *p < 0.05
Fig. 12
Fig. 12
ER-mitochondria communication is implicated in ER stress-induced NLRP3 inflammasome activation in the innate immune system. ER stress modulates the structure of mitochondria-associated membranes (MAMs) in human monocytes as demonstrated by the upregulation of chaperones that reside or that are translocated to these ER-mitochondria close contacts under severe/prolonged ER stress, and by the increment of the Mfn2 ER-mitochondria tethering protein. The proximity between both organelles occurs concomitantly with an early Ca2+ influx into mitochondria and depolarization of mitochondrial membrane, culminating in activation of the NLRP3 inflammasome and release of pro-inflammatory IL-1β that is also affected by the release of Ca2+ from the ER. Enhanced mitochondrial fusion to stimulate energy production can lead to the accumulation of dysfunctional mitochondrial compromising cell viability. Activation of antioxidant defenses within mitochondria to avoid ROS accumulation might represent a protective strategy that is not able to counteract chronic ER stress-induced sterile inflammation

Similar articles

Cited by

References

    1. Filadi R, Theurey P, Pizzo P. The endoplasmic reticulum-mitochondria coupling in health and disease: molecules, functions and significance. Cell Calcium. 2017;62:1–15. doi: 10.1016/j.ceca.2017.01.003. - DOI - PubMed
    1. Pfaffenseller B, Wollenhaupt-Aguiar B, Fries GR, et al. Impaired endoplasmic reticulum stress response in bipolar disorder: cellular evidence of illness progression. Int J Neuropsychopharmacol. 2014;17:1453–1463. doi: 10.1017/S1461145714000443. - DOI - PubMed
    1. Ron D, Walter P. Signal integration in the endoplasmic reticulum unfolded protein response. Nat Rev Mol Cell Biol. 2007;8:519–529. doi: 10.1038/nrm2199. - DOI - PubMed
    1. Decuypere J-P, Monaco G, Bultynck G, et al. The IP3 receptor–mitochondria connection in apoptosis and autophagy. Biochim Biophys Acta Mol Cell Res. 2011;1813:1003–1013. doi: 10.1016/J.BBAMCR.2010.11.023. - DOI - PubMed
    1. Deegan S, Saveljeva S, Gorman AM, Samali A. Stress-induced self-cannibalism: on the regulation of autophagy by endoplasmic reticulum stress. Cell Mol Life Sci. 2013;70:2425–2441. doi: 10.1007/s00018-012-1173-4. - DOI - PMC - PubMed

Substances

LinkOut - more resources