. 2022 May;36(5):e22282.
doi: 10.1096/fj.202200138R.

Cyclic GMP-AMP synthase contributes to epithelial homeostasis in intestinal inflammation via Beclin-1-mediated autophagy

Affiliations

Cyclic GMP-AMP synthase contributes to epithelial homeostasis in intestinal inflammation via Beclin-1-mediated autophagy

Sidrah Khan et al. FASEB J. 2022 May.

Abstract

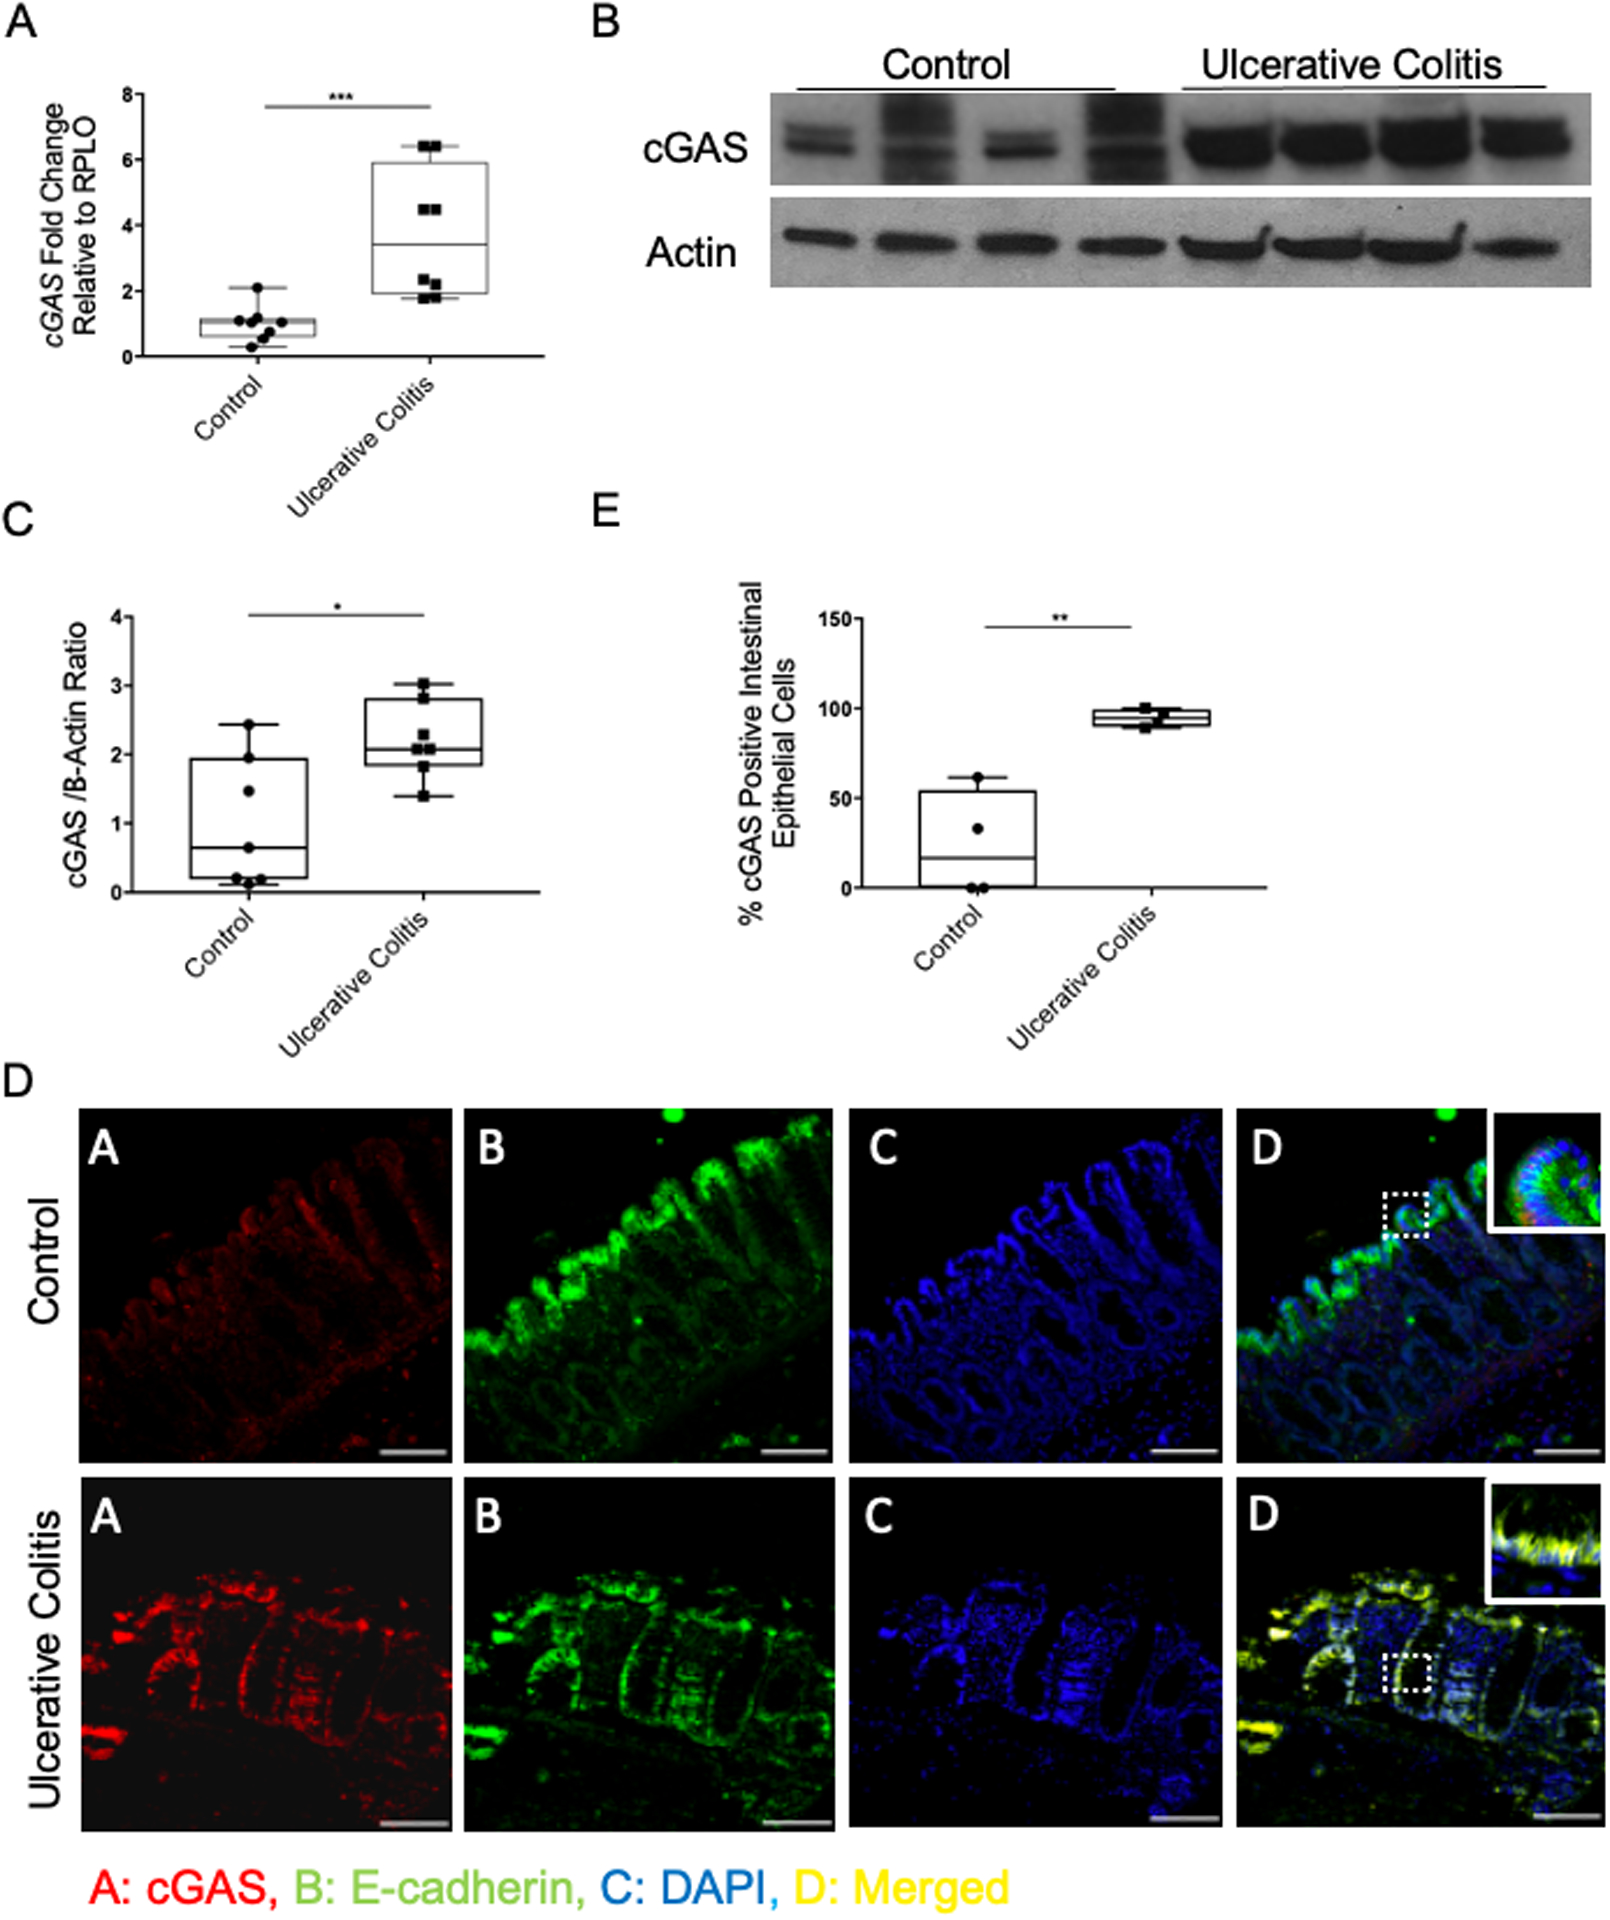
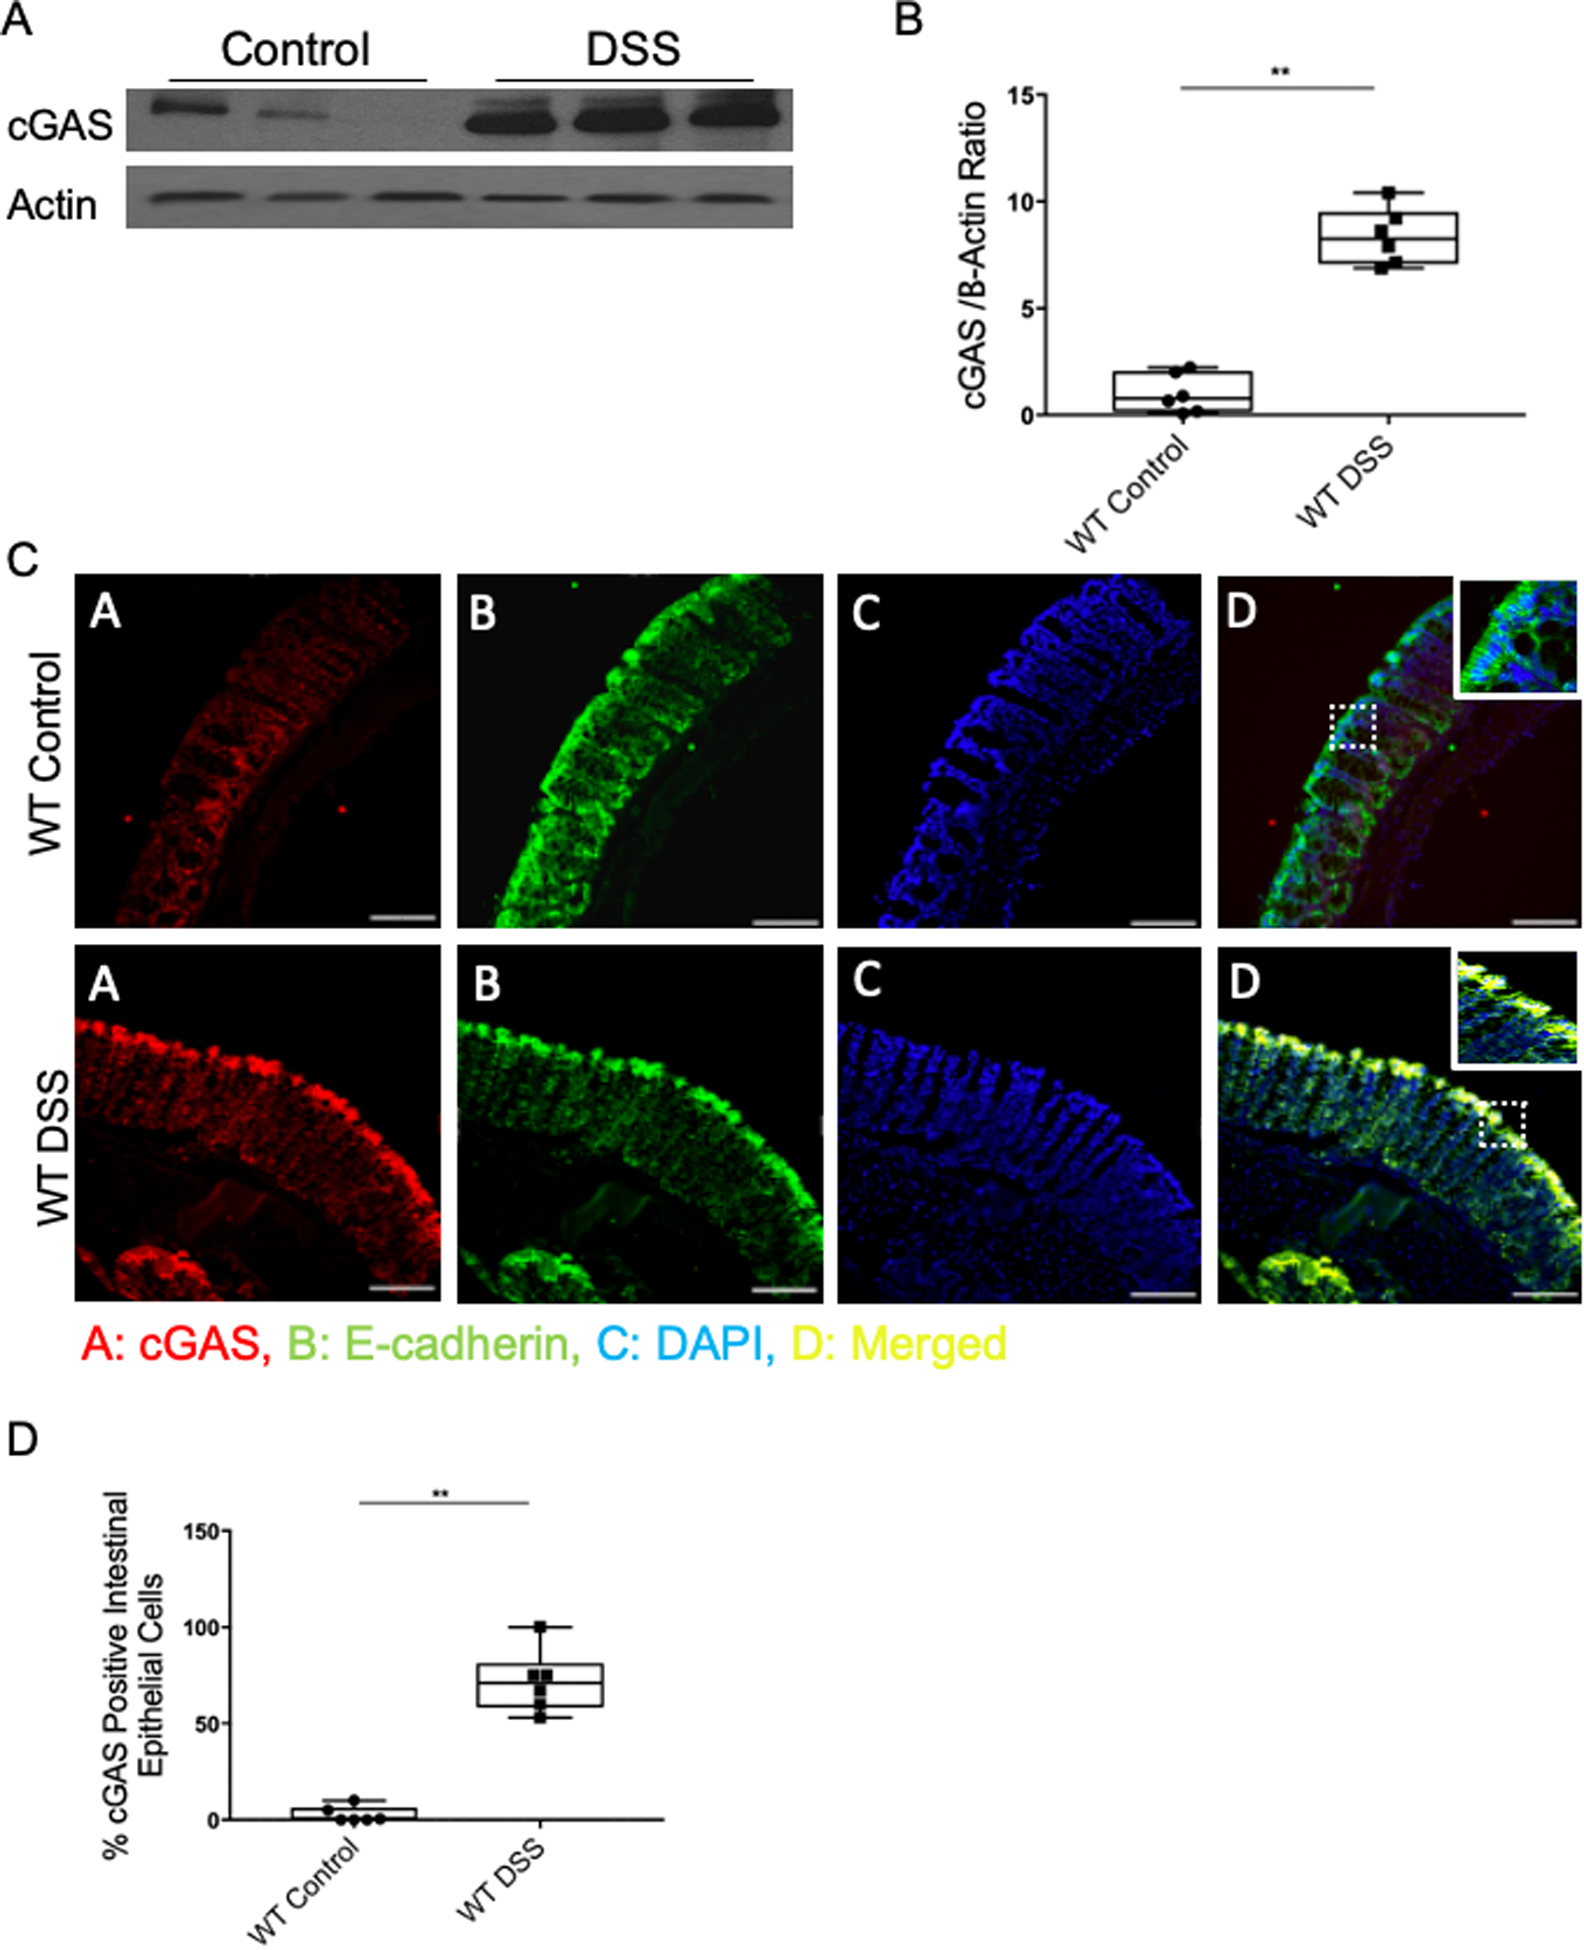
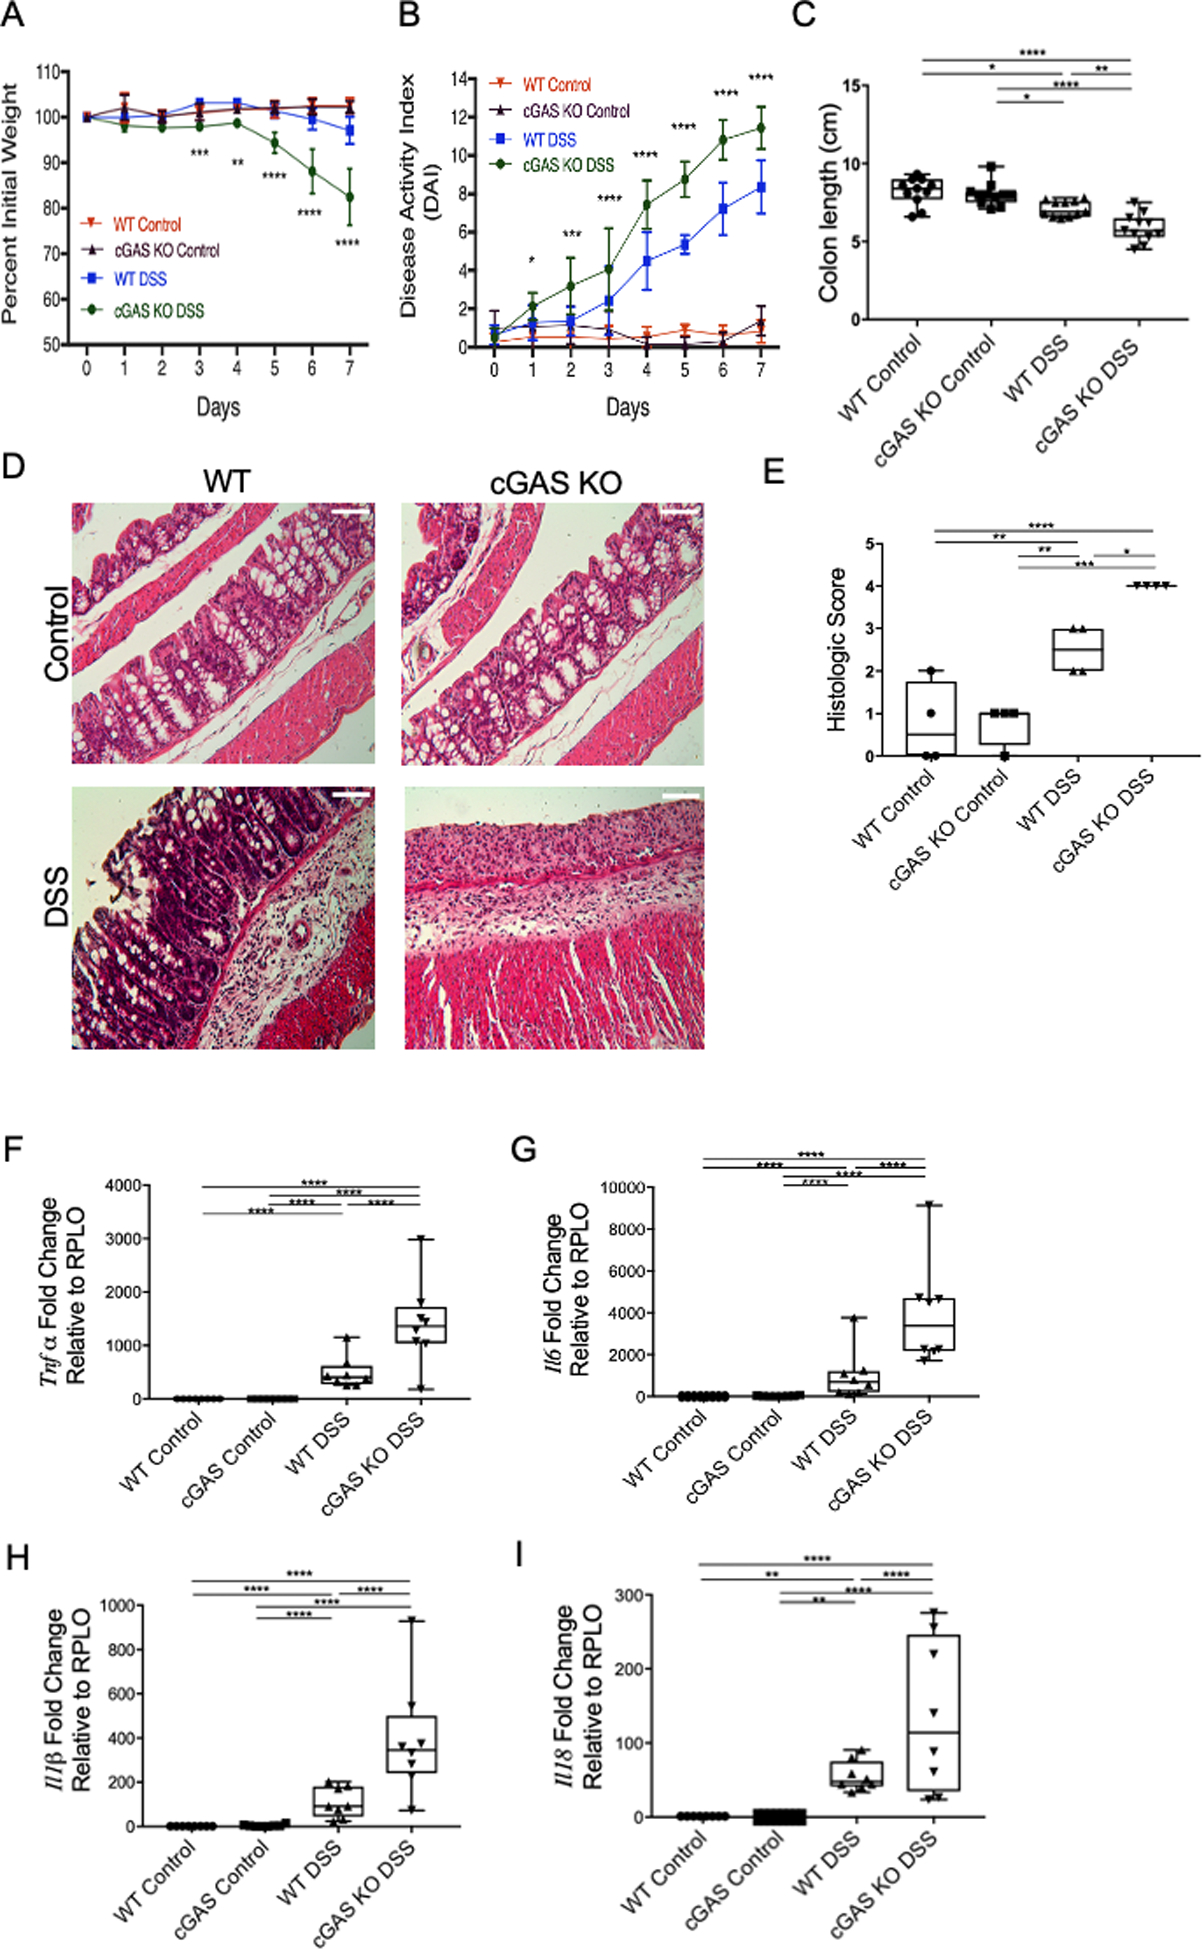
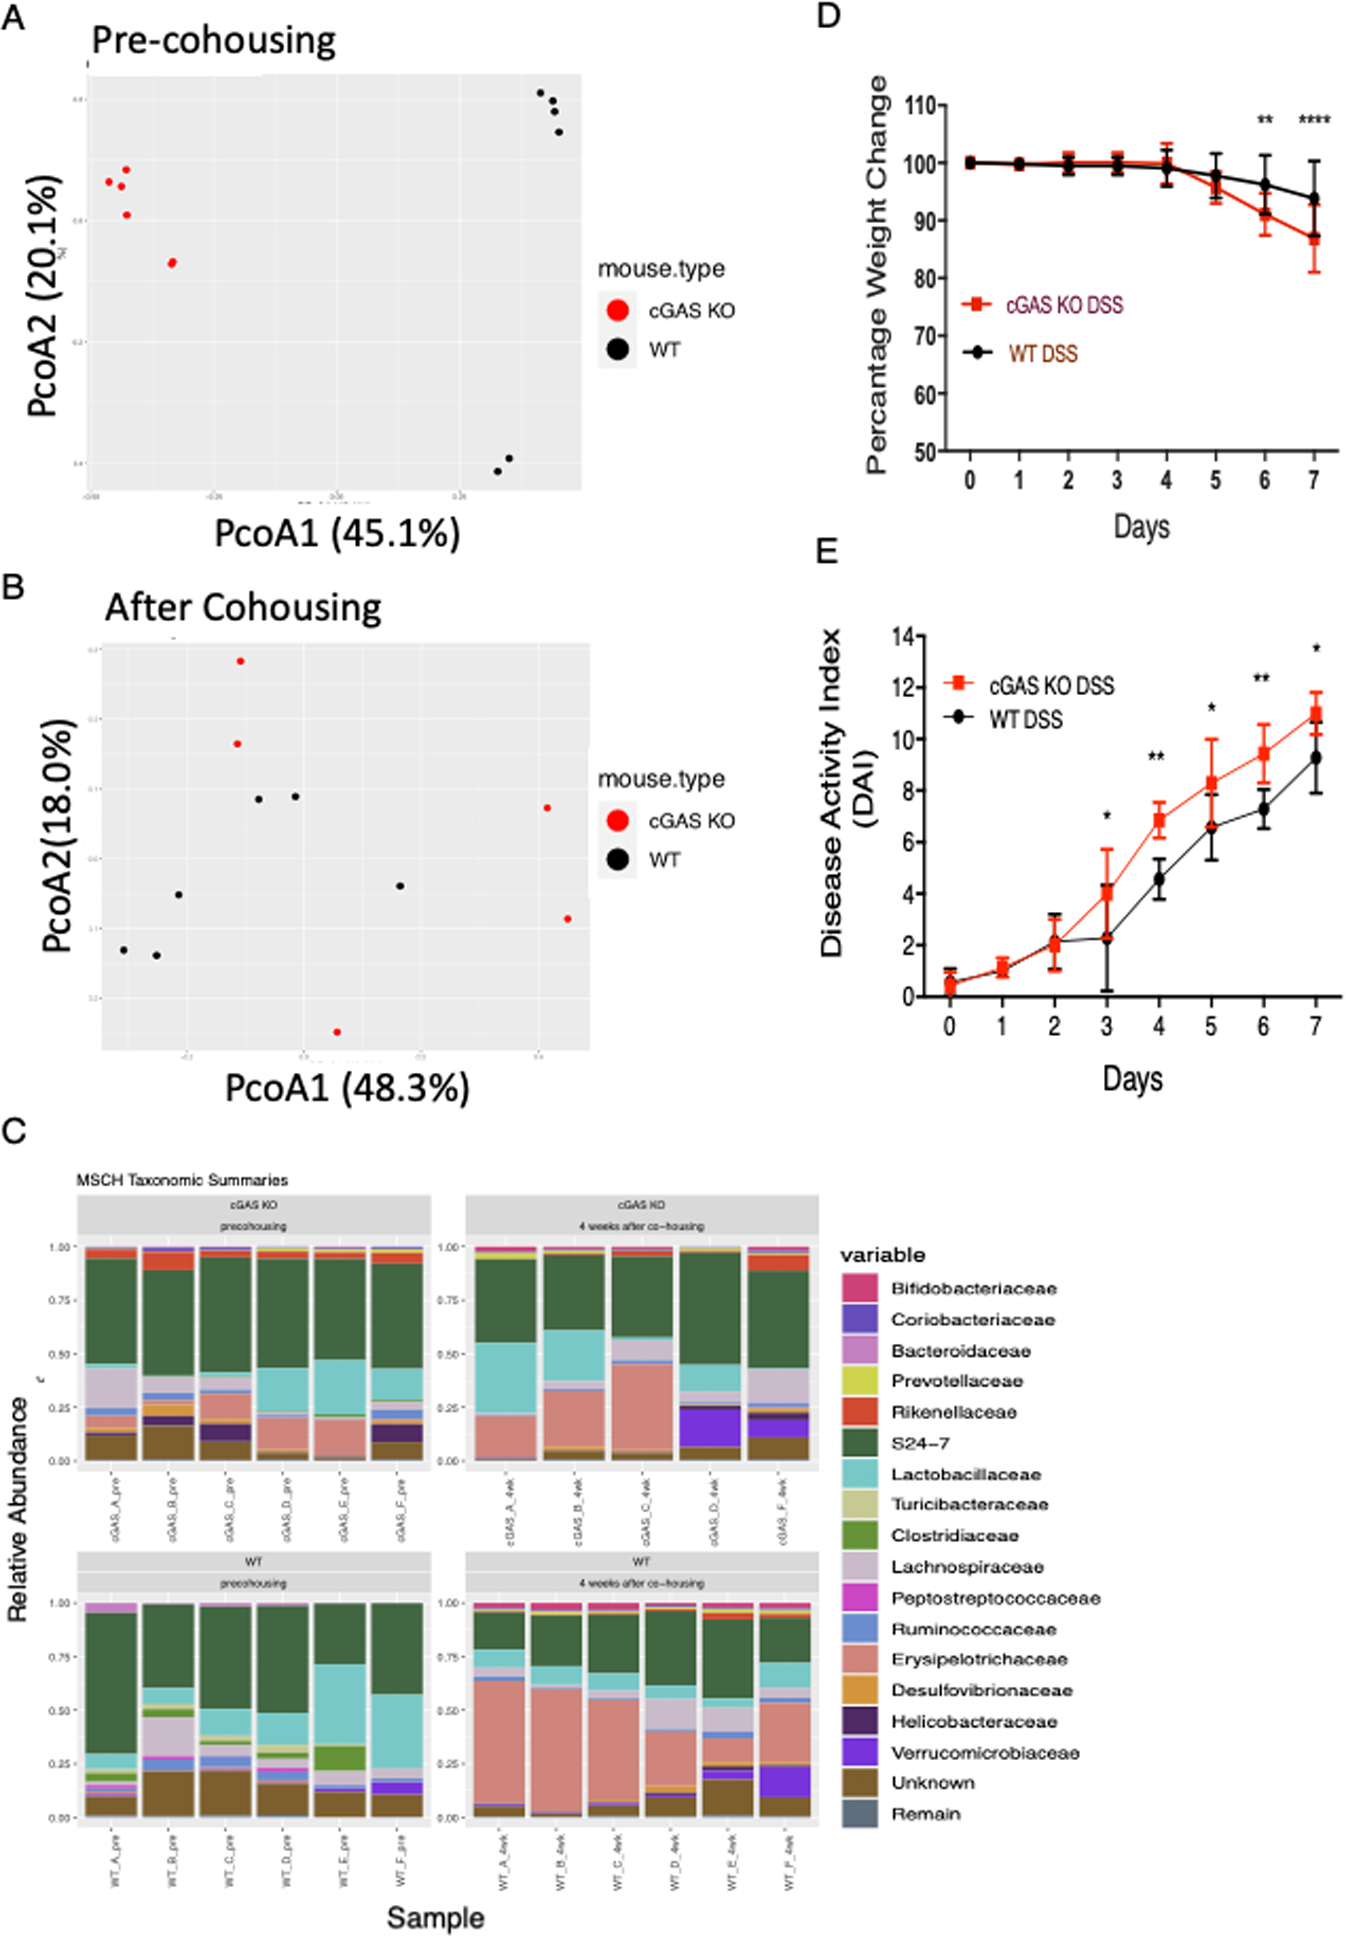
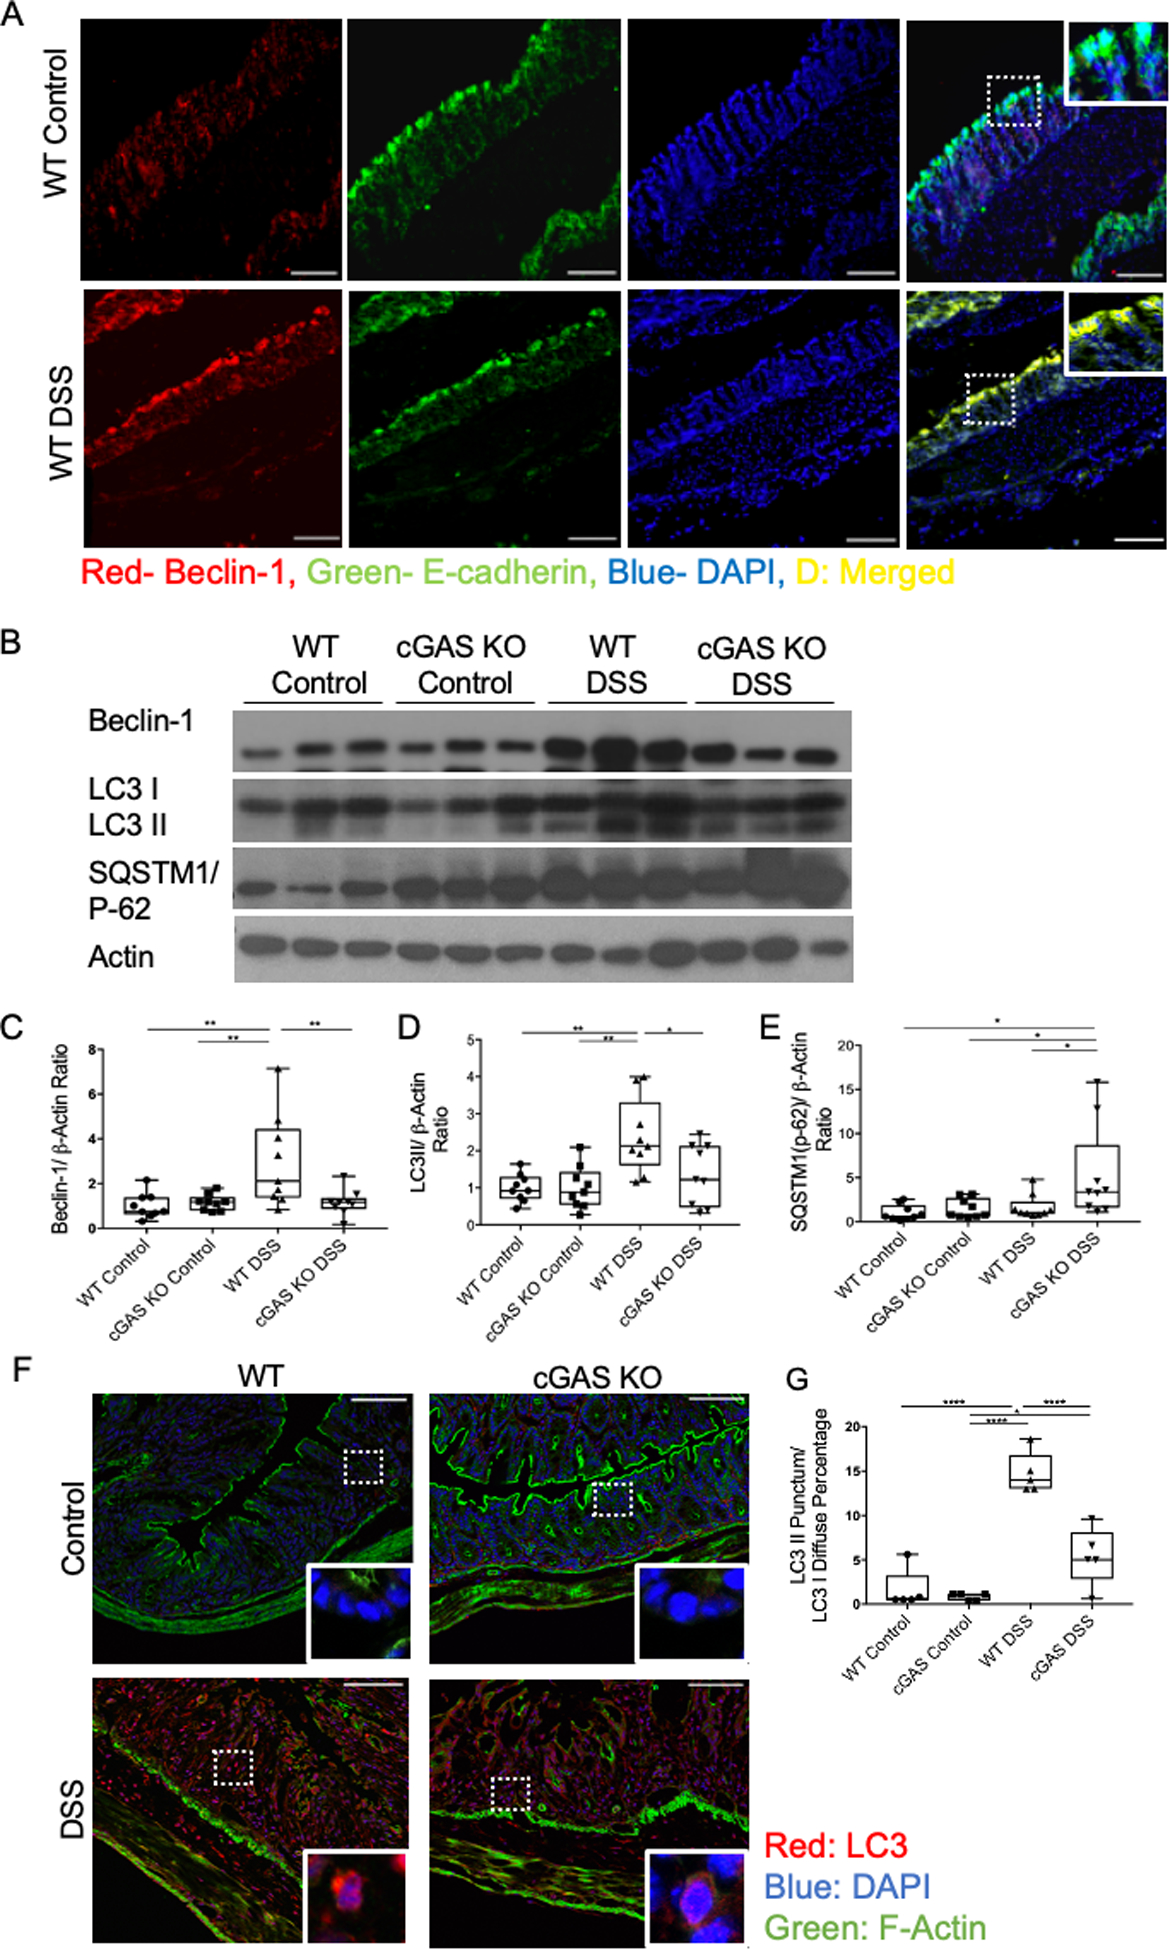
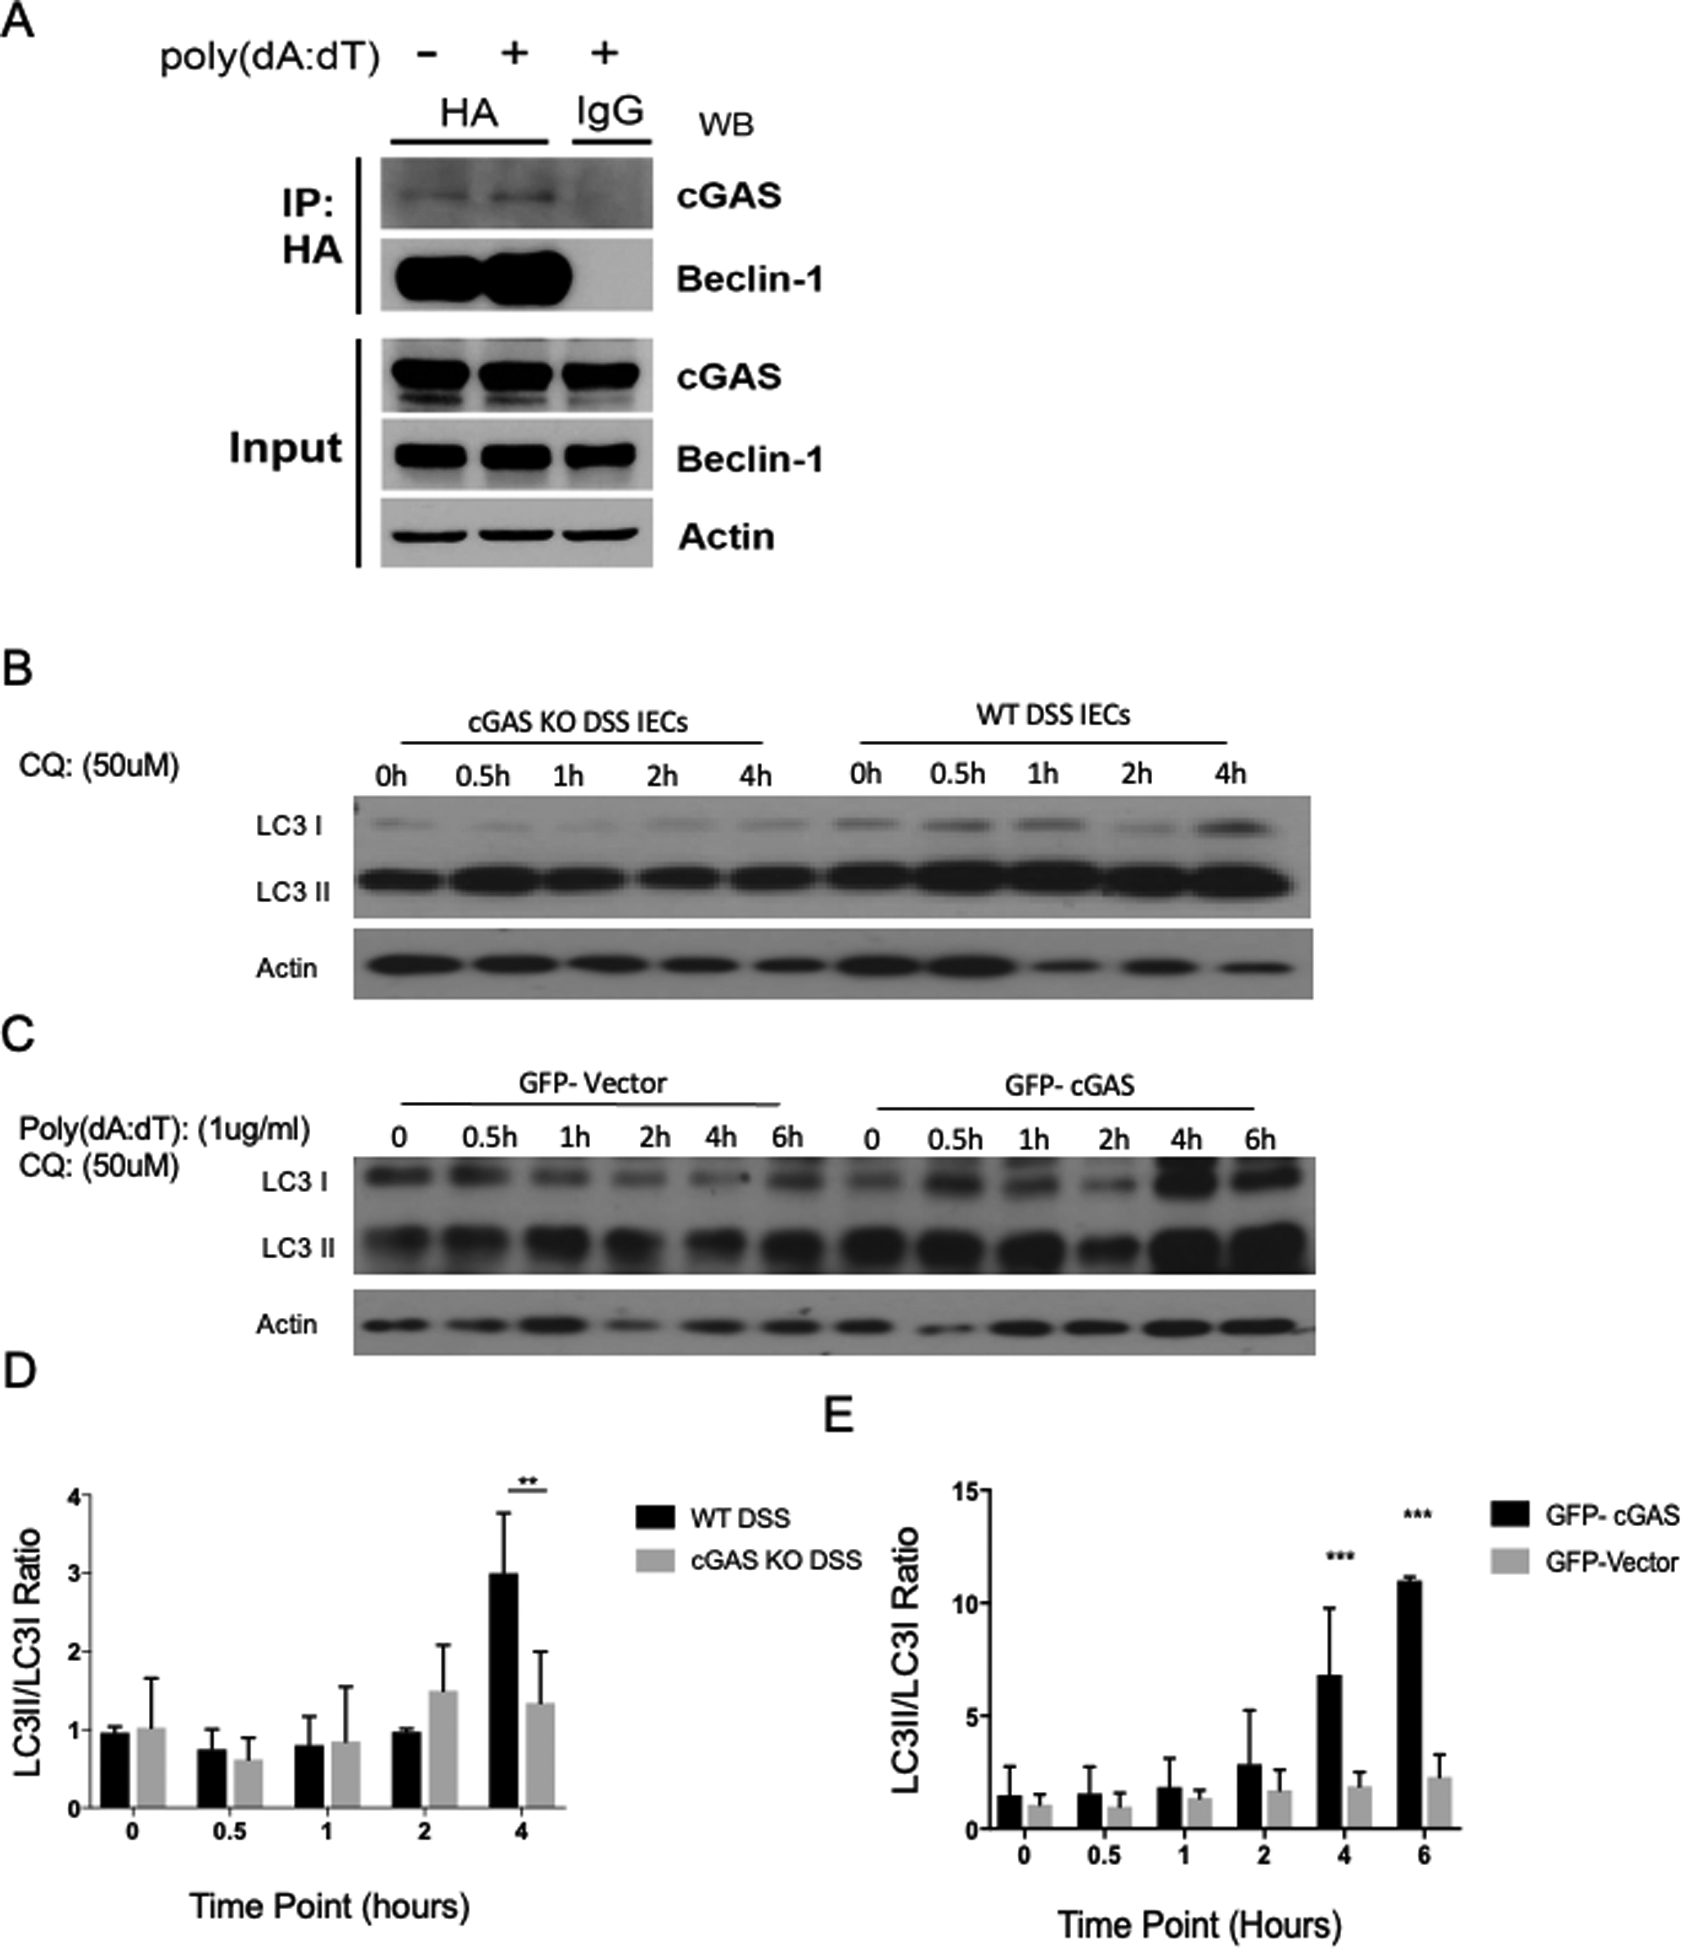
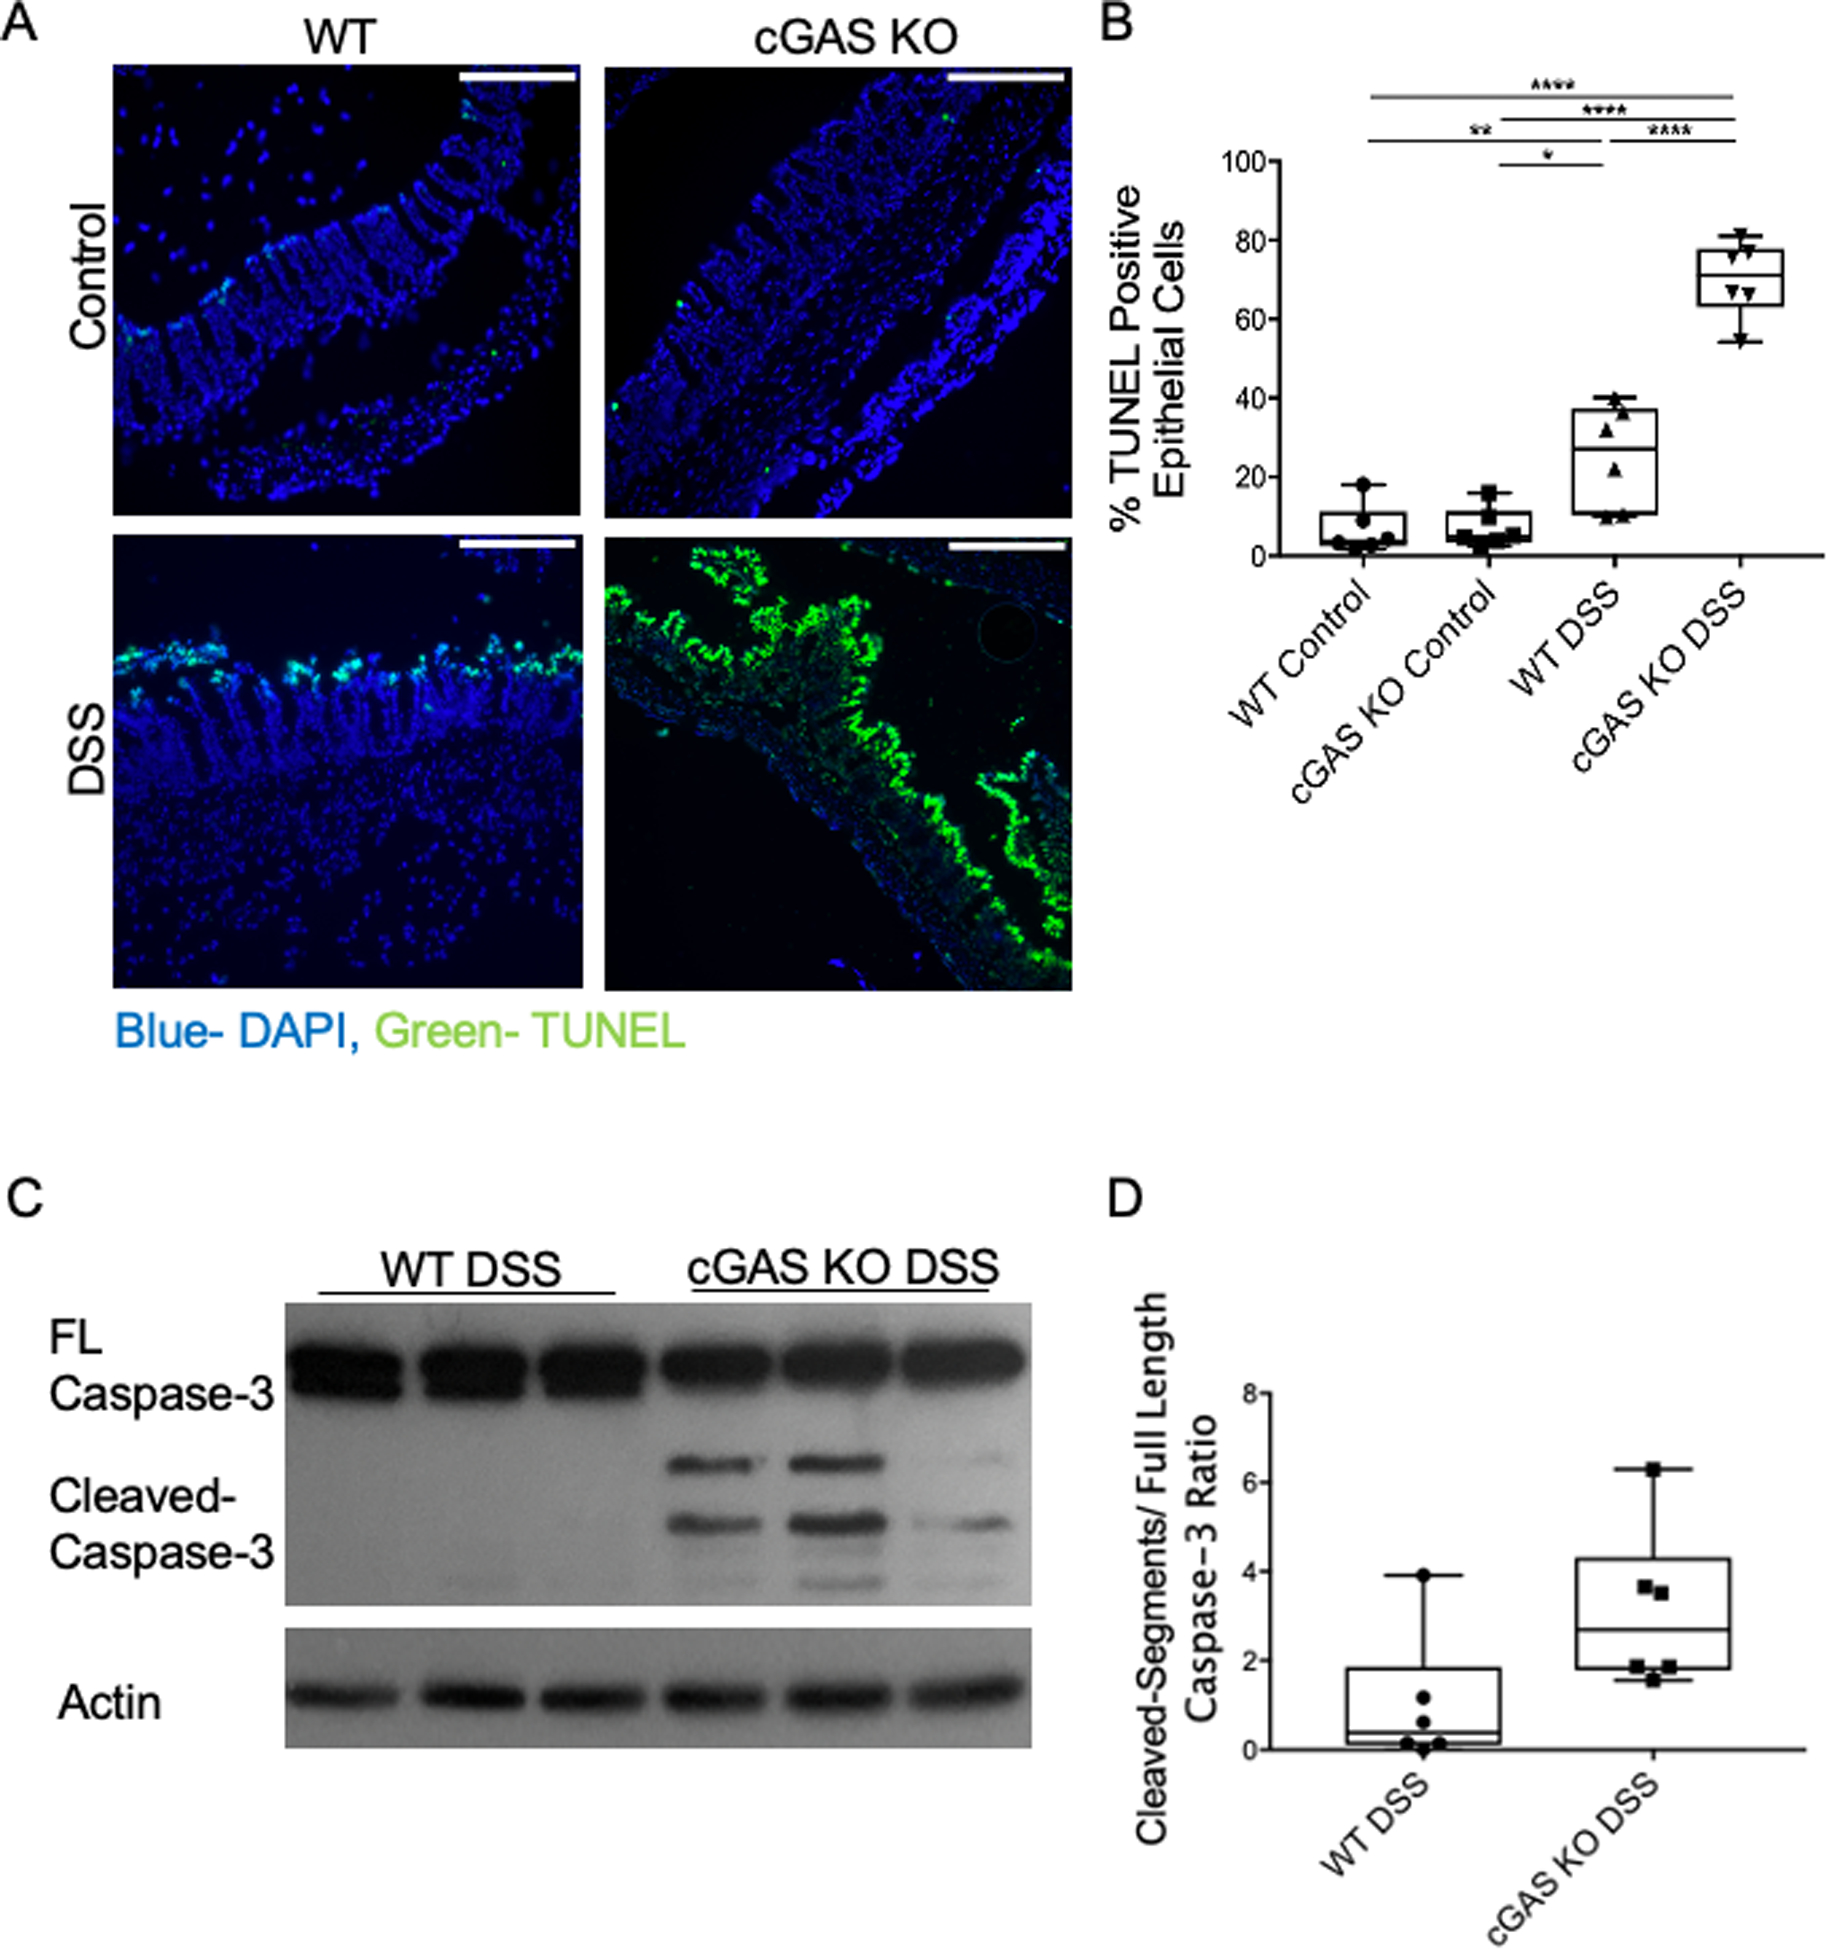
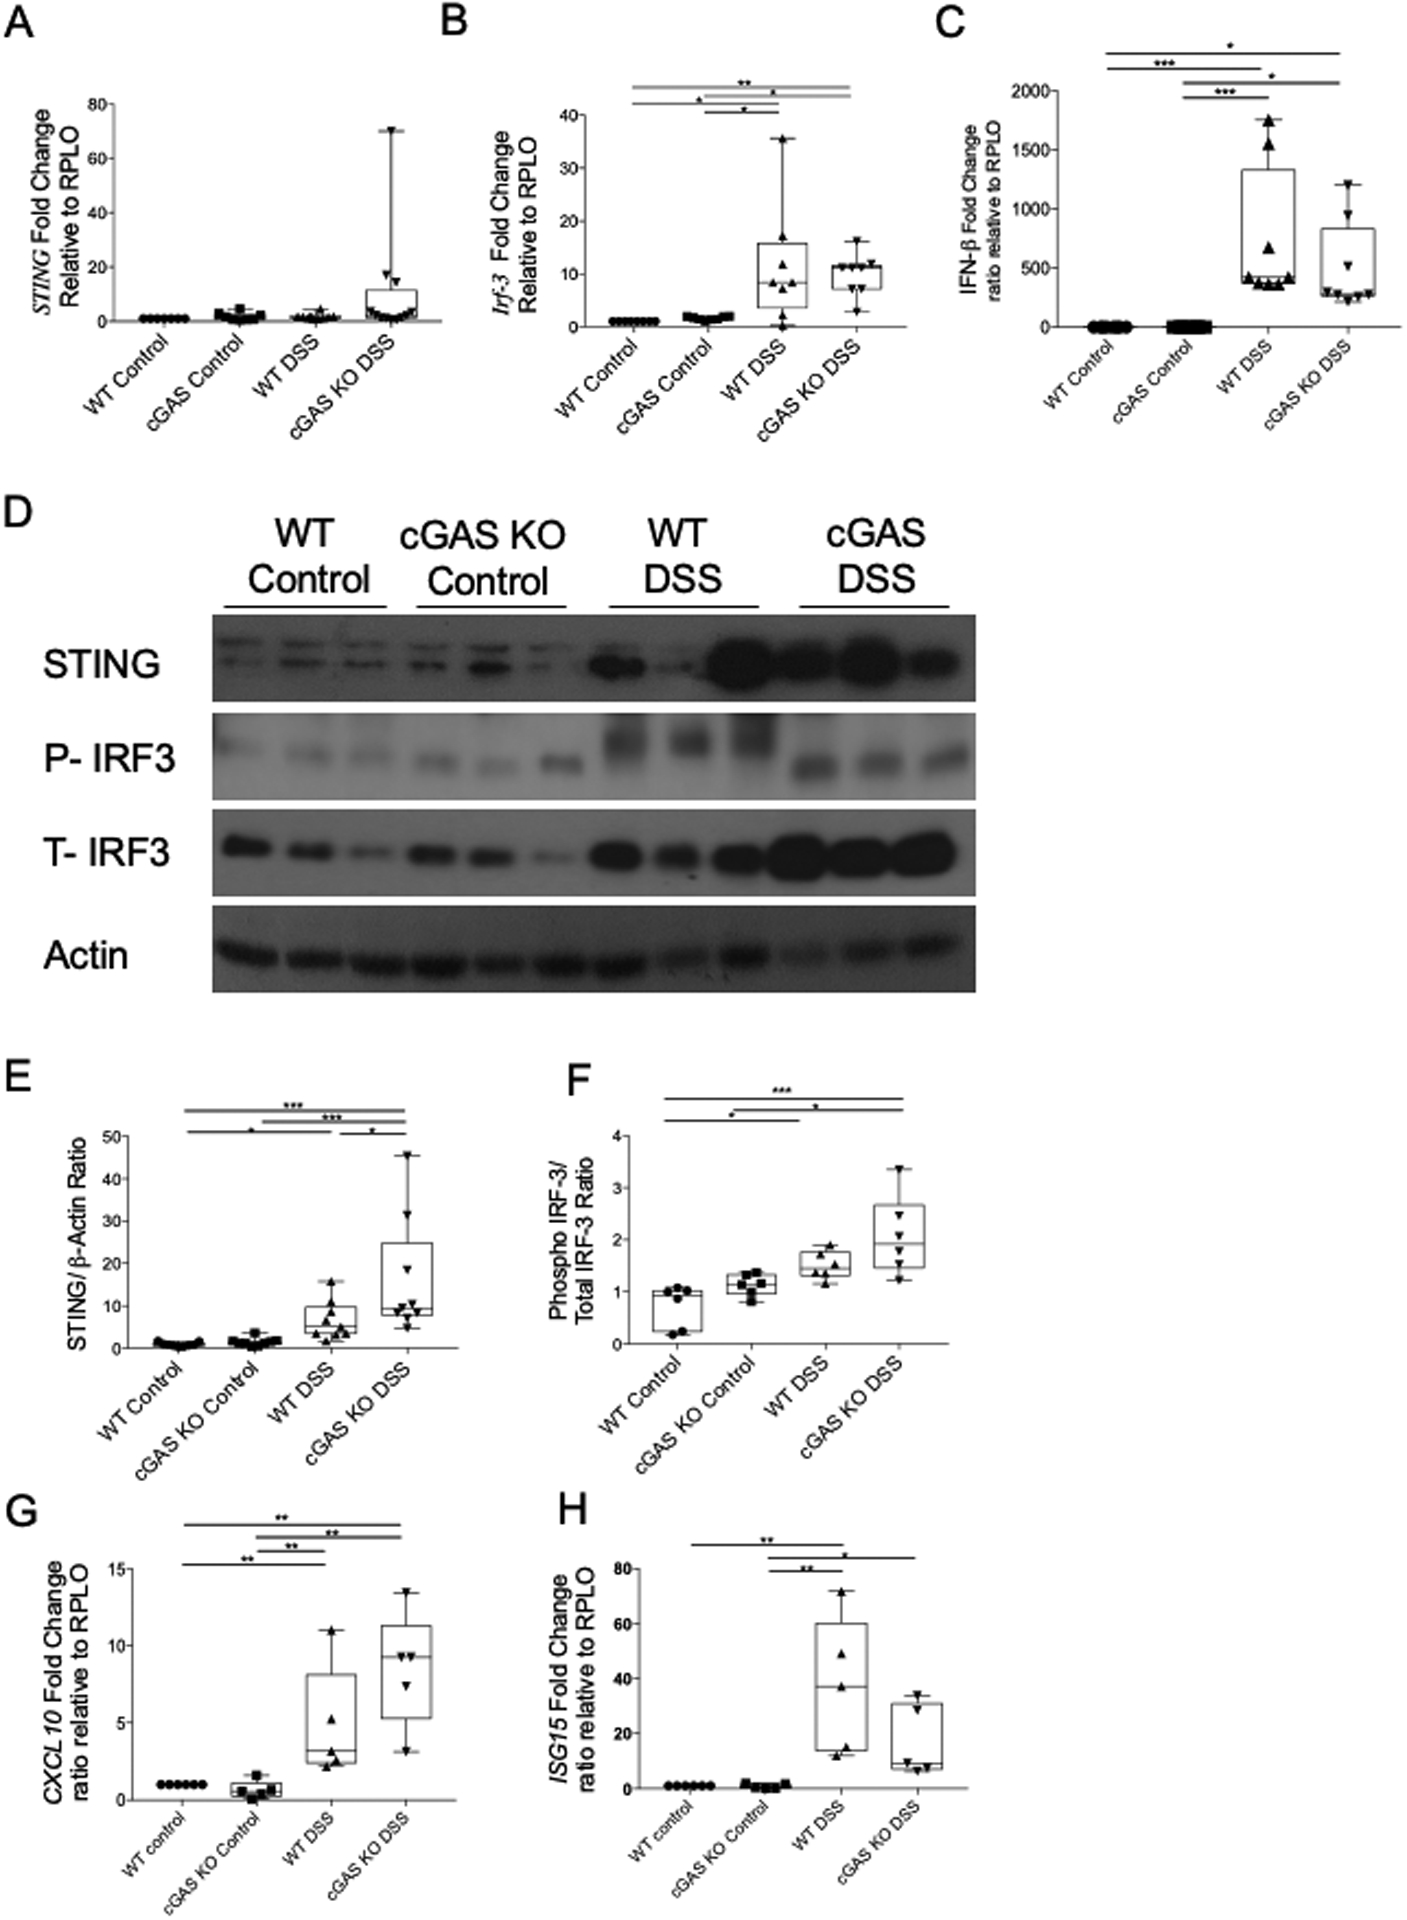
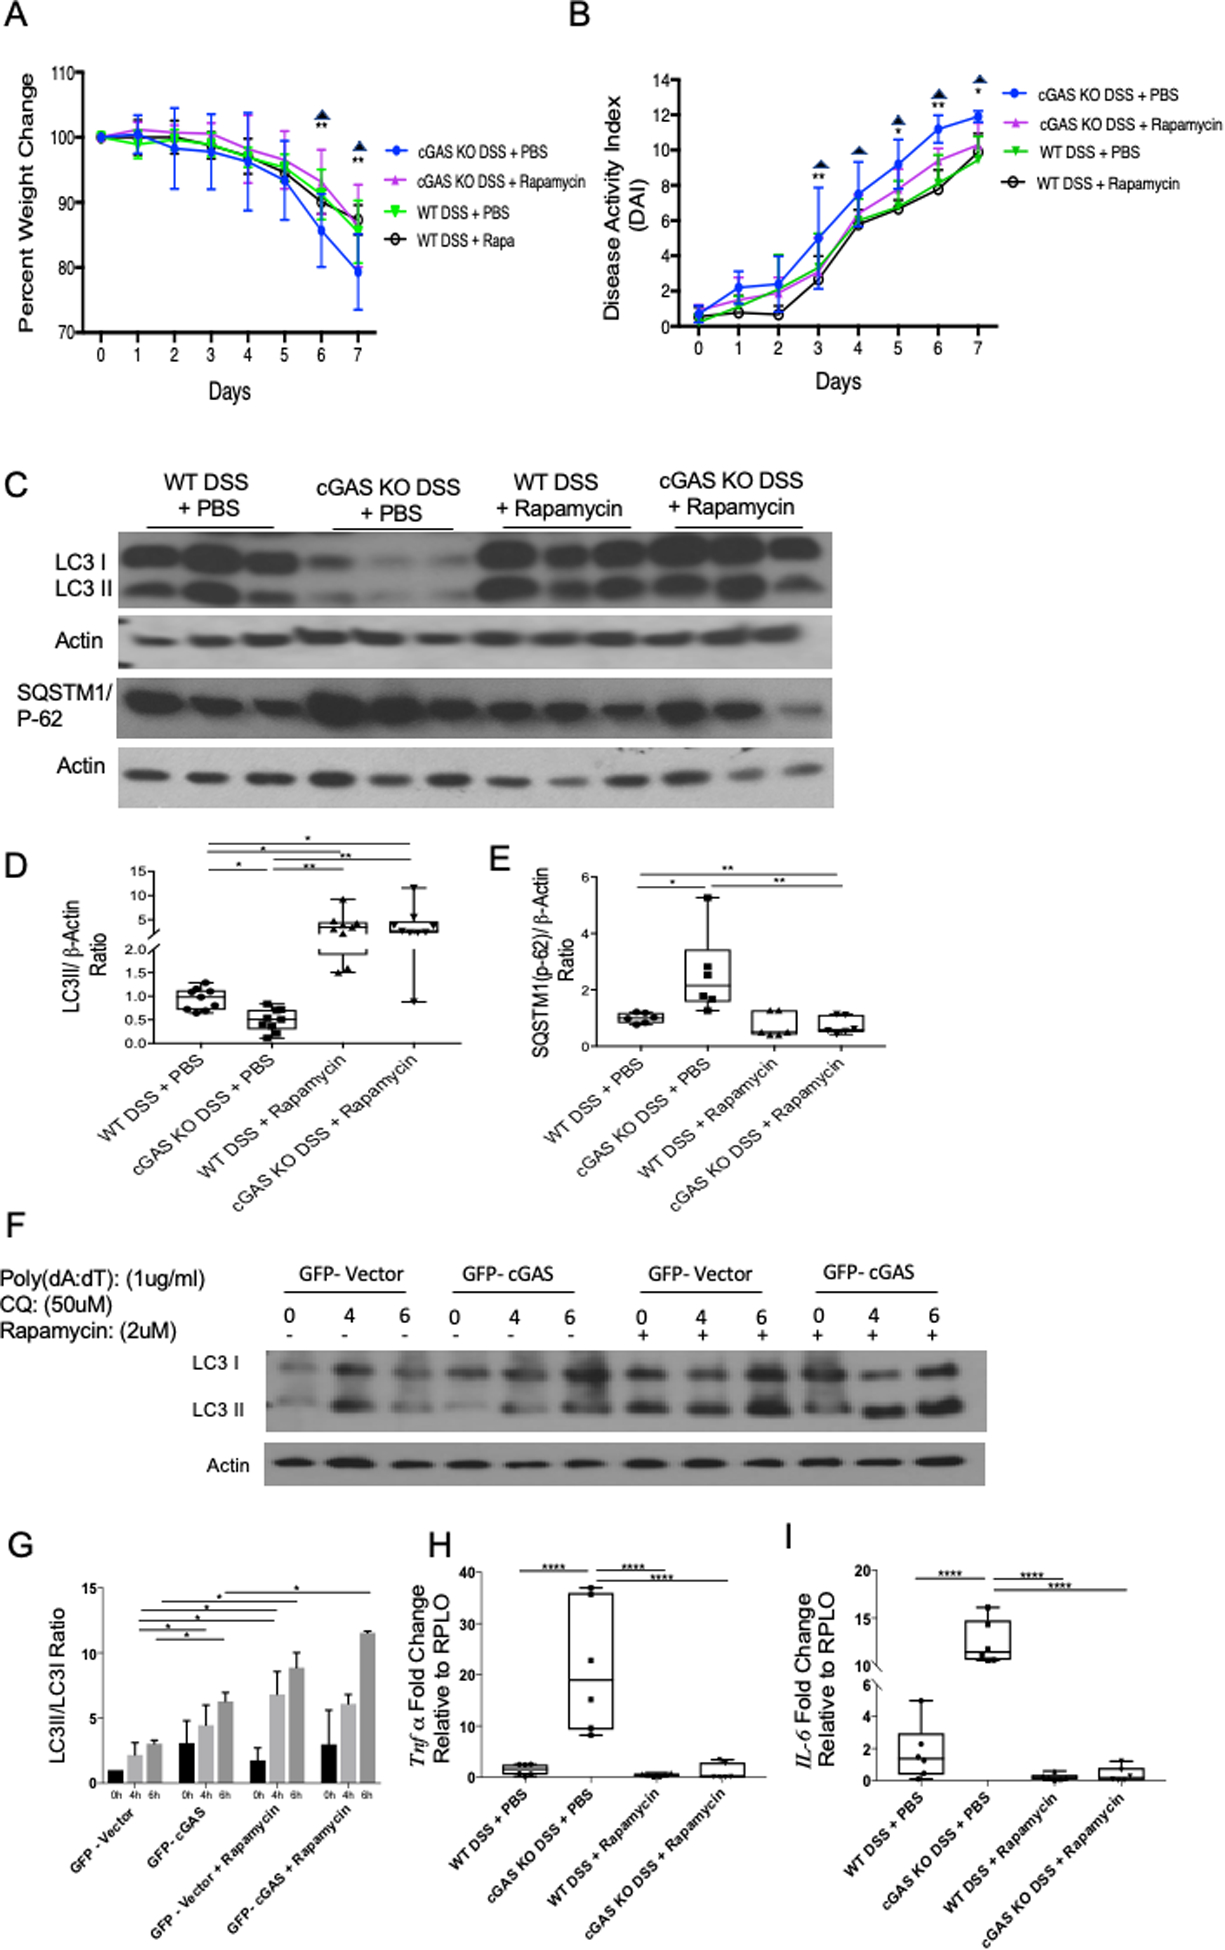
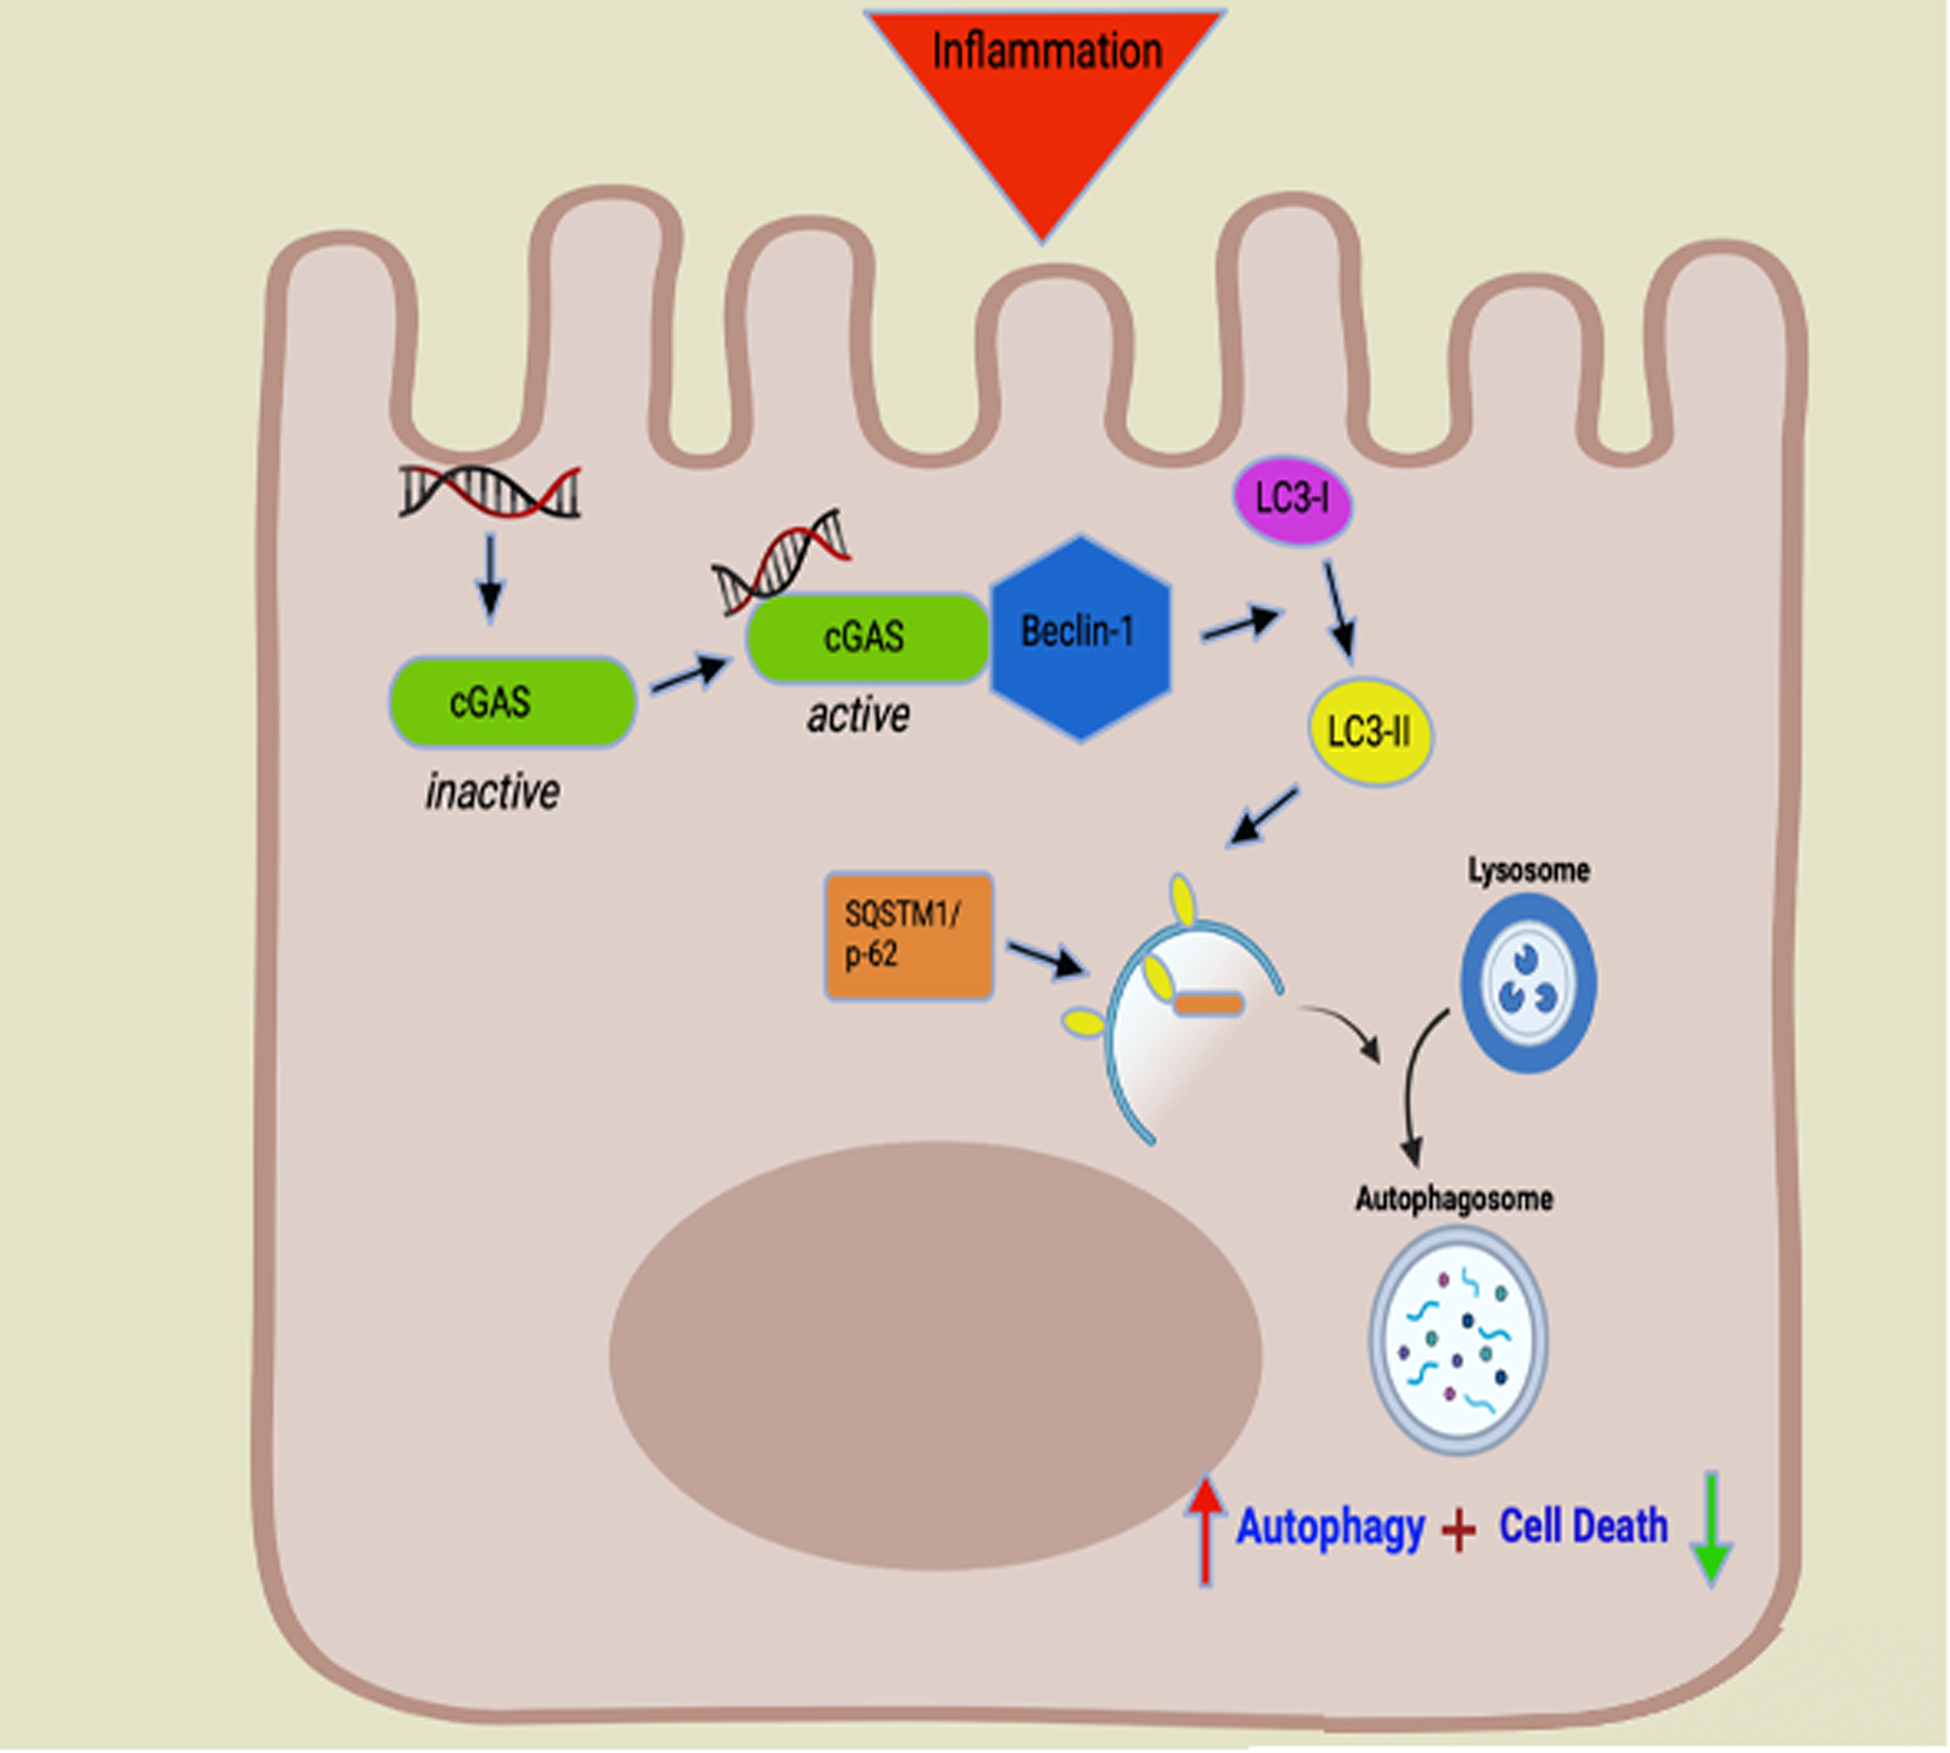
Inflammatory bowel disease (IBD) represents a set of idiopathic and chronic inflammatory diseases of the gastrointestinal tract. Central to the pathogenesis of IBD is a dysregulation of normal intestinal epithelial homeostasis. cGAS is a DNA-sensing receptor demonstrated to promote autophagy, a mechanism that removes dysfunctional cellular components. Beclin-1 is a crucial protein involved in the initiation of autophagy. We hypothesized that cGAS plays a key role in intestinal homeostasis by upregulating Beclin-1-mediated autophagy. We evaluated intestinal cGAS levels in humans with IBD and in murine colonic tissue after performing a 2% dextran sulfate sodium (DSS) colitis model. Autophagy and cell death mechanisms were studied in cGAS KO and WT mice via qPCR, WB analysis, H&E, IF, and TUNEL staining. Autophagy was measured in stimulated intestinal epithelial cells (IECs) via WB analysis. Our data demonstrates cGAS to be upregulated during human and murine colitis. Furthermore, cGAS deficiency leads to worsened colitis and decreased levels of autophagy proteins including Beclin-1 and LC3-II. Co-IP demonstrates a direct binding between cGAS and Beclin-1 in IECs. Transfection of cGAS in stimulated HCT-116 cells leads to increased autophagy. IECs isolated from cGAS KO have diminished autophagic flux. cGAS KO mice subjected to DSS have increased cell death and cleaved caspase-3. Lastly, treatment of cGAS KO mice with rapamycin decreased the severity of colitis. Our data suggest that cGAS maintains intestinal epithelial homeostasis during human IBD and murine colitis by upregulating Beclin-1-mediated autophagy and preventing IEC death. Rescue of autophagy can attenuate the severity of colitis associated with cGAS deficiency.

Keywords: DSS; cGAS; colitis; intestinal epithelium.


Conflict of interest statement

Conflicts of Interest Statement: The authors have no conflict of interest to declare.

Figures

Figure 1.
Figure 1.. cGAS is Upregulated in the Intestinal Epithelium of Humans with Inflammatory Bowel Disease (IBD).
(A) RT-qPCR analysis of the relative mRNA expression of cGAS in the colonic tissue of humans with ulcerative colitis (UC) and control human tissue (n=8/group). (B) Western blot (WB) analysis of cGAS expression in human with UC and control human colonic tissue (n=7/group). (C) WB quantification of cGAS. (D) Immunofluorescence (IF) labeling of cGAS (red), e-cadherin (green), DAPI (blue), merged (yellow) in colon sections from humans with UC and control tissue; Scale bar represents 100 mm (n=4). (E) Quantification was performed by calculating percentage of cGAS positive intestinal epithelial cells compared to all intestinal epithelial cells. The data are representative of at least three independent experiments. Data represent the mean ± SD. * P < 0.05, ** P < 0.01, *** P < 0.001 by Student t test and Mann–Whitney.
Figure 2.
Figure 2.. cGAS is Upregulated in the Intestinal Epithelium of Mice Subjected to 2% Dextran Sodium Sulfate (DSS) Colitis.
C57Bl/6J wild-type (WT) mice were subjected to a 2% DSS-induced colitis model for 7 days. (A) WB analysis of cGAS expression in WT control and DSS-treated mice (n=6). (B) WB quantification of cGAS. (C) IF labeling of cGAS (red), e-cadherin (green), DAPI (blue), and merged (yellow) in the intestinal epithelium of WT control and DSS-treated mice; Scale bar represents 300 mm (n=6). (D) Quantification was performed by calculating percentage of cGAS positive intestinal epithelial cells compared to all intestinal epithelial cells. The data are representative of at least three independent experiments. Data represent the mean ± SD.** P < 0.01 by Student t test and Mann–Whitney.
Figure 3.
Figure 3.. cGAS Deficiency Increased the Severity of Colitis.
(A–B) Age- and gender-matched WT and cGAS KO mice were subjected to a 2% DSS-induced colitis model for 7 days and compared to their respective controls (n=11/group). Weight changes and DAI scores were measured daily. Asterix represent differences between cGAS KO DSS and WT DSS mice. Data represent the mean ± SD. * P < 0.05, ** P < 0.01, *** P < 0.001, and **** P < 0.0001 by two-way ANOVA followed by Tukey’s multiple-comparison test. (C) Colon lengths were measured after mice were euthanized on day 7 after DSS treatment (n=11/group). (D–E) Representative H&E staining of colon sections and blinded histology scores of WT control, cGAS KO control, WT mice subjected to DSS, and cGAS KO mice subjected to DSS. Scale bars represents 200 μm (n=4). (F–I) RT-qPCR analysis of relative mRNA expression of Tnfα (n=8), Il6 (n=8), Il1β (n=8), and Il18 (n=8) from WT control, cGAS KO control, WT DSS, and cGAS KO DSS mice. The data are representative of at least three independent experiments. Data represent the mean ± SD. * P < 0.05, ** P < 0.01, *** P < 0.001, and **** P < 0.0001 by one-way ANOVA followed by Tukey’s multiple-comparison test.
Figure 4.
Figure 4.. cGAS Deficiency Leads to Increased Severity of Colitis Despite Cohousing with WT Mice.
Age- and gender-matched male WT and cGAS KO mice were cohoused for 4 weeks. Fecal stool was collected prior to cohousing and 4 weeks after cohousing. Beta diversity of co-housed WT and cGAS KO mice represented by Principal Coordinates Analysis (PCoA) at (A) pre-cohousing and (B) 4 weeks after cohousing. Differences in genotypes were significant in samples from pre-housed mice (ADONIS2 test, p-value=0.003, R2=0.638), but not in samples from mice 4 weeks after cohousing (p-value > 0.05). (C) Relative abundance of major bacterial families relative to total bacteria in co-housed WT and cGAS KO mice. (D–E) A 7 day, 2% DSS-induced colitis model was performed on these WT and cGAS KO mice after being co-housed for 4 weeks (n=6). Weight changes and DAI scores were measured daily. The data are representative of two independent experiments. Data represent the mean ± SD. ** P < 0.01, *** P < 0.001, and ****P < 0.0001 by two-way ANOVA followed by Tukey’s multiple-comparison test.
Figure 5.
Figure 5.. cGAS Deficiency is Associated with Decreased Beclin-1-mediated Autophagy During Intestinal Inflammation.
(A) Immunofluorescence (IF) labeling of beclin-1 (red), e-cadherin (green), DAPI (blue), and merged (yellow) in the intestinal epithelium of mice with and without DSS-induced colitis, scale bars represents 300 mm (n=4) (B) Western blot (WB) analysis of Beclin-1, LC3 I/II, and SQSTM1/p-62 in WT and cGAS KO mice subjected to DSS colitis and respective controls (n=9/group). (C–E) WB quantification for Beclin-1, LC3 II, and SQSTM1/p-62. (F) IF labeling of LC3I (diffuse red)/LC3II (red punctum), DAPI (blue),and actin (green) in WT and cGAS KO mice subjected to DSS colitis along with controls, scale bars represents 200 μm (n=5). (G) IF quantification of LC3-II punctum to LC3-I diffuse percentage. The data are representative of three independent experiments. Data represent the mean ± SD. * P < 0.05, ** P < 0.01, *** P < 0.001, and **** P < 0.0001, by an one-way ANOVA followed by Tukey’s multiple-comparison test.
Figure 6.
Figure 6.. cGAS Deficiency is Associated with Decreased Beclin-1-mediated Autophagy During Intestinal Inflammation.
(A) HCT-116 cells were transfected with HA-tagged Beclin-1 and GFP-tagged cGAS plasmids and then stimulated with poly dA:dT. 24 hours after DNA stimulation, binding between cGAS and Beclin-1 was measured via co-IP (n=3). (B) Western blot (WB) analysis of LC3-I/II from intestinal epithelial cells (IECs) isolated from cGAS KO and WT mice subjected to a 4-day model of 2% DSS colitis. IECs were treated with chloroquine (CQ) 50mM and protein lysates were collected at time points 0, 0.5, 1, 2, 4 hours. (C) Western blot (WB) analysis of LC3-I/II from GFP-vector and GFP-cGAS transfected HCT-116 cells, stimulated with poly dA:dT, and treated with chloroquine (CQ) 50mM. Protein lysates were collected at time points 0, 0.5, 1, 2, 4, and 6 hours. (D) Quantification of LC3II/LC3I ratio of WB analysis of isolated IECs. (E) Quantification of LC3II/LC3I ratio of WB analysis of HCT-116 cells. The data are representative of three independent experiments. Data represent the mean ± SD. * P < 0.05, ** P < 0.01, *** P < 0.001, and **** P < 0.0001, by an one-way ANOVA followed by Tukey’s multiple-comparison test.
Figure 7.
Figure 7.. cGAS Deficiency is Associated with Increased Cell Death.
(A) Terminal deoxynucleotidyl transferase dUTP nick end labeling (TUNEL) staining of the intestinal epithelium of WT and cGAS KO mice subjected to DSS compared to their respective controls; TUNEL (green) and DAPI (blue); scale bars represent 500 μm (n=6/group). (B) Quantification was performed by calculating percentage of TUNEL positive epithelial cells compared to all epithelial cells. (K) WB analysis of cleaved caspase-3 in WT and cGAS KO mice subjected to DSS colitis (n=6). (C) WB quantification of cleaved caspase-3. (D) WB quantification for cleaved caspase-3. The data are representative of at least two independent experiments. Data represent the mean ± SD. * P < 0.05, ** P < 0.01, *** P < 0.001, and **** P < 0.0001, by an one-way ANOVA followed by Tukey’s multiple-comparison test.
Figure 8.
Figure 8.. cGAS deficiency does not impact STING-mediated IFN signaling in the intestine of DSS-treated mice.
(A-C) RT-qPCR analysis of relative mRNA expression of Sting, IRF3, and IFN-β in colonic tissues of cGAS KO and WT mice subjected to a 7-day 2% DSS-induced colitis and their respective controls (n=8/group). (D) Western blot (WB) analysis of STING and P-IRF3/T-IRF3 in cGAS KO mice subjected to DSS induced colitis as compared to WT mice subjected to DSS induced colitis and their respective controls (n=9/group). (E, F) WB quantification for STING and P-IRF3/T-IRF3. These data are representative of at least three independent experiments. (G-H) RT-qPCR analysis of relative mRNA expression of CXCL10 and ISG15 in colonic tissues of cGAS KO and WT mice subjected to a 7-day 2% DSS-induced colitis and their respective controls (n=6/group). These data are representative of at least two independent experiments. Data represent the mean ± SD. * P < 0.05, ** P < 0.01, *** P < 0.001, and **** P < 0.0001 by an one-way ANOVA followed by Tukey’s multiple-comparison test.
Figure 9.
Figure 9.. Treatment with Rapamycin Decreased DSS-induced Colitis in cGAS KO Mice.
Age- and gender-matched WT and cGAS KO mice were subjected to a 2%, 7-day DSS colitis model. Mice were simultaneously treated with an intraperitoneal injection of rapamycin (2 mg/kg dissolved in PBS) or PBS alone days 1–6 (n=9/group). (A, B) Weight changes and DAI scores were measured daily. The data are representative of at least three independent experiments. Data represent the mean ± SD. * P < 0.05, ** P < 0.01, by two-way ANOVA followed by Tukey’s multiple-comparison test. Asterisks represent significant differences between cGAS KO DSS + PBS vs. cGAS KO DSS + Rapamycin. Triangles represent significant differences between cGAS KO DSS + PBS vs. WT DSS + PBS. (C) Western blot (WB) analysis of LC3II/LC3I, and SQSTM1/p-62 (n=9). (D, E) WB quantification for LC3 II and SQSTM1/p-62. (F) Western blot (WB) analysis of LC3-I/II from GFP-vector and GFP-cGAS transfected HCT-116 cells, stimulated with poly dA:dT, and treated with chloroquine (CQ) 50mM and rapamycin 2mM. Protein lysates were collected at time points 0, 4, and 6 hours. (G) Quantification of LC3II/LC3I ratio of WB analysis of HCT-116 cells. (H, I) RT-qPCR analysis of relative mRNA expression of Tnfα (n=6) and Il6 (n=6) from WT DSS + PBS, cGAS KO DSS + PBS, WT DSS + Rapamycin, and cGAS KO DSS + Rapamycin. The data are representative of at least three independent experiments. Data represent the mean ± SD. * P < 0.05, ** P < 0.01, *** P < 0.001, and **** P < 0.0001 by one-way ANOVA followed by Tukey’s multiple-comparison test.
Figure 10:
Figure 10:. Proposed Paradigm. cGAS Upregulates Beclin-1 Mediated Autophagy and Prevents Intestinal Epithelial Cell Death.
Cellular stress results in the release of double stranded DNA. Intracellular free DNA binds to cGAS (green symbol) allowing for activation via conformational change. Activated cGAS binds Beclin-1 (Blue symbol), a key initiator of autophagy. Beclin-1 allows for lipidation of microtubule associated light chain 3-I (LC3-I) (purple symbol) to LC3-II (yellow symbol). The ratio of LC3-II/LC3-I is used to detect the conversion of LC3-I into LC3-II and is widely used as a marker to monitor autophagy. LC3-II contributes to the closure of autophagosomes and marks the cargo and transport protein, SQSTM1/p-62 (orange symbol) for subsequent degradation. SQSTM1/p-62 directly binds to LC3-II to facilitate the degradation of pathogenic substances. Build-up of or increased levels of SQSTM1/p-62 is a marker for autophagic dysfunction. Binding of cGAS to Beclin-1 leads to increased autophagy (red arrow) and decreased intestinal epithelial apoptosis (green arrow). cGAS deficiency leads to diminished autophagy via decreased levels of Beclin-1, decrease lipidation of LC3-I to LC3-II, and buildup of p-62. Decreased autophagy leads to increased intestinal epithelial cell death.

Similar articles

Cited by

References

    1. De Souza HSP, Fiocchi C. Immunopathogenesis of IBD: Current State of the Art. Nat Rev Gastroenterol Hepatol. 2016. January;13(1):13–27. - PubMed
    1. Kaplan GG. The Global Gurden of IBD: from 2015 to 2025. Nat Rev Gastroenterol Hepatol. 2015. December;12(12):720–7. - PubMed
    1. Rampton DS, Shanahan F. Fast Facts: Inflammatory Bowel Disease. Kargers Publication; Health Press, 2016.
    1. Coskun M Intestinal Epithelium in Inflammatory Bowel Disease. Frontiers in Medicine. 2014. August 25;1:24. - PMC - PubMed
    1. Cavlar T, Ablasser A, Hornung V. Induction of Type I IFNs by Intracellular DNA-Sensing Pathways. Immunol Cell Biol. 2012. May;90(5):474–82. - PubMed

Publication types