

Characterizing Protein Protonation Microstates Using Monte Carlo Sampling
- PMID: 35344367
- PMCID: PMC8997239
- DOI: 10.1021/acs.jpcb.2c00139
Characterizing Protein Protonation Microstates Using Monte Carlo Sampling
Abstract
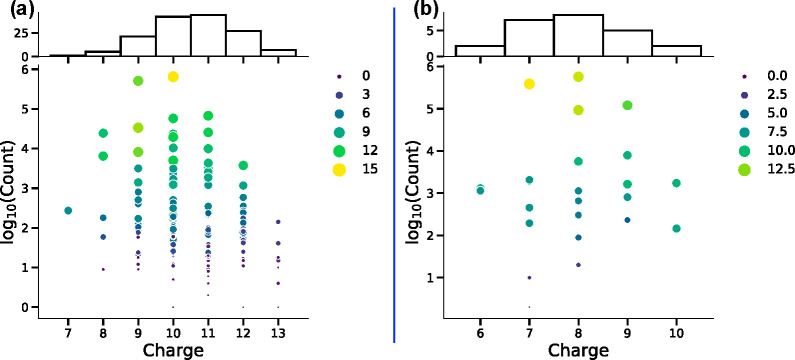
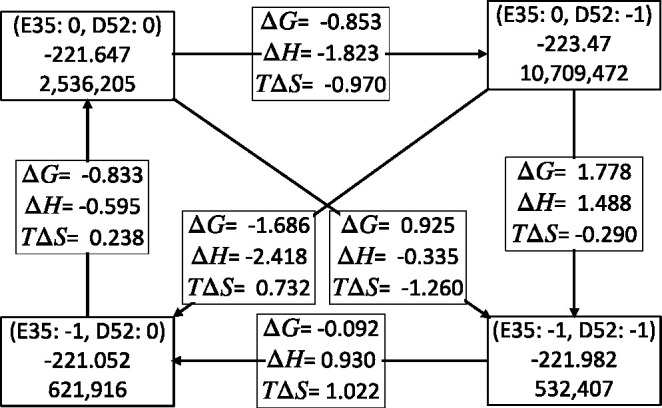
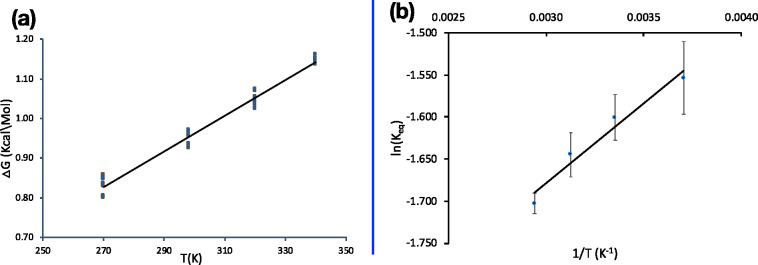
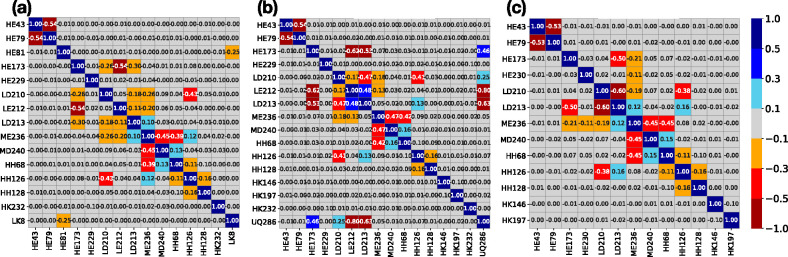
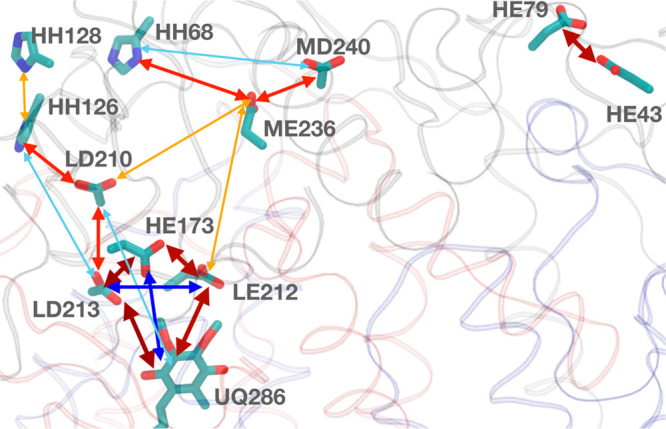
Proteins are polyelectrolytes with acidic and basic amino acids Asp, Glu, Arg, Lys, and His, making up ≈25% of the residues. The protonation state of residues, cofactors, and ligands defines a "protonation microstate". In an ensemble of proteins some residues will be ionized and others neutral, leading to a mixture of protonation microstates rather than in a single one as is often assumed. The microstate distribution changes with pH. The protein environment also modifies residue proton affinity so microstate distributions change in different reaction intermediates or as ligands are bound. Particular protonation microstates may be required for function, while others exist simply because there are many states with similar energy. Here, the protonation microstates generated in Monte Carlo sampling in MCCE are characterized in HEW lysozyme as a function of pH and bacterial photosynthetic reaction centers (RCs) in different reaction intermediates. The lowest energy and highest probability microstates are compared. The ΔG, ΔH, and ΔS between the four protonation states of Glu35 and Asp52 in lysozyme are shown to be calculated with reasonable precision. At pH 7 the lysozyme charge ranges from 6 to 10, with 24 accepted protonation microstates, while RCs have ≈50,000. A weighted Pearson correlation analysis shows coupling between residue protonation states in RCs and how they change when the quinone in the QB site is reduced. Protonation microstates can be used to define input MD parameters and provide insight into the motion of protons coupled to reactions.
Conflict of interest statement
The authors declare no competing financial interest.
Figures
Similar articles
-
Tools for analyzing protonation states and for tracing proton transfer pathways with examples from the Rb. sphaeroides photosynthetic reaction centers.Photosynth Res. 2023 Apr;156(1):101-112. doi: 10.1007/s11120-022-00973-0. Epub 2022 Oct 29. Photosynth Res. 2023. PMID: 36307598
-
Coupling of electron transfer to proton uptake at the Q(B) site of the bacterial reaction center: a perspective from FTIR difference spectroscopy.Biochim Biophys Acta. 2008 Oct;1777(10):1229-48. doi: 10.1016/j.bbabio.2008.06.012. Epub 2008 Jul 11. Biochim Biophys Acta. 2008. PMID: 18671937 Review.
-
Protonation of interacting residues in a protein by a Monte Carlo method: application to lysozyme and the photosynthetic reaction center of Rhodobacter sphaeroides.Proc Natl Acad Sci U S A. 1991 Jul 1;88(13):5804-8. doi: 10.1073/pnas.88.13.5804. Proc Natl Acad Sci U S A. 1991. PMID: 2062860 Free PMC article.
-
Simultaneous replacement of Asp-L210 and Asp-M17 with Asn increases proton uptake by Glu-L212 upon first electron transfer to QB in reaction centers from Rhodobacter sphaeroides.Biochemistry. 2001 Nov 20;40(46):13826-32. doi: 10.1021/bi011423w. Biochemistry. 2001. PMID: 11705371
-
Proton transfer pathways and mechanism in bacterial reaction centers.FEBS Lett. 2003 Nov 27;555(1):45-50. doi: 10.1016/s0014-5793(03)01149-9. FEBS Lett. 2003. PMID: 14630317 Review.
Cited by
-
Photosystem II: Probing Protons and Breaking Barriers.Biochemistry. 2025 May 6;64(9):1895-1906. doi: 10.1021/acs.biochem.5c00112. Epub 2025 Apr 7. Biochemistry. 2025. PMID: 40193597 Review.
-
Electrostatics in Computational Biophysics and Its Implications for Disease Effects.Int J Mol Sci. 2022 Sep 7;23(18):10347. doi: 10.3390/ijms231810347. Int J Mol Sci. 2022. PMID: 36142260 Free PMC article. Review.
-
Tools for analyzing protonation states and for tracing proton transfer pathways with examples from the Rb. sphaeroides photosynthetic reaction centers.Photosynth Res. 2023 Apr;156(1):101-112. doi: 10.1007/s11120-022-00973-0. Epub 2022 Oct 29. Photosynth Res. 2023. PMID: 36307598
-
Constant pH Simulation with FMM Electrostatics in GROMACS. (A) Design and Applications.J Chem Theory Comput. 2025 Feb 25;21(4):1762-1786. doi: 10.1021/acs.jctc.4c01318. Epub 2025 Feb 7. J Chem Theory Comput. 2025. PMID: 39919102 Free PMC article.
References
-
- Intlekofer A. M.; Wang B.; Liu H.; Shah H.; Carmona-Fontaine C.; Rustenburg A. S.; Salah S.; Gunner M. R.; Chodera J. D.; Cross J. R.; Thompson C. B. L-2-Hydroxyglutarate Production Arises from Noncanonical Enzyme Function at Acidic pH. Nat. Chem. Biol. 2017, 13 (5), 494–500. 10.1038/nchembio.2307. - DOI - PMC - PubMed
MeSH terms
Substances
LinkOut - more resources
Full Text Sources
