. 2022 Apr 5;119(14):e2117112119.
doi: 10.1073/pnas.2117112119. Epub 2022 Mar 28.

HIPK2 directs cell type-specific regulation of STAT3 transcriptional activity in Th17 cell differentiation

Affiliations

HIPK2 directs cell type-specific regulation of STAT3 transcriptional activity in Th17 cell differentiation

Ka Lung Cheung et al. Proc Natl Acad Sci U S A. .

Abstract

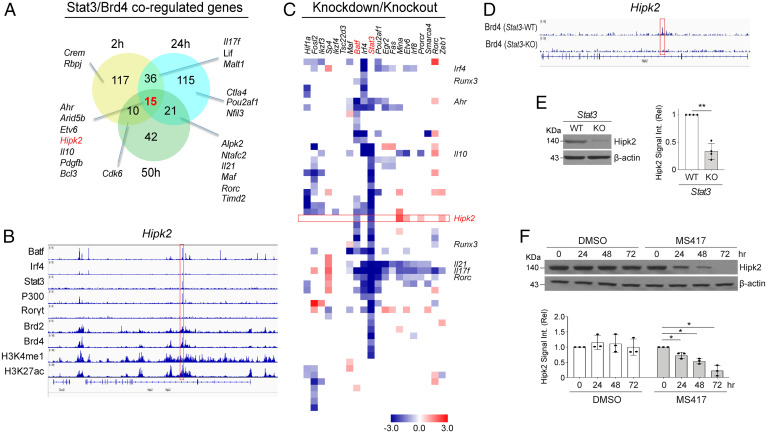
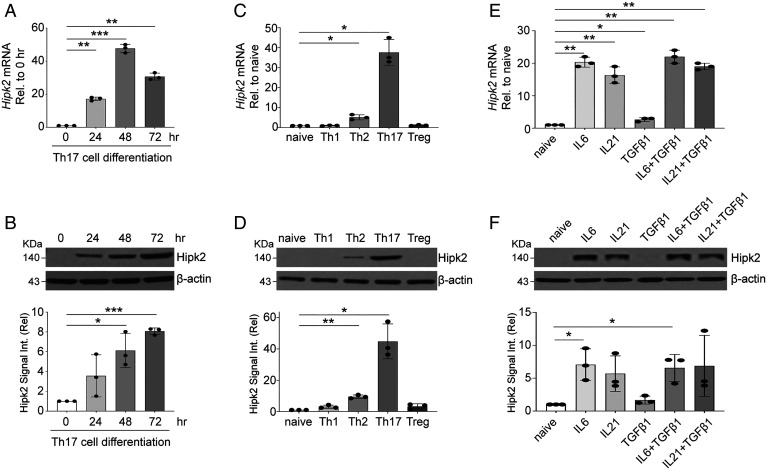
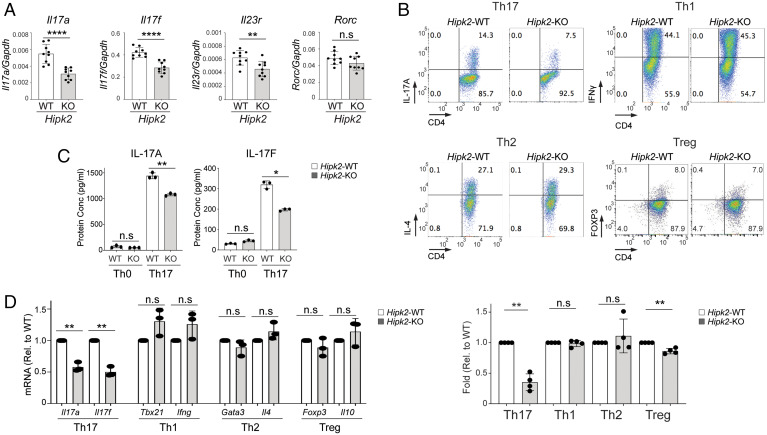
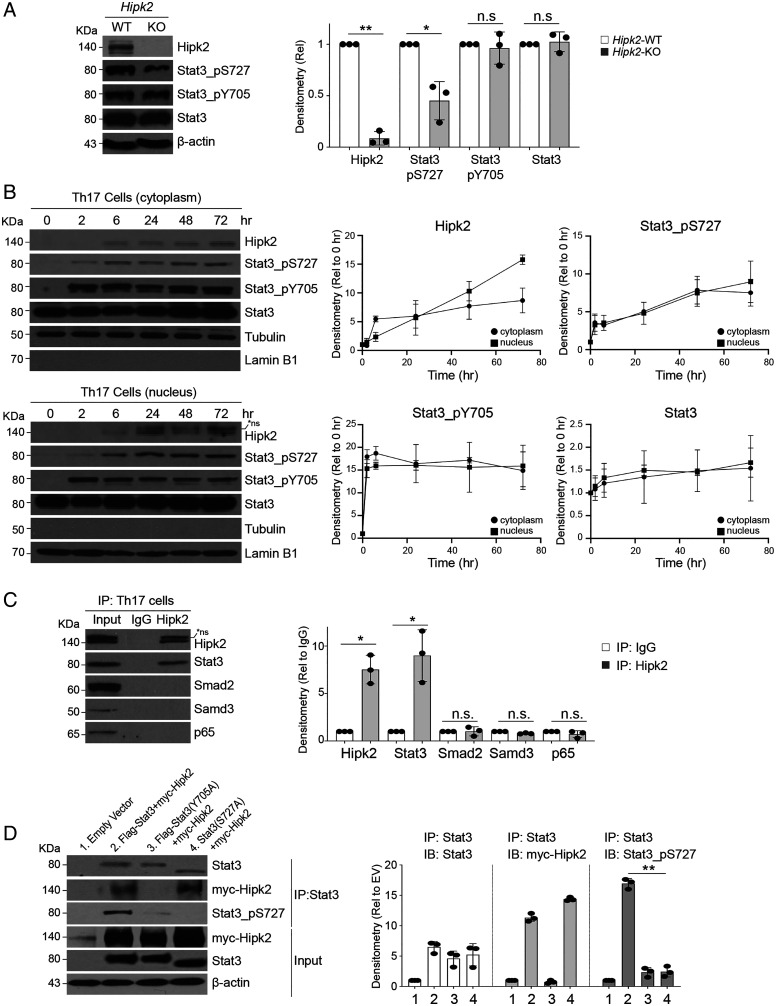
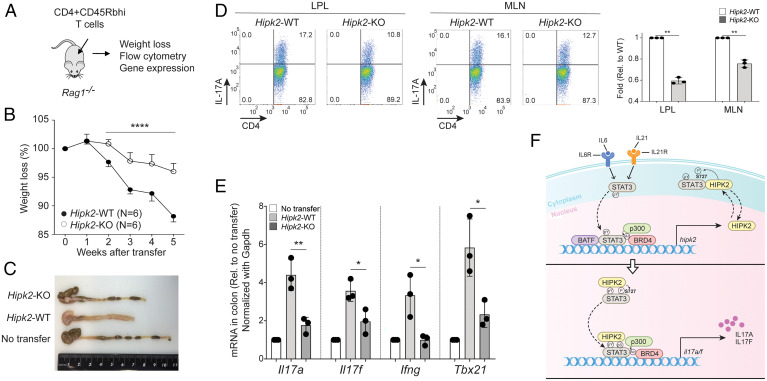
SignificanceSTAT3 (signal transducer and activator of transcription 3) is a master transcription factor that organizes cellular responses to cytokines and growth factors and is implicated in inflammatory disorders. STAT3 is a well-recognized therapeutic target for human cancer and inflammatory disorders, but how its function is regulated in a cell type-specific manner has been a major outstanding question. We discovered that Stat3 imposes self-directed regulation through controlling transcription of its own regulator homeodomain-interacting protein kinase 2 (Hipk2) in a T helper 17 (Th17) cell-specific manner. Our validation of the functional importance of the Stat3-Hipk2 axis in Th17 cell development in the pathogenesis of T cell-induced colitis in mice suggests an approach to therapeutically treat inflammatory bowel diseases that currently lack a safe and effective therapy.

Keywords: STAT3; Th17 cell differentiation; chromatin biology; gene transcription.


Conflict of interest statement

The authors declare no competing interest.

Figures

Fig. 1.
Fig. 1.
Regulation of transcriptional expression of Hipk2 in Th17 cells by Stat3 and Brd4. (A) Venn diagram showing Stat3- and Brd4-cobound genes that exhibited decreased transcriptional expression in mouse Th17 cells after treatment of the Brd4 BrD inhibitor MS402 for 2, 24, and 50 h, as indicated. Mouse naïve CD4+ T cells were activated with Th17 conditions (anti-CD3, anti-CD28, IL-6, and TGFβ-1) for 72 h before analysis, unless otherwise indicated. (B) ChIP-seq profile of Batf, Irf4, Stat3, p300, RORγT, Brd2, Brd4, H3K4me, and H3K27ac on the Hipk2 gene locus in mouse Th17 cells. (C) Heatmap of mRNA expression of Brd4-regulated genes (y axis: Irf4, Runx3, Ahr, Il10, Hipk2, Runx3, Il21, Il17f, and Rorc) under different KO/knockdown conditions (x axis) in Th17 cells. (D) ChIP-seq profile of Brd4 on the Hipk2 gene locus in Stat3-WT (Stat3fl/fl) and Stat3-KO (Cd4-Cre;Stat3fl/fl) Th17 cells. (E) Protein expression (Left) and densitometry analysis (Right) of Hipk2 in Stat3-WT and Stat3-KO Th17 cells collected after 72-h ex vivo differentiation of mouse naïve CD4+ T cells. (F) Protein expression (Left) and densitometry analysis (Right) of Hipk2 and β-actin in Th17 cells treated with dimethyl sulfoxide (DMSO) control or Brd4 inhibitor MS417 (125 nM) for 24, 48, and 72 h during the course of 72-h Th17 cell differentiation with DMSO or MS417 being added on day 2, 1, or 0, respectively. Data from four (E) or three (F) independent experiments are presented as mean ± SD. Statistical analyses were performed using a paired t test. *P < 0.05, **P < 0.01.
Fig. 2.
Fig. 2.
Hipk2 is selectively expressed during Th17 cell differentiation. (A and B) Hipk2 mRNA (A) and protein expression (B, Upper) and densitometry analysis (B, Lower) as assessed at 0, 24, 48, and 72 h during Th17 cell differentiation (anti-CD3, anti-CD28, IL-6, and TGFβ-1) from mouse primary naïve CD4+ T cells. (C and D) Hipk2 mRNA (C) and protein expression (D, Upper) and densitometry analysis (D, Lower) in mouse primary naïve, Th1 (IL-12 and anti–IL-4), Th2 (IL-4, anti–IL-12, and anti–IFN-γ), Th17 (IL-6 and TGFβ-1), and Treg (TGFβ-1) cells after 72 h of cell differentiation. (E and F) Hipk2 mRNA (E) and protein expression (F, Upper) and densitometry analysis (F, Lower) in mouse primary naïve T cells treated with IL-6, IL-21, TGFβ-1, IL-6+TGFβ-1, or IL-21+TGFβ-1 for 72 h. Data from three independent experiments are presented as mean ± SD. Statistical analyses were performed using a paired t test. *P < 0.05, **P < 0.01, ***P < 0.001.
Fig. 3.
Fig. 3.
Hipk2 is functionally important for Th17 cell differentiation. (A) mRNA expression of Il17a, Il17f, Il23r, and Rorc in Hipk2-WT (Hipk2fl/fl) and Hipk2-KO (Cre-ERT2;Hipk2fl/fl) Th17 cells differentiated for 72 h. Hipk2fl/fl and Cre-ERT2;Hipk2fl/fl naïve T cells were isolated from mice injected with tamoxifen to induce Cre recombination (SI Appendix, Materials and Methods). (B) Flow cytometry plots (Upper) and statistical analysis (Lower) of Th17, Th1, Th2, and Treg cells differentiated from Hipk2-WT and Hipk2-KO mouse primary naïve CD4+ T cells for 72 h. (C) ELISA analysis of IL-17A and IL-17F in supernatant of Hipk2-WT and Hipk2-KO Th17 cells cultured for 72 h. (D) mRNA expression levels of Il17a and Il17f in Th17 cells, Tbx21 and Ifng in Th1 cells, Gata3 and Il4 in Th2 cells, and Foxp3 and Il10 in Treg cells, differentiated ex vivo for 72 h from mouse (Hipk2-WT and Hipk2-KO) primary naïve CD4+ T cells. Data from three or more independent experiments (n = 9, A; n = 4, B; n = 3, C and D) are presented as mean ± SD. Statistical analyses were performed by unpaired (A) and paired (BD) t tests. *P < 0.05, **P < 0.01, ****P < 0.0001; n.s, not significant.
Fig. 4.
Fig. 4.
Hipk2 phosphorylates Stat3 at S727 in Th17 cells. (A) Protein expression (Left) and densitometry analysis (Right) of Hipk2, Stat3_pS727, Stat3_pY705, Stat3, and β-actin in Hipk2-WT (Hipk2fl/fl) and Hipk2-KO (Cre-ERT2;Hipk2fl/fl) Th17 cells differentiated for 72 h. (B) Protein expression (Left) and densitometry analysis (Right) of Hipk2, Stat3_pS727, Stat3_pY705, and Stat3 during Th17 cell differentiation of mouse primary naïve CD4+ T cells. The cells were collected at different time points (0, 2, 6, 24, 48, and 72 h) and fractionated into cytosolic and nuclear fractions, followed by Western blotting of Hipk2, Stat3_pS727, Stat3_pY705, Stat3, tubulin, and lamin B1. *ns denotes a nonspecific band. (C) Th17 cells differentiated for 72 h were assessed for Hipk2–Stat3, Hipk2–Smad2, Hipk2–Smad3, and Hipk2–p65 interactions using immunoprecipitation of Hipk2 followed by Western blotting of Hipk2, Stat3, Smad2, Smad3, and p65 (Left) and densitometry analysis (Right). (D) Analysis of Stat3–Hipk2 interaction in HEK293 cells transiently cotransfected with combinations of myc-Hipk2, flag-Stat3, flag-Stat3(Y705A), and Stat3(S727A). Cell lysates were subjected to immunoprecipitation with Stat3 antibody, followed by Western blotting analysis as indicated (Left) and densitometry analysis (Right). EV, empty vector; IB, immunoblotting. Data are shown as one representative of three independent experiments presented as mean ± SD. Statistical analyses were performed using a paired t test. *P < 0.05, **P < 0.01; n.s, not significant.
Fig. 5.
Fig. 5.
Hipk2 phosphorylation of Stat3 at Ser727 is required for Th17 signature gene expression. (A) ChIP-qPCR analysis of Hipk2, Stat3_pS727, Stat3, and p300 binding at Stat3-binding sites of Il17a, Il17f, and Rorc gene loci in Th17 cells differentiated for 72 h. (B) Luciferase reporter assay assessing effects of cotransfection of Hipk2, Hipk2(K228R), Stat3, Stat3(Y705A), or Stat3(S727A) on STAT3-response element (SRE) transcriptional activation in HEK293 cells. (C) Naïve CD4+ T cells were retrovirally transduced with virus overexpressing Stat3-WT and Stat3(S727A) (S→A mutation of Stat3_S727), followed by Th17 cell differentiation for 72 h and qPCR analysis of Il17a, Il17f, Il21, and Rorc. (D) mRNA level of Il17a and Il17f in Th17 cells differentiated for 72 h and treated with Hipk2 inhibitor MS617 (0.5, 1, 3, and 5 μM) on day 0. (E) ELISA analysis of IL-17A and IL-17F in supernatant of Th17 cells differentiated for 72 h and treated with Hipk2 inhibitor MS617 (0.5, 1, 3, and 5 μM) on day 0. (F) ChIP-qPCR analysis of Stat3 binding on Stat3-binding sites (p1 to p6) of Il17a/f gene loci and gene desert region (negative control) in Th17 cells differentiated for 72 h and treated with Hipk2 inhibitor MS617 (5 μM) on day 0. Data from two (A), three (B, E, and F), five (C), and four (D) independent experiments are presented as mean ± SD. Statistical analyses were performed by unpaired (A) and paired (BF) t tests. *P < 0.05, **P < 0.01, ***P < 0.001; n.s, not significant.
Fig. 6.
Fig. 6.
Hipk2 is required in T cell transfer–induced colitis development in Rag1−/− mice. (A) Schematic diagram illustrating the T cell transfer–induced colitis mouse model study. (B) Body weight of Rag1−/− mice injected with Hipk2-WT (Hipk2fl/fl) or Hipk2-KO (Cre-ERT2;Hipk2fl/fl) naïve CD4+ T cells isolated from mouse spleen and lymph nodes. Hipk2fl/fl and Cre-ERT2;Hipk2fl/fl naïve T cells were isolated from mice injected with tamoxifen to induce Cre recombination (SI Appendix, Materials and Methods). (C) Assessment of colon length of Rag1−/− mice injected with Hipk2-WT or Hipk2-KO naïve CD4+ T cells, or PBS (“no transfer”) at the end of the in vivo study (5 wk after T cell transfer). (D) Flow cytometry (Left) and statistical analysis (Right) of Hipk2-WT or Hipk2-KO Th17 cells in lamina propria (LPL) and mesenteric lymph nodes (MLN) at the end of the in vivo study. (E) mRNA expression of Il17a, Il17f, Ifng, and Tbx21 in colon tissue of Rag1−/− mice injected with PBS (no transfer), Hipk2-WT, or Hipk2-KO naïve T cells. (F) Schematic diagram illustrating transcription regulation of the Hipk2 gene by Stat3, p300, Batf, and Brd4, and the function of Hipk2 in regulation of Stat3 activity for transcriptional expression of Th17 signature genes such as Il17a/f during Th17 cell differentiation. Data (D and E) from three independent experiments are presented as mean ± SD. Statistical analyses were performed using two-way ANOVA multiple-comparisons (B), paired (D), and unpaired (E) t tests. *P < 0.05, **P < 0.01, ****P < 0.0001.

Similar articles

Cited by

References

    1. Yang J., Sundrud M. S., Skepner J., Yamagata T., Targeting Th17 cells in autoimmune diseases. Trends Pharmacol. Sci. 35, 493–500 (2014). - PubMed
    1. Ishigame H., et al. , Differential roles of interleukin-17A and -17F in host defense against mucoepithelial bacterial infection and allergic responses. Immunity 30, 108–119 (2009). - PubMed
    1. Burkett P. R., Meyer zu Horste G., Kuchroo V. K., Pouring fuel on the fire: Th17 cells, the environment, and autoimmunity. J. Clin. Invest. 125, 2211–2219 (2015). - PMC - PubMed
    1. Ivanov I. I., et al. , The orphan nuclear receptor RORgammat directs the differentiation program of proinflammatory IL-17+ T helper cells. Cell 126, 1121–1133 (2006). - PubMed
    1. Ciofani M., et al. , A validated regulatory network for Th17 cell specification. Cell 151, 289–303 (2012). - PMC - PubMed

Substances

LinkOut - more resources