. 2022 Apr 5;119(14):e2111372119.
doi: 10.1073/pnas.2111372119. Epub 2022 Mar 28.

Tripling of western US particulate pollution from wildfires in a warming climate

Affiliations

Tripling of western US particulate pollution from wildfires in a warming climate

Yuanyu Xie et al. Proc Natl Acad Sci U S A. .

Abstract

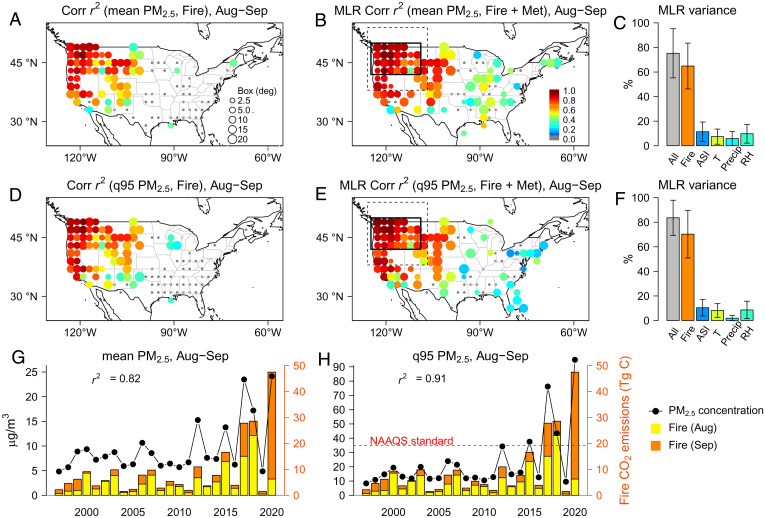
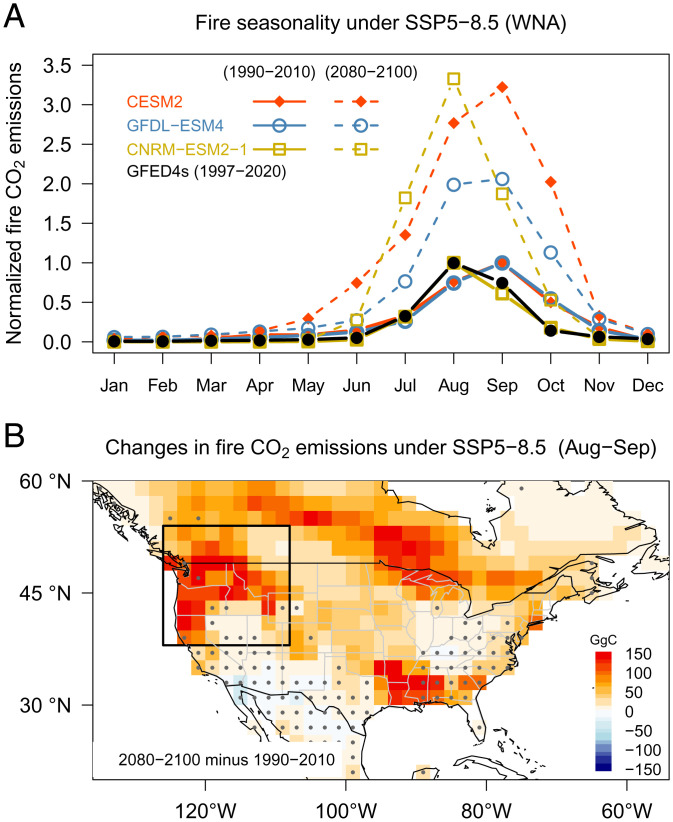
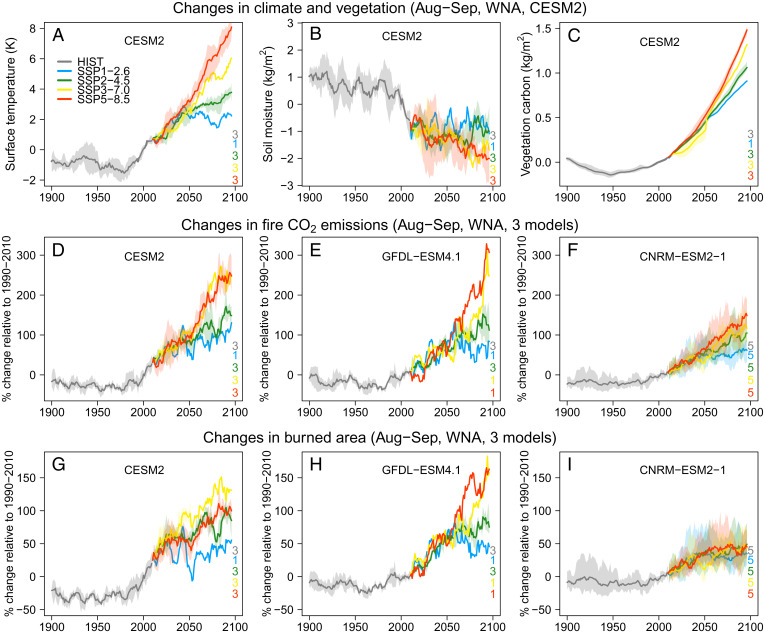
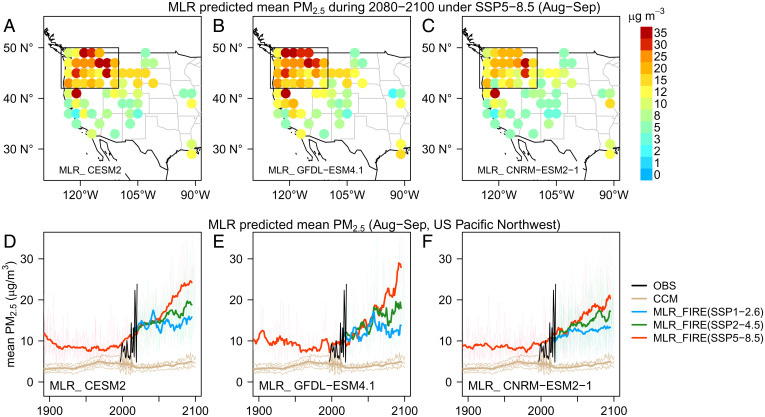
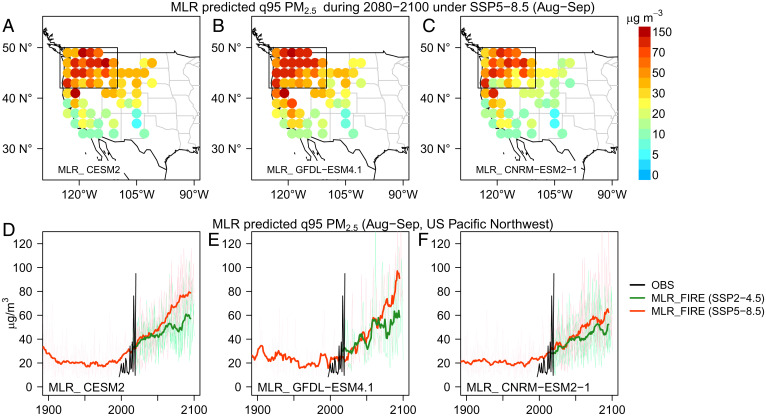
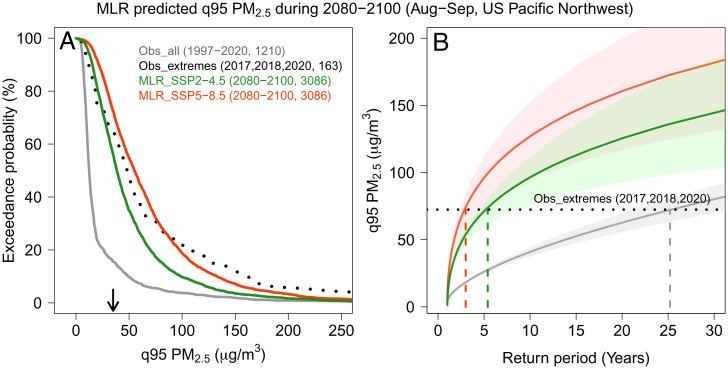
SignificanceRecord-setting fires in the western United States over the last decade caused severe air pollution, loss of human life, and property damage. Enhanced drought and increased biomass in a warmer climate may fuel larger and more frequent wildfires in the coming decades. Applying an empirical statistical model to fires projected by Earth System Models including climate-ecosystem-socioeconomic interactions, we show that fine particulate pollution over the US Pacific Northwest could double to triple during late summer to fall by the late 21st century under intermediate- and low-mitigation scenarios. The historic fires and resulting pollution extremes of 2017-2020 could occur every 3 to 5 y under 21st-century climate change, posing challenges for air quality management and threatening public health.

Keywords: Earth System Models; air quality; climate warming; drought; fires.


Conflict of interest statement

The authors declare no competing interest.

Figures

Fig. 1.
Fig. 1.
Observed correlations between fires and surface PM2.5 air quality. (AC) Correlation (Corr) r2 of mean PM2.5 averaged over each 2o × 2o grid with regional total CO2 emissions from fires in August (Aug) through September (Sep) during 1997–2020 derived from simple linear regression (A) versus MLR with consideration of meteorological (Met) variables (B) and the variance explained over the US Pacific Northwest (solid black box in B) by each predicting variable (C). The width of the box (in degrees [deg]), within which regional total fire emissions are best correlated with PM2.5 at that site, is given in the right corner in A. The r2 values are color-coded for sites with significant correlations, with gray indicating sites with insignificant correlations (P > 0.05). (DF) Same as AC, but for the q95 of available daily PM2.5 observations at each grid in August through September. (G and H) Time series of the mean and q95 PM2.5 in August through September averaged over US Pacific Northwest sites from 1997 to 2020, along with regional total CO2 emissions from fires integrated over western North America (dashed black box in B). Precip, precipitation; RH, relative humidity; T, temperature; ASI, air stagnation index.
Fig. 2.
Fig. 2.
Evaluating model simulations of fires over western North America. (A and B) The 2001–2020 climatology of August (Aug) through September (Sep) total burned area from MODIS satellite observations and fire CO2 emissions from GFED4s over North America. (C) The relative changes of August through September total burned area over western North America (WNA; black box on map) from 1980 to 2020 versus 2000–2014 averages from MODIS satellite observations (black) and from three CMIP6 land-only experiments (solid lines). (D) Same as C, but for fire CO2 emissions from two satellite-based inventories (black for GFED4s and gray for QFED2.5) and from three CMIP6 land-only experiments (solid lines). SDs (in percentages) and correlations r2 between models and observational datasets (QFED2.5 in parentheses) are shown in C and D.
Fig. 3.
Fig. 3.
Changes in fire seasonality in the late 21st century. (A) Monthly mean fire CO2 emissions over western North America (WNA) under present day (1990–2010, solid lines) and SSP5-8.5 (2080–2100, dashed lines) normalized by the month with peak emissions at present day from CMIP6 coupled model experiments. Also shown are satellite-based estimates for the present-day climate (black). (B) Multimodel and multiensemble mean changes in CO2 emissions from fires (in Gg C) in August (Aug) through September (Sep) during the late 21st century under SSP5-8.5 (2080–2100 minus 1990–2010). The results are first averaged across the available ensemble members from each model (three for CESM2, one for GFDL-ESM4.1, and five for CNRM-ESM2-1) and then averaged across the models. Stippling indicates grids with less than two models that show statistically significant (P < 0.05) changes or where the three models do not agree in sign. For each model, a change is defined as significant if >50% of the ensemble changes are statistically significant (P < 0.05).
Fig. 4.
Fig. 4.
Changes in climate and fires during August (Aug) through September (Sep) in the 21st century. Changes in 10-y running average of surface temperature (A), soil moisture in top 10 cm (B), and carbon mass in vegetation (C) relative to the 1990–2010 averages in August through September over western North America (WNA) from CESM2 historical simulations (gray) and future projections (colors) under four SSPs (SI Appendix, Table S1). (DI) Same as A, but for total fire emissions of CO2 (in percent) (DF) and burned area (in percent) (GI) from three CMIP6 Earth System Models: CESM2 (Left), GFDL-ESM4.1 (Center), and CNRM-ESM2-1 (Right). Thick lines represent the multiensemble mean, with shading illustrating the spread of available ensemble members (numbers denoted at the bottom-right corner of each graph).
Fig. 5.
Fig. 5.
Projected changes in August (Aug) through September (Sep) mean PM2.5 due to increasing fire emissions. (AC) The August through September mean PM2.5 in 2080–2100 at western US sites (averaged over a 2° × 2° grid) predicted by MLR driven by fires from three CMIP6 models under SSP5-8.5. Only grids with MLR correlation r2 > 0.5 are shown. (DF) Temporal evolution of August through September mean PM2.5 averaged over US Pacific Northwest sites (box on map) during 1900–2100 from the chemistry-climate model (CCM) simulations with prescribed fire emissions (tan lines) versus from the MLR model predictions, considering the impacts of future climate change on fire emissions under SSP1-2.6 (blue lines), SSP2-4.5 (green lines), and SSP5-8.5 (red lines). Thick lines represent 10-y running multiensemble averages, and thin lines represent averages for individual years from each ensemble member of each model (three for CESM2, one for GFDL-ESM4.1, and five for CNRM-ESM2-1). The August through September interannual time series from observations (OBS; black lines) is also shown for comparison.
Fig. 6.
Fig. 6.
Projected changes in PM2.5 extremes in August (Aug) through September (Sep) due to increasing fires. (AC) The q95 of daily PM2.5 during August through September in 2080–2100 at western US sites (computed over a 2° × 2° grid) predicted by MLR driven by fires from three CMIP6 models under SSP5-8.5. Only grids with MLR correlation r2 > 0.5 are shown. (DF) Temporal evolution of the q95 PM2.5 in August through September averaged over US Pacific Northwest sites (box on map) from the MLR model projections under SSP2-4.5 (green) and SSP5-8.5 (red). Thick lines represent 10-y running multiensemble averages, and thin lines represent averages for individual years from each ensemble member of each model (SI Appendix, Table S1). The August through September interannual time series from observations (OBS; black lines) is also shown for comparison.
Fig. 7.
Fig. 7.
Likelihood of historical pollution extremes in a warming climate. (A) Exceedance probability of the q95 of daily PM2.5 at US Pacific Northwest sites during August (Aug) through September (Sep): from observations during 1997–2020 (gray solid line) and during the 2017, 2018, and 2020 extreme fire seasons (black dotted line), from the MLR PM2.5 predictions driven by fires in three CMIP6 models during 2080–2100 under SSP2-4.5 (green) and SSP5-8.5 (red). The arrow denotes the 35 μg/m3 US National Ambient Air Quality Standard for 24-h average PM2.5. Numbers in brackets represent sample size for calculating the exceedance probability. (B) Return period of the q95 of daily PM2.5 at US Pacific Northwest sites in August through September fitted using generalized extreme value distribution from observations during 1997–2020 (black solid line) and from the MLR PM2.5 predictions driven by fires in three CMIP6 models during 2080–2100 under SSP2-4.5 (green) and SSP5-8.5 (red). The q95 of daily PM2.5 in August through September of 2017, 2018, and 2020 is marked as the horizontal dotted line. Shading for observations represents the 95% CIs of estimated PM2.5 levels for different return periods. Shading for MLR projections represents the maximum and minimum of estimated PM2.5 levels for different return periods from different model ensembles. Intercepts between the horizontal black dotted line and the fitted solid lines represent the return periods for the observed 2017–2020 extremes in present and future climates.

References

    1. US Environmental Protection Agency, Data from the 2017 National Emissions Inventory (2017). https://www.epa.gov/air-emissions-inventories/2017-national-emissions-in.... Accessed 20 March 2021.
    1. Bowman D. M. J. S., et al. , Vegetation fires in the Anthropocene. Nat. Rev. Earth Environ. 1, 500–515 (2020).
    1. Johnston F. H., et al. , Estimated global mortality attributable to smoke from landscape fires. Environ. Health Perspect. 120, 695–701 (2012). - PMC - PubMed
    1. Burke M., et al. , The changing risk and burden of wildfire in the United States. Proc. Natl. Acad. Sci. U.S.A. 118, e2011048118 (2021). - PMC - PubMed
    1. Schill G. P., et al. , Widespread biomass burning smoke throughout the remote troposphere. Nat. Geosci. 13, 422–427 (2020).