. 2022 Mar 28;17(3):e0265988.
doi: 10.1371/journal.pone.0265988. eCollection 2022.

Placental nutrient transporters adapt during persistent maternal hypoglycaemia in rats

Affiliations

Placental nutrient transporters adapt during persistent maternal hypoglycaemia in rats

Vivi F H Jensen et al. PLoS One. .

Abstract

Maternal malnutrition is associated with decreased nutrient transfer to the foetus, which may lead to foetal growth restriction, predisposing children to a variety of diseases. However, regulation of placental nutrient transfer during decreased nutrient availability is not fully understood. In the present study, the aim was to investigate changes in levels of placental nutrient transporters accompanying maternal hypoglycaemia following different durations and stages of gestation in rats. Maternal hypoglycaemia was induced by insulin-infusion throughout gestation until gestation day (GD)20 or until end of organogenesis (GD17), with sacrifice on GD17 or GD20. Protein levels of placental glucose transporters GLUT1 (45/55 kDa isotypes) and GLUT3, amino acid transporters SNAT1 and SNAT2, and insulin receptor (InsR) were assessed. On GD17, GLUT1-45, GLUT3, and SNAT1 levels were increased and InsR levels decreased versus controls. On GD20, following hypoglycaemia throughout gestation, GLUT3 levels were increased, GLUT1-55 showed the same trend. After cessation of hypoglycaemia at end of organogenesis, GLUT1-55, GLUT3, and InsR levels were increased versus controls, whereas SNAT1 levels were decreased. The increases in levels of placental nutrient transporters seen during maternal hypoglycaemia and hyperinsulinemia likely reflect an adaptive response to optimise foetal nutrient supply and development during limited availability of glucose.


Conflict of interest statement

The authors have declared that no competing interests exist.

Figures

Fig 1
Fig 1. Microscopic images of glucose transporter distribution in placenta on GD20.
Left panel (A-C): Double-staining for maternal trophoblasts (pink) and foetal microvascular endothelial cells (dark brown). Middle panel (D-F): GLUT1 (brown staining). In trophoblasts, a strong signal is present in the entire plasma membrane, seen in both the apical and basal membranes, but also in the membranes apposing adjacent trophoblasts (arrows). In foetal endothelial cells, a strong signal is present in the apical membrane (arrow heads). A diffuse signal is seen in the cytoplasm of both cell types. Right panel (G-I): GLUT3 (brown staining). A strong signal is present in the apical plasma membrane of trophoblasts (arrows) and foetal endothelial cells (arrow heads) facing the maternal and foetal circulation, respectively. A, D and G: CTRL group, B, E, and H: HI-GD20 group, C, E, and I: HI-GD17 group. 600 x magnification, scale-bar: 20 μm.
Fig 2
Fig 2
Result summary of nutrient transporter and InsR distribution (A) and protein levels (B) in placenta. A: Schematic illustration of the blood-placenta barrier and cellular distribution of the glucose transporters GLUT1 and GLUT3, amino acid transporters SNAT1 and SNAT2, as well as the insulin receptor (InsR) as shown by immunohistochemistry in controls in the present study. As it is not possible to differentiate between the GLUT1-45 and GLUT1-55 isotypes by the immunohistochemistry, these are not specified. For each transporter and the InsR, bold text indicates higher signal as compared to the same transporter not in bold in the same cell type (evaluated qualitatively, not quantitatively). Besides the localisation to the plasma membrane, as illustrated, all transporters and the InsR were also detected intra-cellularly in trophoblasts and foetal endothelial cells (not shown). The cell layers separating the maternal from the foetal circulation in rats are one loosely connected trophoblast layer (not shown), two trophoblast cell layers, and the foetal microvascular endothelial cells, where the trophoblast cell layers and basal membrane of the foetal vascular endothelial cell layer constitute the blood-placenta barrier [13, 14]. The main difference between the rat and human blood-placenta barrier is that the latter only contains one layer of trophoblast cells [13, 14]. B: Differences in placental protein levels in insulin-infused groups compared to controls as assessed by western blotting. ↑, increased levels; ↓, decreased levels; ↔, no change to levels, (↑), trend for increased levels.
Fig 3
Fig 3. Microscopic images of amino acid transporter and insulin receptor distribution in placenta on GD20.
Left panel (A-C): SNAT1 (brown staining). A strong signal is present in the apical plasma membrane of trophoblasts (arrows) and foetal endothelial cells (arrow heads) facing the maternal and foetal circulation, respectively. A diffuse signal is seen in the cytoplasm of both cell types. Middle panel (D-F): SNAT2 (brown staining). A diffuse signal was seen in the cytoplasm of trophoblasts, with an occasional strong signal in the apical plasma membrane (arrows). In foetal endothelial cells, the intracellular signal was very weak or absent; occasionally, a signal was detected in the apical membranes (arrow heads). Right panel (G-I): InsR (brown staining). A strong signal was seen in the apical plasma membranes of both trophoblasts (arrows) and foetal endothelial cells (arrow heads); a diffuse signal was seen in the cytoplasm of both cell types. Overall, signal was strongest in trophoblasts. A, D and G: CTRL group, B, E, and H: HI-GD20 group, C, E, and I: HI-GD17 group. 600 x magnification, scale-bar: 20 μm.
Fig 4
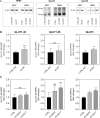
Fig 4. Placental glucose transporter protein levels, fold changes and SD.
A: Representative examples of the visualised bands cropped from the original image. Full length blot pictures are included in S1 Fig. Band sizes: HPRT (housekeeping gene), 25 kDa; GLUT1, approximately 40 and 60 kDa, respectively; GLUT3, 40 kDa. *p<0.05, **p<0.01, ***p<0.001 versus CTRL group. B: GD17. Group CTRL-INT, n = 7; HI-INT, n = 8. C: GD20. GLUT1-45: Group CTRL, n = 12; HI-GD20, n = 9 (1 extreme outlier identified by ROUT test); HI-GD17, n = 10. GLUT1-55: Group CTRL, n = 12; HI-GD20, n = 10; HI-GD17, n = 10. GLUT3: Group CTRL, n = 12; HI-GD20, n = 9 (1 extreme outlier identified by ROUT test); HI-GD17, n = 10. Statistical analysis: GD17: two-tailed Mann Whitney test. GD20: Kruskal-Wallis test, post hoc Dunn’s multiple comparisons test. NS, not statistically different.
Fig 5
Fig 5. Placental amino acid transporter and insulin receptor protein levels, fold changes and SD.
A: Representative examples of the visualised bands cropped from the original image. Full length blot pictures are included in S1 Fig. Band sizes: SNAT1, 70 kDa; SNAT2, double-band at approximately 48 and 53 kDa; InsR: 100 kDa. B: GD17. Group CTRL-INT, n = 7; HI-INT, n = 8. For SNAT2, the 3-fold change was driven by one extreme outlier (not significant by ROUT test), if excluded the fold change was 1.3. C: GD20. Group CTRL, n = 12, except for SNAT2, where n = 11 (1 extreme outlier identified by ROUT test); HI-GD20, n = 10; HI-GD17, n = 10. **p<0.01, ***p<0.001 versus CTRL group. ##p<0.01, ###p<0.001 versus HI-GD20 group. Statistical analysis: GD17: Two-tailed Mann Whitney test. GD20: Kruskal-Wallis test, post hoc Dunn’s multiple comparisons test. InsR, insulin receptor. NS, not statistically different.
Fig 6
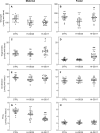
Fig 6. Maternal and foetal liver glycogen and lipid concentrations on GD20, individual (symbols) and means and SD.
Left panel: Maternal levels. Right panel: Foetal levels. A+B: Glycogen, C+D: Triglycerides, E+F: Cholesterol, G+H: FFA. Group CTRL, n = 21; group HI-GD20, n = 16; group HI-GD17, n = 20 for all maternal and foetal measurements except for maternal triglyceride levels, where n = 20 in the CTRL group and foetal triglyceride levels, where n = 15 in the HI-GD20 group, as one extreme outlier was identified in each of these groups (29.4 and 10.1 μmol/g, ROUT test) and excluded. FFAs, free fatty acids. *p<0.05, **p<0.01, ***p<0.001 versus group CTRL, #p<0.05, ##p<0.01, ###p<0.001 versus group HI-GD20. Analysed using a one-way ANOVA with a post hoc Tukey’s multiple comparisons test.

Similar articles

References

    1. Miller SL, Huppi PS, Mallard C. The consequences of fetal growth restriction on brain structure and neurodevelopmental outcome. J Physiol. 2016;594(4):807–23. Epub 2015/11/27. doi: 10.1113/JP271402 ; PubMed Central PMCID: PMC4753264. - DOI - PMC - PubMed
    1. Malhotra A, Allison BJ, Castillo-Melendez M, Jenkin G, Polglase GR, Miller SL. Neonatal Morbidities of Fetal Growth Restriction: Pathophysiology and Impact. Frontiers in endocrinology. 2019;10:55. Epub 2019/02/23. doi: 10.3389/fendo.2019.00055 ; PubMed Central PMCID: PMC6374308. - DOI - PMC - PubMed
    1. Varvarigou AA. Intrauterine growth restriction as a potential risk factor for disease onset in adulthood. Journal of pediatric endocrinology & metabolism: JPEM. 2010;23(3):215–24. Epub 2010/05/20. doi: 10.1515/jpem.2010.23.3.215 . - DOI - PubMed
    1. Lee AC, Kozuki N, Cousens S, Stevens GA, Blencowe H, Silveira MF, et al.. Estimates of burden and consequences of infants born small for gestational age in low and middle income countries with INTERGROWTH-21(st) standard: analysis of CHERG datasets. BMJ (Clinical research ed). 2017;358:j3677. Epub 2017/08/19. doi: 10.1136/bmj.j3677 ; PubMed Central PMCID: PMC5558898 at www.icmje.org/coi_disclosure.pdf and declare: financial support for the submitted work from the Bill and Melinda Gates Foundation by a grant to the US Fund for UNICEF; no financial relationships with any organizations that might have an interest in the submitted work in the previous three years; no other relationships or activities that could appear to have influenced the submitted work. - DOI - PMC - PubMed
    1. Jensen VFH, Molck AM, Lykkesfeldt J, Bogh IB. Effect of maternal hypoglycaemia during gestation on materno-foetal nutrient transfer and embryo-foetal development: Evidence from experimental studies focused primarily on the rat. Reproductive toxicology (Elmsford, NY). 2018;77:1–24. Epub 2018/02/07. doi: 10.1016/j.reprotox.2018.01.007 . - DOI - PubMed