

Identifying the source of spurious signals caused by B0 inhomogeneities in single-voxel 1 H MRS
- PMID: 35344600
- PMCID: PMC9311141
- DOI: 10.1002/mrm.29222
Identifying the source of spurious signals caused by B0 inhomogeneities in single-voxel 1 H MRS
Abstract
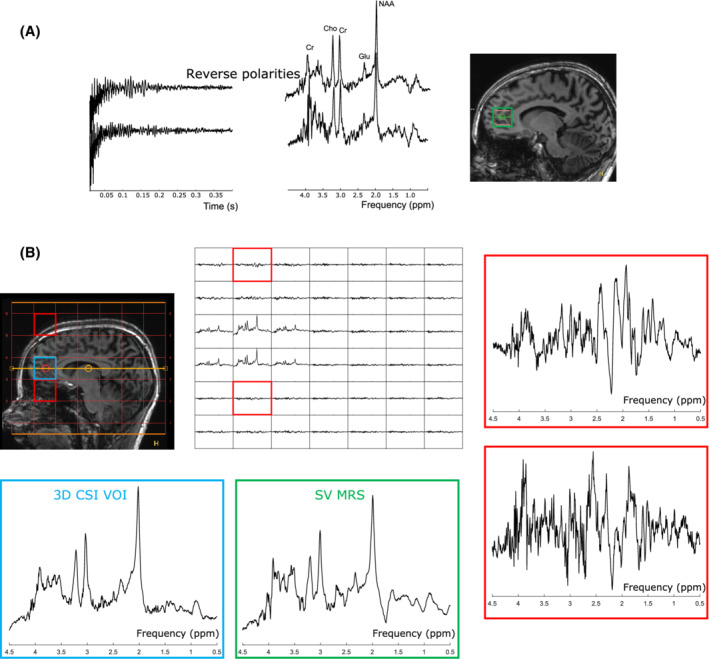
Purpose: Single-voxel MRS (SV MRS) requires robust volume localization as well as optimized crusher and phase-cycling schemes to reduce artifacts arising from signal outside the volume of interest. However, due to local magnetic field gradients (B0 inhomogeneities), signal that was dephased by the crusher gradients during acquisition might rephase, leading to artifacts in the spectrum. Here, we analyzed this mechanism, aiming to identify the source of signals arising from unwanted coherence pathways (spurious signals) in SV MRS from a B0 map.
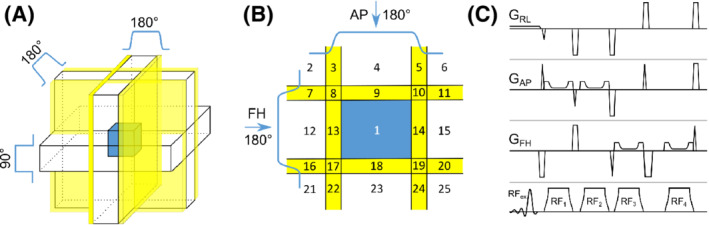
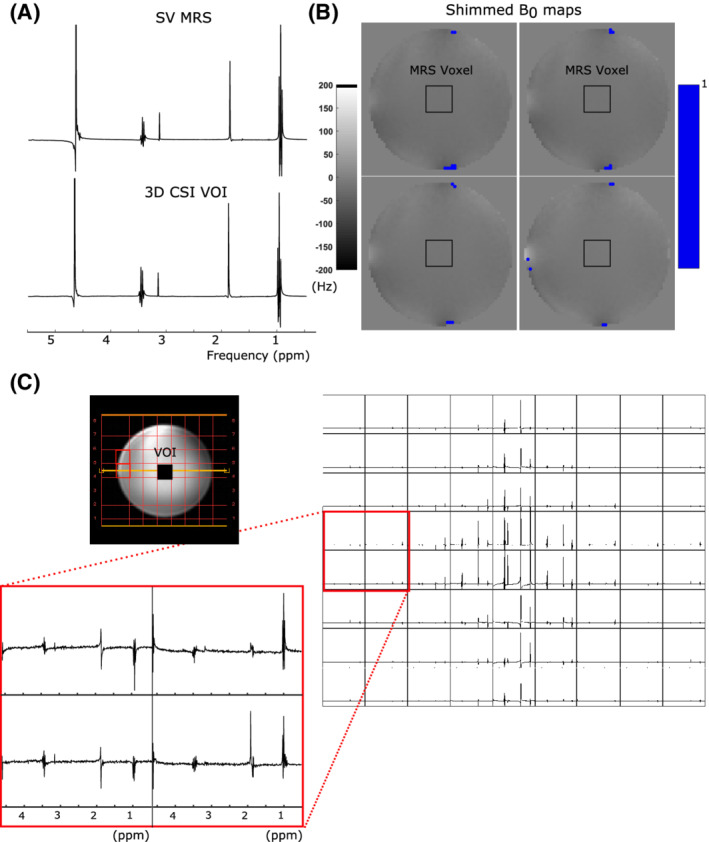
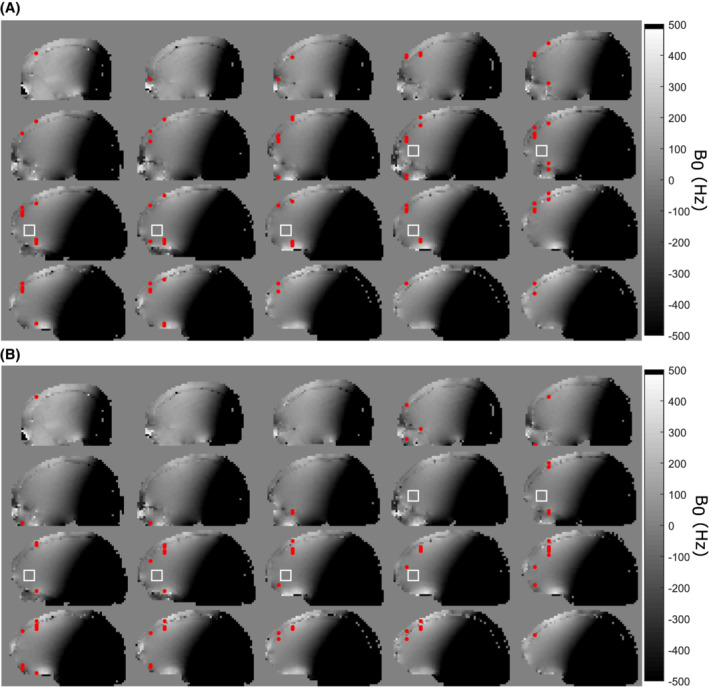
Methods: We investigated all possible coherence pathways associated with imperfect localization in a semi-localized by adiabatic selective refocusing (semi-LASER) sequence for potential rephasing of signals arising from unwanted coherence pathways by a local magnetic field gradient. We searched for locations in the B0 map where the signal dephasing due to external (crusher) and internal (B0 ) field gradients canceled out. To confirm the mechanism, SV-MR spectra (TE = 31 ms) and 3D-CSI data with the same volume localization as the SV experiments were acquired from a phantom and 2 healthy volunteers.
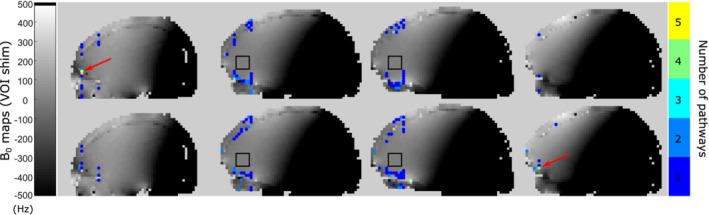
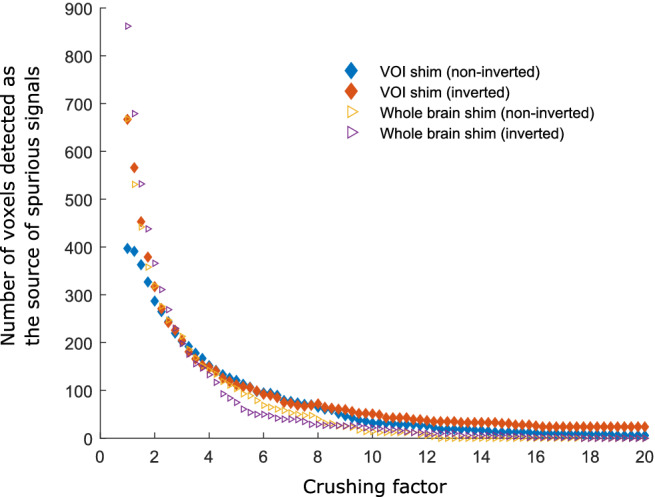
Results: Our analysis revealed that potential sources of spurious signals were scattered over multiple locations throughout the brain. This was confirmed by 3D-CSI data. Moreover, we showed that the number of potential locations where spurious signals could originate from monotonically decreases with crusher strength.
Conclusion: We proposed a method to identify the source of spurious signals in SV 1 H MRS using a B0 map. This can facilitate MRS sequence design to be less sensitive to experimental artifacts.
Keywords: 1H MRS; B0 inhomogeneity gradients; coherence pathways; spurious signals.
© 2022 The Authors. Magnetic Resonance in Medicine published by Wiley Periodicals LLC on behalf of International Society for Magnetic Resonance in Medicine.
Figures

Similar articles
-
Simultaneous optimization of crusher and phase cycling schemes for magnetic resonance spectroscopy: an extension of dephasing optimization through coherence order pathway selection.Magn Reson Med. 2020 Feb;83(2):391-402. doi: 10.1002/mrm.27952. Epub 2019 Sep 17. Magn Reson Med. 2020. PMID: 31529647
-
Impact of gradient scheme and non-linear shimming on out-of-voxel echo artifacts in edited MRS.NMR Biomed. 2023 Feb;36(2):e4839. doi: 10.1002/nbm.4839. Epub 2022 Oct 19. NMR Biomed. 2023. PMID: 36196802 Free PMC article.
-
Dephasing optimization through coherence order pathway selection (DOTCOPS) for improved crusher schemes in MR spectroscopy.Magn Reson Med. 2019 Apr;81(4):2209-2222. doi: 10.1002/mrm.27587. Epub 2018 Nov 3. Magn Reson Med. 2019. PMID: 30390346
-
B0 magnetic field homogeneity and shimming for in vivo magnetic resonance spectroscopy.Anal Biochem. 2017 Jul 15;529:17-29. doi: 10.1016/j.ab.2016.06.003. Epub 2016 Jun 9. Anal Biochem. 2017. PMID: 27293215 Free PMC article. Review.
-
Motion correction in magnetic resonance spectroscopy.Magn Reson Med. 2020 Nov;84(5):2312-2326. doi: 10.1002/mrm.28287. Epub 2020 Apr 17. Magn Reson Med. 2020. PMID: 32301174 Free PMC article. Review.
Cited by
-
Identifying out-of-voxel echoes in edited MRS with phase cycle inversion.bioRxiv [Preprint]. 2025 Jun 29:2025.06.26.661810. doi: 10.1101/2025.06.26.661810. bioRxiv. 2025. PMID: 40693601 Free PMC article. Preprint.
References
-
- de Graaf RA. In Vivo NMR Spectroscopy. John Wiley & Sons; 2019.
-
- Bhogal AA, Schür RR, Houtepen LC, et al. 1H‐MRS processing parameters affect metabolite quantification: the urgent need for uniform and transparent standardization. NMR Biomed. 2017;30:e3804. - PubMed
-
- Kreis R. Issues of spectral quality in clinical 1H‐magnetic resonance spectroscopy and a gallery of artifacts. NMR Biomed. 2004;17:361‐381. - PubMed
Publication types
MeSH terms
LinkOut - more resources
Full Text Sources
Medical
