

A contribution to MRI safety testing related to gradient-induced heating of medical devices
- PMID: 35344605
- PMCID: PMC9314691
- DOI: 10.1002/mrm.29235
A contribution to MRI safety testing related to gradient-induced heating of medical devices
Abstract
Purpose: To theoretically investigate the feasibility of a novel procedure for testing the MRI gradient-induced heating of medical devices and translating the results into clinical practice.
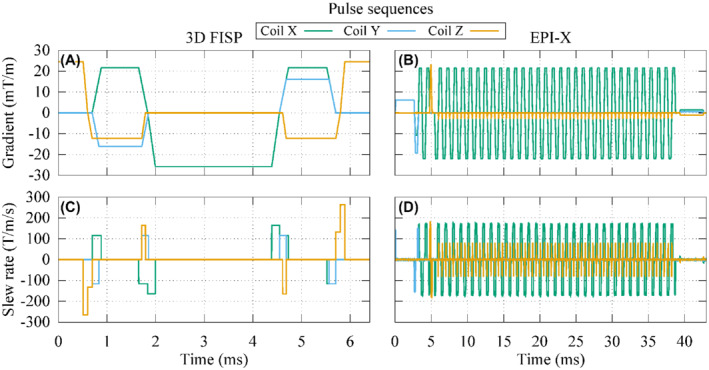
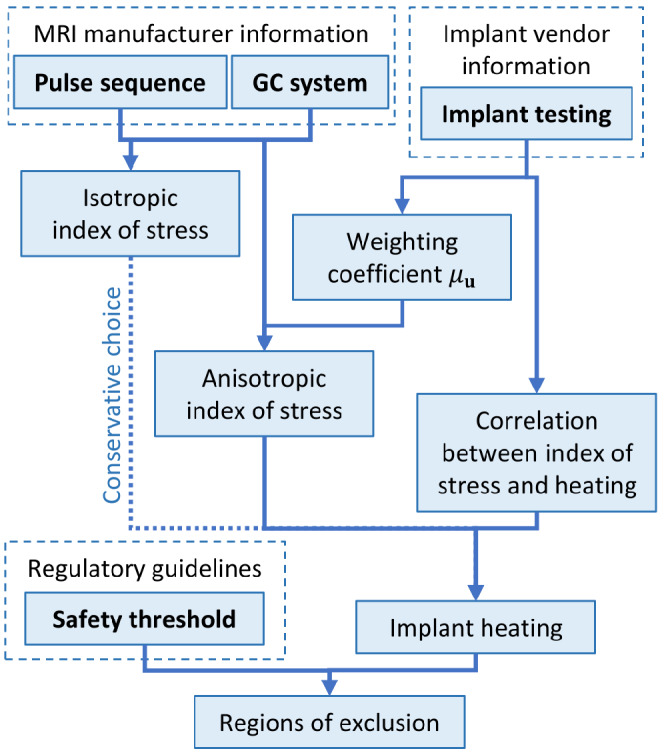
Methods: The concept of index of stress is introduced by decoupling the time waveform characteristics of the gradient field signals from the field spatial distribution within an MRI scanner. This index is also extended to consider the anisotropy of complex bulky metallic implants. Merits and drawbacks of the proposed index of stress are investigated through virtual experiments. In particular, the values of the index of stress evaluated for realistic orthopedic implants placed within an ASTM phantom are compared with accurate heating simulations performed with 2 anatomic body models (a man and a woman) implanted through a virtual surgery procedure.
Results: The manipulation of the proposed index of stress allows to identify regions within the MRI bore where the implant could affect the safety of the examinations. Furthermore, the conducted analysis shows that the power dissipated into the implant by the induced eddy currents is a dosimetric quantity that estimates well the maximum temperature increase in the tissues surrounding the implant.
Conclusion: The results support the adoption of an anisotropic index of stress to regulate the gradient-induced heating of geometrically complex implants. They also pave the way for a laboratory characterization of the implants based on electrical measurements, rather than on thermal measurements. The next step will be to set up a standardized experimental procedure to evaluate the index of stress associated with an implant.
Keywords: MRI safety; gradient coil heating; medical devices; numerical simulation.
© 2022 The Authors. Magnetic Resonance in Medicine published by Wiley Periodicals LLC on behalf of International Society for Magnetic Resonance in Medicine.
Figures


Similar articles
-
Efficient prediction of MRI gradient-induced heating for guiding safety testing of conductive implants.Magn Reson Med. 2023 Nov;90(5):2011-2018. doi: 10.1002/mrm.29787. Epub 2023 Jun 29. Magn Reson Med. 2023. PMID: 37382200
-
Parameters Affecting Worst-Case Gradient-Field Heating of Passive Conductive Implants.J Magn Reson Imaging. 2022 Oct;56(4):1197-1204. doi: 10.1002/jmri.28321. Epub 2022 Jul 1. J Magn Reson Imaging. 2022. PMID: 35778374
-
MRI-Related Heating of Implants and Devices: A Review.J Magn Reson Imaging. 2021 Jun;53(6):1646-1665. doi: 10.1002/jmri.27194. Epub 2020 May 26. J Magn Reson Imaging. 2021. PMID: 32458559 Review.
-
Heating of hip joint implants in MRI: The combined effect of RF and switched-gradient fields.Magn Reson Med. 2021 Jun;85(6):3447-3462. doi: 10.1002/mrm.28666. Epub 2021 Jan 22. Magn Reson Med. 2021. PMID: 33483979 Free PMC article.
-
MRI-induced heating of selected thin wire metallic implants-- laboratory and computational studies-- findings and new questions raised.Minim Invasive Ther Allied Technol. 2006;15(2):76-84. doi: 10.1080/13645700600640931. Minim Invasive Ther Allied Technol. 2006. PMID: 16754190 Review.
Cited by
-
An in silico testbed for fast and accurate MR labeling of orthopedic implants.Elife. 2023 Dec 14;12:RP90440. doi: 10.7554/eLife.90440. Elife. 2023. PMID: 38096104 Free PMC article.
-
Metrology for MRI: the field you've never heard of.MAGMA. 2025 Jul;38(3):387-412. doi: 10.1007/s10334-025-01238-2. Epub 2025 Mar 19. MAGMA. 2025. PMID: 40106079 Free PMC article. Review.
-
Classification Scheme of Heating Risk during MRI Scans on Patients with Orthopaedic Prostheses.Diagnostics (Basel). 2022 Aug 2;12(8):1873. doi: 10.3390/diagnostics12081873. Diagnostics (Basel). 2022. PMID: 36010224 Free PMC article.
References
-
- Owen PF, Shein M, Food and Drug Administration Perspective . Magnetic resonance imaging of pacemaker and implantable cardioverter‐defibrillator patients. Circulation. 2006;114:1232. - PubMed
-
- Kalin R, Stanton MS. Current clinical issues for MRI scanning of pacemaker and defibrillator patients. Pacing Clin Electrophysiol. 2005;28:326‐328. - PubMed
-
- U.S. Food & Drug . Testing and labeling medical devices for safety in the magnetic resonance (MR) environment. Guidance for Industry and Food and Drug Administration Staff. Center for Devices and Radiological Health; Document issued on May 20; 2021.
-
- Nyenhuis JA, Park S‐M, Kamondetdacha R, Amjad A, Shellock FG, Rezai AR. MRI and implanted medical devices: basic interactions with an emphasis on heating. IEEE Trans Device Mater Rel. 2005;5:467‐480.
Publication types
MeSH terms
LinkOut - more resources
Full Text Sources
