. 2022 Apr:78:103950.
doi: 10.1016/j.ebiom.2022.103950. Epub 2022 Mar 26.

Indirubin-3'-monoxime acts as proteasome inhibitor: Therapeutic application in multiple myeloma

Affiliations

Indirubin-3'-monoxime acts as proteasome inhibitor: Therapeutic application in multiple myeloma

Zhen Yu et al. EBioMedicine. 2022 Apr.

Abstract

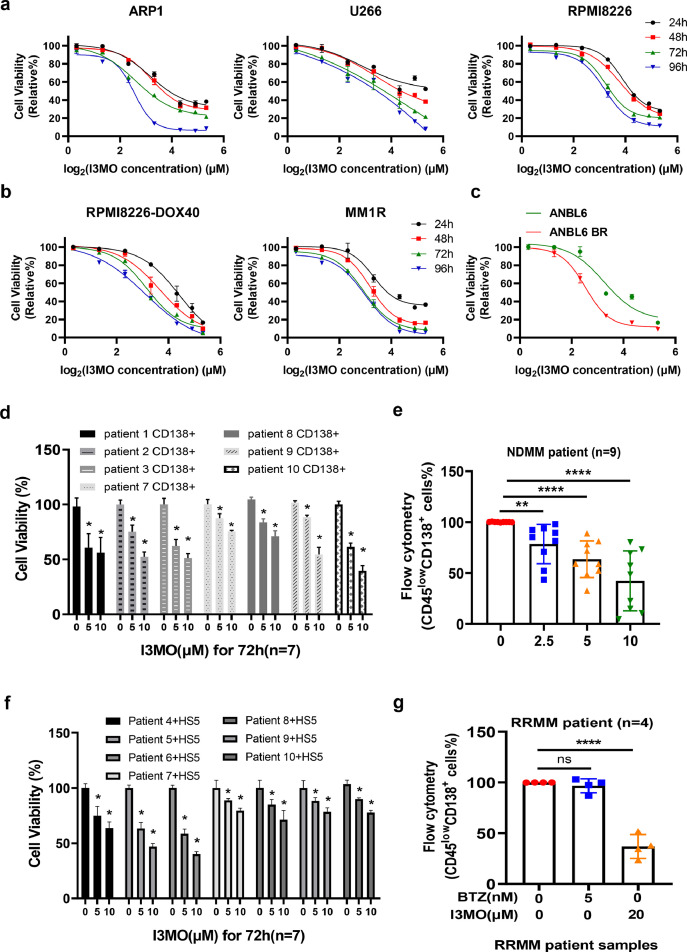
Background: Multiple myeloma (MM) is still an incurable malignancy of plasma cells. Proteasome inhibitors (PIs) work as the backbone agent and have greatly improved the outcome in majority of newly diagnosed patients with myeloma. However, drug resistance remains the major obstacle causing treatment failure in clinical practice. Here, we investigated the effects of Indirubin-3'-monoxime (I3MO), one of the derivatives of Indirubin, in the treatment of MM.

Methods: MM patient primary samples and human cell lines were examined. I3MO effects on myeloma treatment and the underling molecular mechanisms were investigated via in vivo and in vitro study.

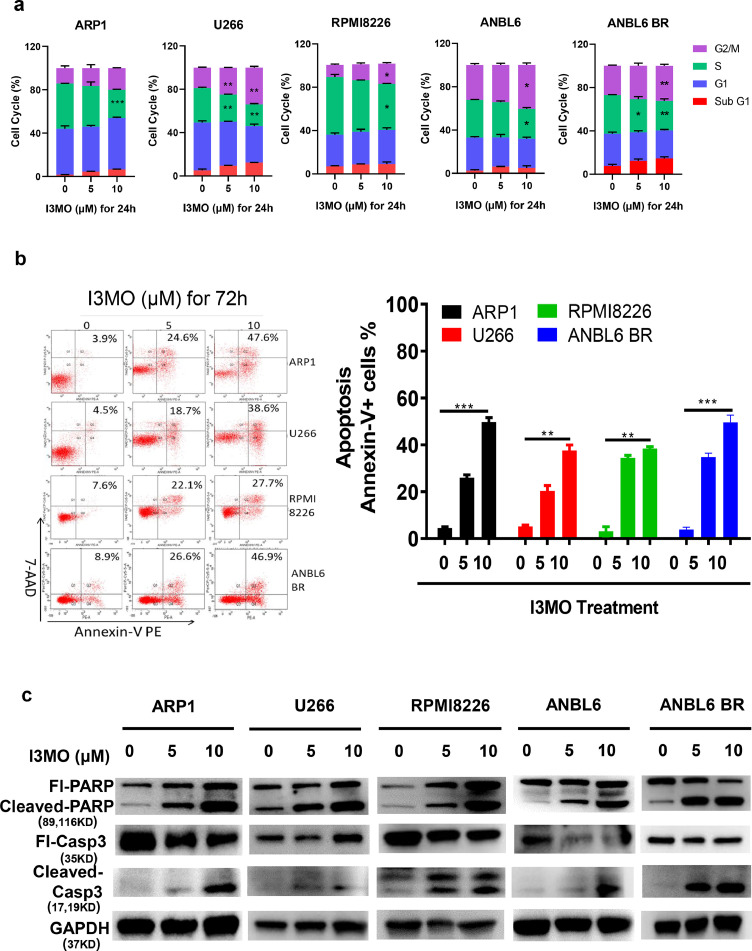
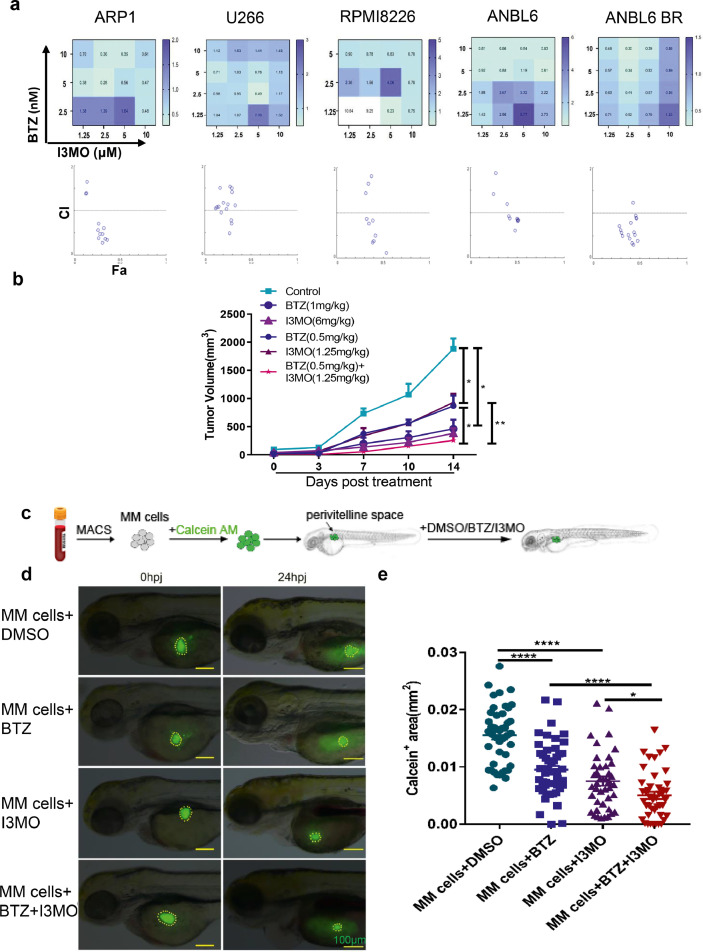
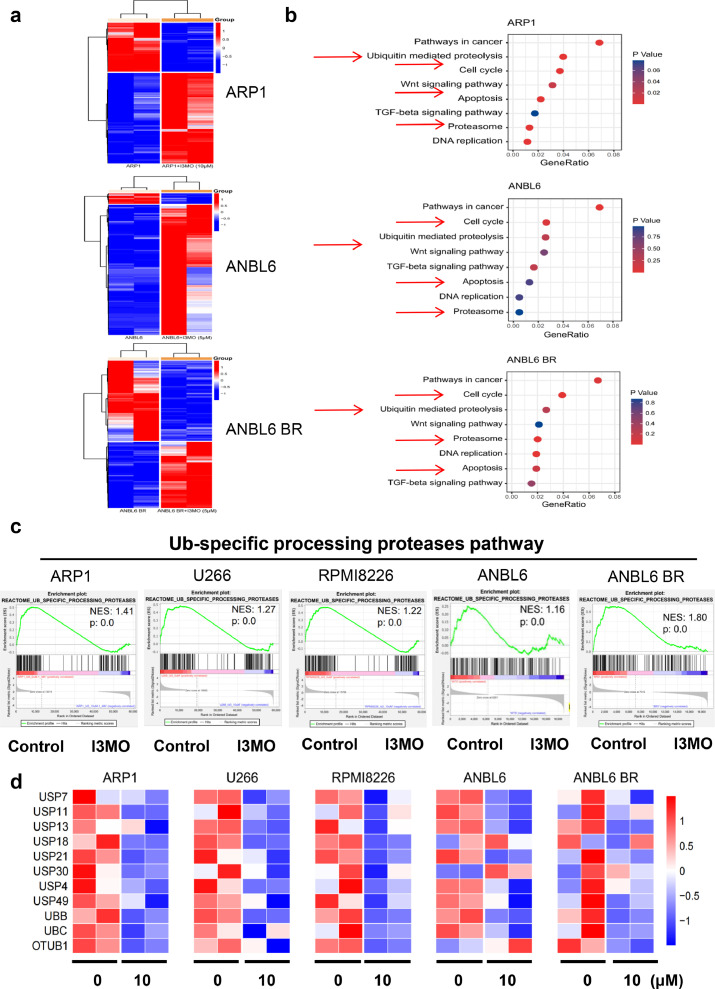
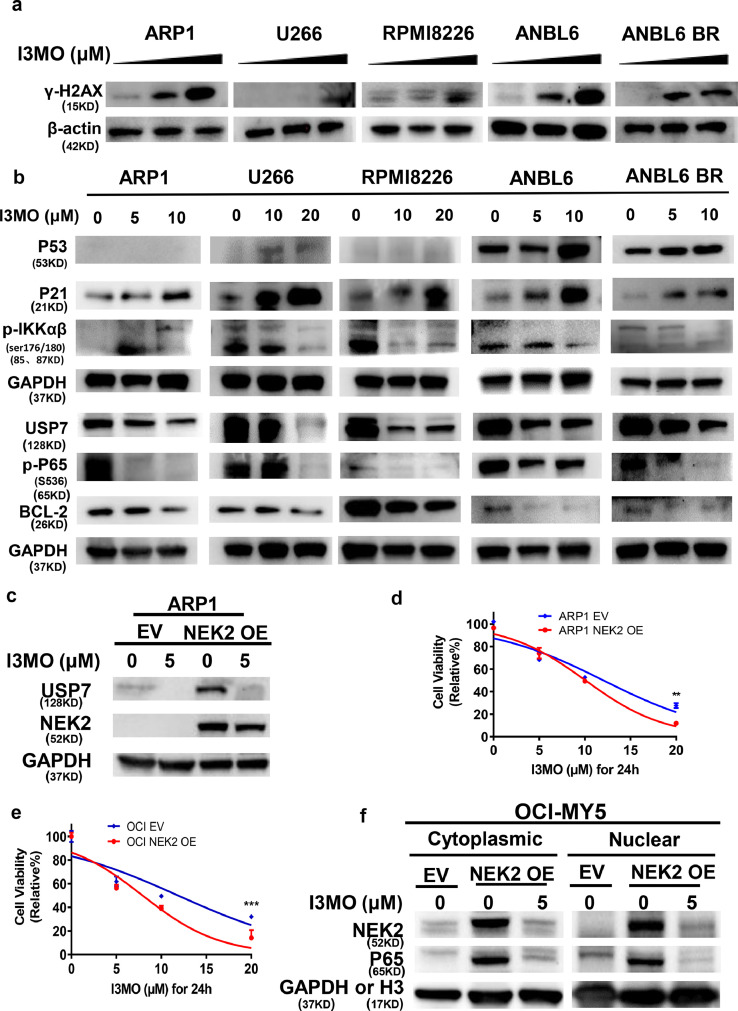
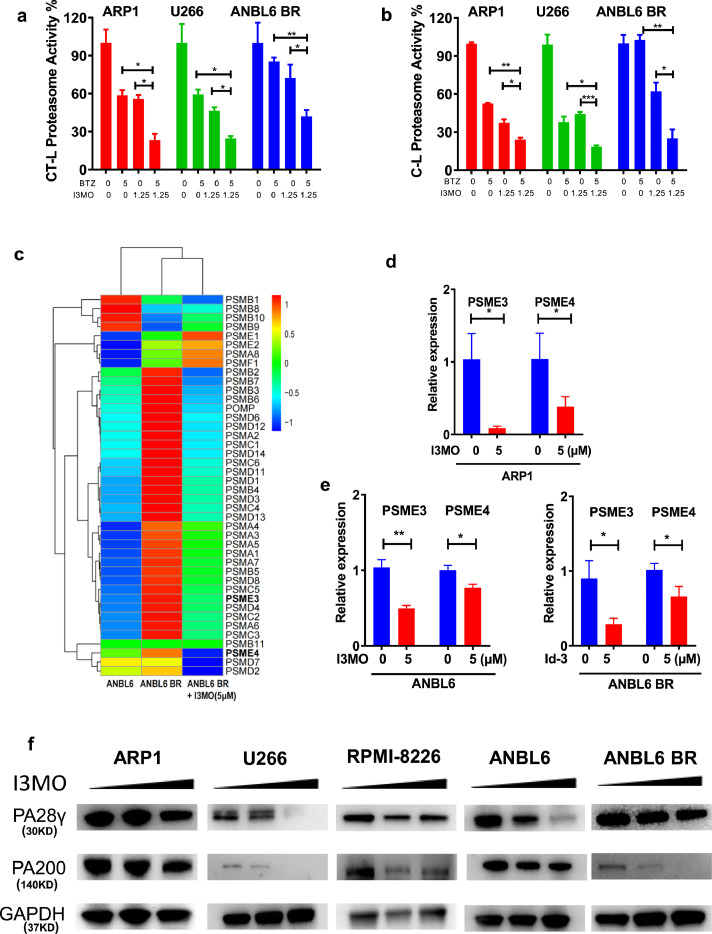
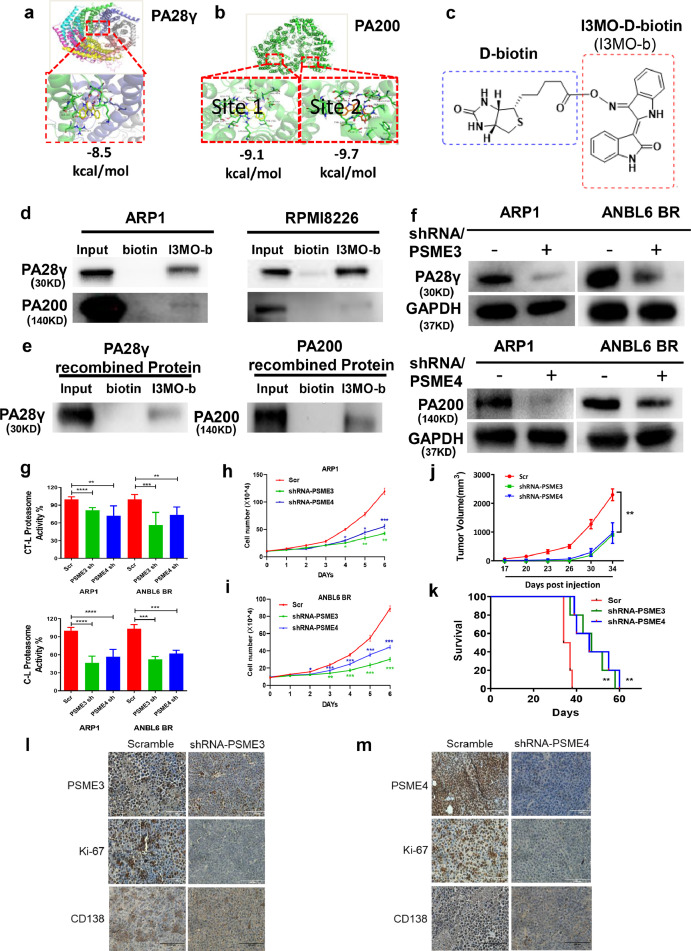
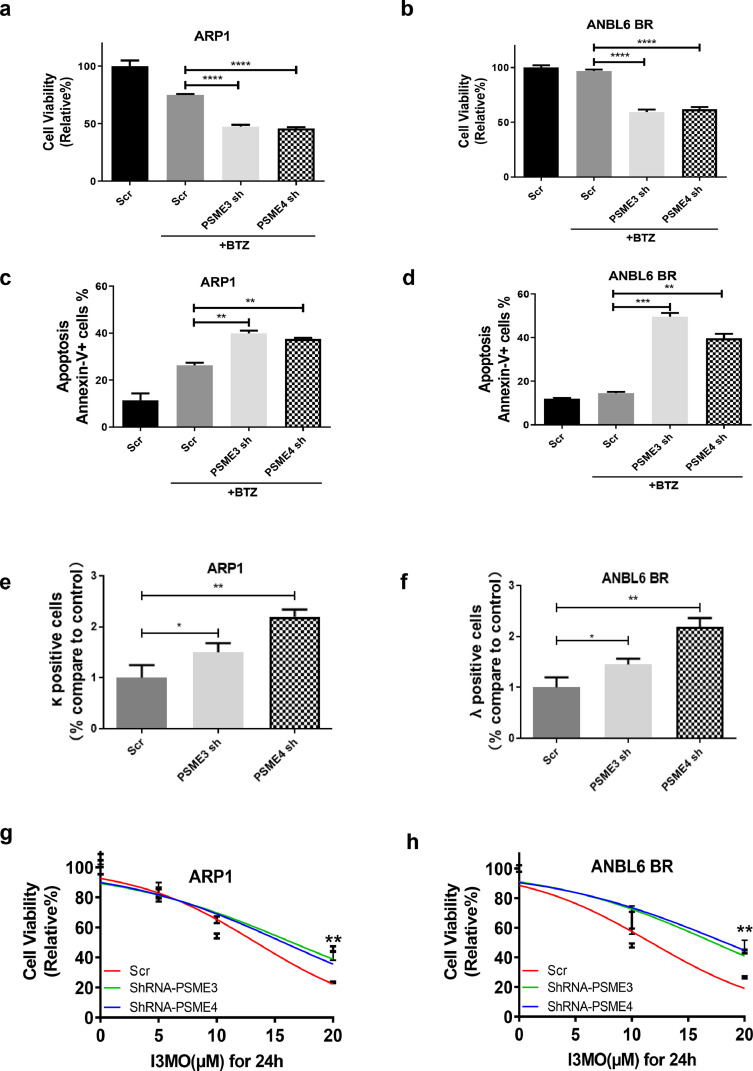
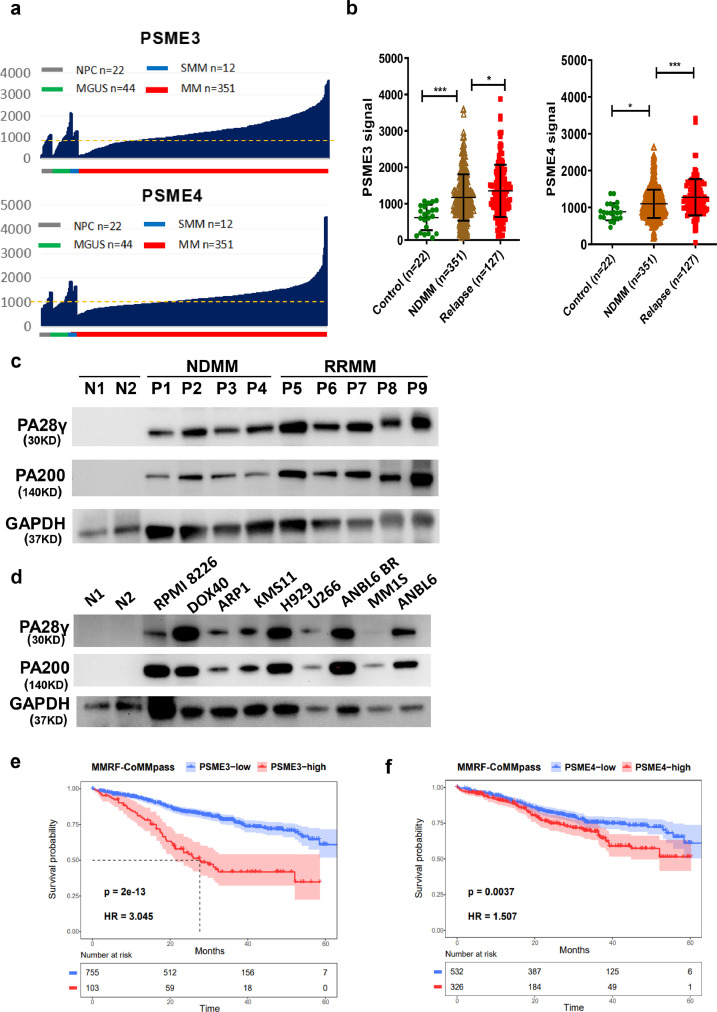
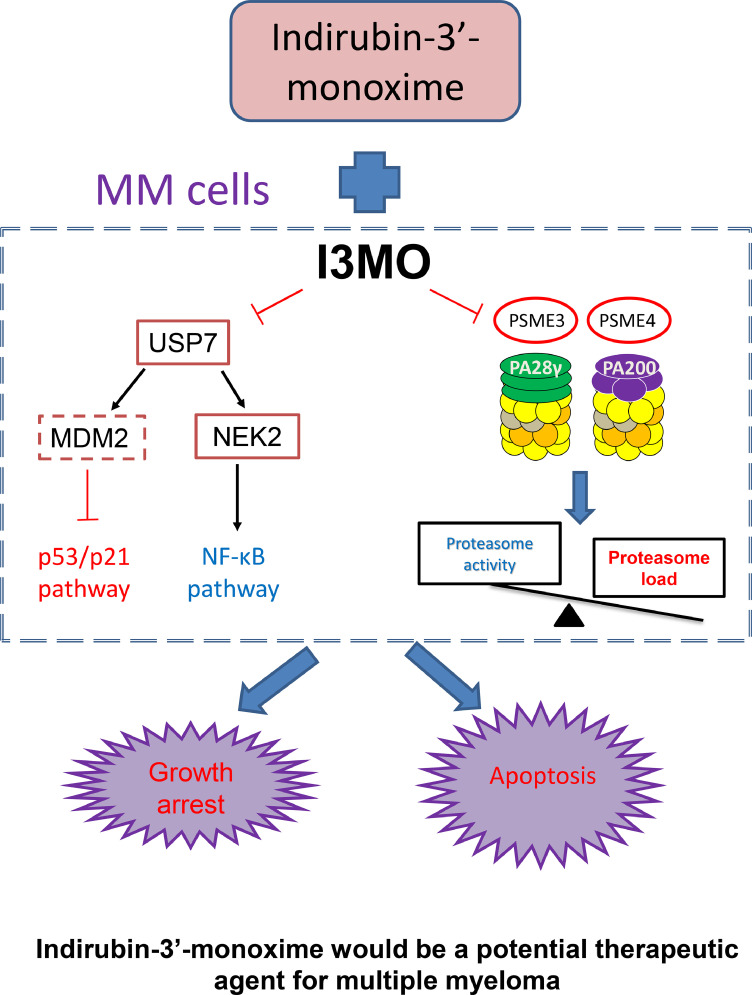
Findings: Our results demonstrated the anti-MM activity of I3MO in both drug- sensitive and -resistance MM cells. I3MO sensitizes MM cells to bortezomib-induced apoptosis. Mechanistically, I3MO acts as a multifaceted regulator of cell death, which induced DNA damage, cell cycle arrest, and abrogates NF-κB activation. I3MO efficiently down-regulated USP7 expression, promoted NEK2 degradation, and suppressed NF-κB signaling in MM. Our study reported that I3MO directly bound with and caused the down-regulation of PA28γ (PSME3), and PA200 (PSME4), the proteasome activators. Knockdown of PSME3 or PSME4 caused the inhibition of proteasome capacity and the overload of paraprotein, which sensitizes MM cells to bortezomib-mediated growth arrest. Clinical data demonstrated that PSME3 and PSME4 are over-expressed in relapsed/refractory MM (RRMM) and associated with inferior outcome.

Interpretation: Altogether, our study indicates that I3MO is agent triggering proteasome inhibition and represents a promising therapeutic strategy to improve patient outcome in MM.

Fundings: A full list of funding can be found in the acknowledgements.

Keywords: Indirubin-3’-monoxime (I3MO); Multiple myeloma; PSME3 (PA28γ); PSME4 (PA200); Proteasome inhibition.


Conflict of interest statement

Declaration of interests Dr. Kenneth. C. Anderson is the consultant: Pfizer, Amgen, Astrazeneca, Janssen, Precision Biosciences, Mana and Window. Founder/Stock Shareholder: C4 Therapeutics, Oncopep, Raqia and NextRNA. Other authors declared no competing financial interests in relation to the work described.

Figures

Fig 1
Figure 1
Cytotoxic effects of I3MO on the growth of MM cells. (a) ARP-1, U266 and RPMI8226 cells were treated with the indicated concentrations of I3MO for 96 h, followed by an assessment of cell viability by CCK-8 assays (n=3). (b) Drug-resistant MM cell lines (RPMI8226 Dox-40 and MM.1R) were treated with the indicated concentrations of I3MO for 96 h, following the cell viability detection (n=3). (c) Wild-type (ANBL6) and BTZ-resistant (ANBL6 BR) cell lines were treated with I3MO for 96 h, followed by an assessment of cell viability and the calculation of IC50. The viability experiments were performed in triplicate (P<0.001, t test). (d) Purified CD138+ cells from MM patient primary samples (n=7) were treated with the indicated concentrations of I3MO for 72 h. Cell viability was calculated by CCK-8 assays (P<0.05, t test). (e) BMNCs from newly diagnosed MM patients (NDMM) (n=9) were treated with the indicated concentrations of I3MO for 24 h, and the percentage of CD45lowCD138+ myeloma cells was determined by flow cytometry (P<0.05, t test). (f) Purified CD138+ cells from MM patients (n=7) were co-cultured with the HS-5 stromal cell line and treated with I3MO for 72 h, followed by an assessment of cell viability by CCK-8 assay (P<0.05, t test). (g) BMNCs isolated from relapsed and refractory MM patients (RRMM) were treated with BTZ or I3MO for 24 h, and the percentage of CD45lowCD138+ cells was determined by flow cytometry. Data are presented as the mean ± SEM (n=4) (P<0.0001, t test). *P < 0.05; **P < 0.01; ****P < 0.0001.
Fig 2
Figure 2
I3MO induces the apoptosis of MM cells. (a) The cell cycle was evaluated by flow cytometry in ARP1, U266, RPMI8226, ANBL6 and ANBL6 BR cells after the treatment with I3MO for 24 h (P<0.05, t test). (b) The cell apoptosis of MM cell lines (ARP-1, U266, RPMI8226 and ANBL6 BR) were detected with a 7AAD-Annexin V double staining assay (n=3) after the treatment of I3MO (P<0.05, t test). (c) Western blot was utilized to detect the level of apoptosis related proteins after I3MO treatment. The experiments were performed in triplicate. *P < 0.05; **P < 0.01; ***P < 0.001.
Fig 3
Figure 3
I3MO sensitizes MM cells to bortezomib-induced apoptosis. (a) The apoptosis of ARP1, U266, RPMI8226, ANBL6 and ANBL6 BR cells with monotherapy or combination therapy of BTZ (1.25,2.5,5,10 nM) or I3MO (1.25,2.5,5,10 µM) were detected after the treatment for 24 h by flow cytometry, respectively. Isobologram analysis shows the synergistic cytotoxic effect of BTZ and I3MO. CI value<1 indicates synergistic interactions. The experiments were performed in triplicate. (b) Xenograft mouse model of MM was utilized to detect the I3MO effects on MM cell growth. There were six treatment groups with varying dosage of I3MO and BTZ as indicated. (P<0.05, Two-way ANOVA). (c) Primary patient samples (n=5) derived xenograft model was further utilized to detect the cytotoxicity of I3MO in zebrafish. Schematic diagram of experimental design. (d) Patient-derived MM cells were labeled with Calcein-AM and implanted into the perivitelline space of each zebrafish. The survival of engrafted cells was monitored at 0 hpi and 24 hpi. Fluorescent microscopy imaging of Calcein-AM-labeled patient MM cells in zebrafish embryos treated with DMSO, BTZ, I3MO, or BTZ and I3MO, at 0 and 24hpi, respectively. Dashed lines circle the primary MM cells. (Scale bars: 100 μm.) (e) Quantification of Calcein-AM-positive (green) areas in zebrafish embryos at 24 h post-injection (5 patients/treatment) (P<0.05, t test). Data are mean ± SEM. NS, not significant; *P < 0.05; **P < 0.01; ***P < 0.001; ****P < 0.0001, unpaired t test. MACS, magnetic cell sorting; MM cells, multiple myeloma cells; hpi, hours post-injection.
Fig 4
Figure 4
I3MO is a multifaceted regulator of cell death. (a) The heatmaps showed the differentially expressed genes (DEGs) in ARP1, ANBL6 and ANBL6 BR cells treated with I3MO for 24 h. (b) KEGG pathway analyses was performed after I3MO treatment. (c) GSEA analyses was performed to analyze pathways and function annotation. (d) Heatmaps showed decreased expression of genes related to UPP pathway among five MM cells after I3MO treatment.
Figure 5
Figure 5
I3MO suppresses the growth of bortezomib-resistant cell via down-regulating USP7 expression. (a) The level of γ-H2AX was detected by western blots in ARP1, U266, RPMI8226, ANBL6 and ANBL6 BR cells which treated with I3MO (0, 5, 10 μM) for 24 h. (b) Western blots were utilized to detect the levels of p53, p21, BCL-2, p-IKKα/β (Ser176/180), p-p65-S536, USP7 and GAPDH in ARP1, U266, RPMI8226, ANBL6 and ANBL6 BR cells which treated with I3MO for 24 h. (c) The levels of USP7 and NEK2 were evaluated by western blots in ARP1 cell line with EV and NEK2-OE. (d) ARP1 cell line with EV and NEK2-OE cells were treated with I3MO for 24 h, followed by an assessment of cell viability (P<0.01, Two-way ANOVA). (e) OCI-MY5 cell line with EV and NEK2-OE cells were treated with I3MO for 24 h, followed by an assessment of cell viability (P<0.001, Two-way ANOVA). (f) OCI-MY5 cells with EV and NEK2-OE cells were treated with or without I3MO for 24 h, and cytosolic and nuclear fractionation was carried out. The levels of NEK2 and p65 were analyzed by western blots. GAPDH or Histone H3 (H3) was used as cytosolic and nuclear markers, respectively. The experiments were performed in triplicate. **P < 0.01; ***P < 0.001.
Figure 6
Figure 6
I3MO works as proteasome inhibitor via suppressing PSME3 and PSME4 expression. (a) The chymotrypsin- (CT-L) and (b) caspase-like (C-L) proteasome activity of ARP1, U266 and ANBL6 BR cells were examined after the treatment with I3MO monotherapy or combination therapy (P<0.05, t test). (c) The heatmap showed several genes of protease complex were down-regulated by I3MO induction. (d,e) ARP1, ANBL6 and ANBL6 BR (BTZ-resistant) cells were treated with or without I3MO (5 µM) for 24 h, and the mRNA levels of PSME3 and PSME4 were detected by real time-PCR (P<0.05, t test). (f) Western blots were utilized to detect the levels of PA28γ, PA200 before and after the I3MO treatment. The experiments were performed in triplicate. *P < 0.05; **P < 0.01; ***P < 0.001.
Figure 7
Figure 7
Knockdown PSME3 and PSME4 inhibited proteasome activity and MM cell growth. (a-b) The binding site and the binding model between I3MO and its target proteins, PA28γ or PA200 were examined by Auto Dock Vina analyses. (c) I3MO was labeled with D-biotin. (d-e) Cell lysates from ARP1 and RPMI8226 or PSME3 and PSME4 recombinant protein were incubated overnight with either 200 µM I3MO-D-biotin or D-biotin, I3MO bound complex was separated with streptavidin MagBeads. The pull-down protein was identified by western blots with primary antibody PA28γ, PA200. (f) Knockdown PSME3 and PSME4 in ARP1 and ANBL6 BR cells were confirmed by western blots. (g) The assays of chymotrypsin- (CT-L) and caspase-like (C-L) proteasome activity were examined in PSME3 and PSME4 knocking down MM cells (P<0.05, t test). (h,i) Cell proliferation was measured by absolute cell counting in PSME3 and PSME4 knocking down MM cells. All results were presented as means ± SEM of three independent experiments. (j) Knockdown of PSME3 or PSME4 inhibits MM cell growth was investigated in vivo. Tumor volumes were monitored every other day once the tumors could be touched (n=5/group), bars represent the means ± SEM each group (P<0.01, Two-way ANOVA). (k) The survival of mice was calculated by Kaplan-Meier analyses (P<0.01, log rank test). (l,m) The levels of PSME3, PSME4, Ki-67 and CD138 in tumors were detected by immunohistochemistry. (Scale bars: 100 μm.) The experiments were performed in triplicate. *P < 0.05; **P < 0.01; ***P < 0.001.
Figure 8
Figure 8
Knockdown PSME3 and PSME4 significantly enhances myeloma cell sensitivity to proteasome inhibitor. (a–d) The sensitivity to bortezomib treatment of MM cells with knockdown PSME3 and PSME4 was detected, including cell viability (a,b) and apoptosis (c,d) (P<0.05, t test). (e,f) Intracellular clonal light chain levels were determined in those MM cells after knockdown PSME3 and PSME4 (P<0.05, t test). (g,h) The sensitivity to I3MO treatment of MM cells with knockdown PSME3 and PSME4 was detected by CCK-8 assays (n=3) (P<0.01, log rank test). The experiments were performed in triplicate. *P < 0.05; **P < 0.01; ***P < 0.001; ****P < 0.0001.
Figure 9
Figure 9
PSME3 and PSME4 are drug-resistance genes and are associated with inferior outcomes in myeloma patients. (a)The clinical significance of PSME3 and PSME4 in the GEO datasets of MM patient data was investigated. The expression of PSME3 and PSME4 was compared in plasma cells from healthy donors (NPC, n=22), individuals with monoclonal gammopathy of undetermined significance (MGUS, n=44), individuals with smoldering multiple myeloma (SMM, n=12) and newly diagnosed MM patients (n=351) from the total therapy 2 (TT2) datasets (GSE5900 & GSE2658). (b) The levels of PSME3 and PSME4 at baseline and after relapse (GSE31161) were compared (P<0.05, t test). (c) Western blots assay was utilized to detect the protein level of PA28γ (PSME3) and PA200 (PSME4) in purified CD138+ cells from new diagnosed (NDMM) (n=4) and relapsed MM patients (RRMM) (n=5). Normal plasma cells (n=2) were utilized as control. (d) PA28γ (PSME3) and PA200 (PSME4) expression in a panel of MM cell lines with normal plasma cells as control. (e and f) Kaplan-Meier analysis was performed in MM patients with varying levels of PA28γ (PSME3) (P<0.0001, log rank test). and PA200 (PSME4) in MMRF-CoMMpass clinical trial. (P=0.0037, log rank test). *P < 0.05; ***P < 0.001.
Figure 10
Figure 10
The working model of anti-myeloma activity of I3MO.

Similar articles

Cited by

References

    1. Kumar S.K., Anderson K.C. Immune Therapies in Multiple Myeloma. Clin Cancer Res. 2016;22(22):5453–5460. - PubMed
    1. An G., Yan Y., Xu Y., et al. Monitoring the cytogenetic architecture of minimal residual plasma cells indicates therapy-induced clonal selection in multiple myeloma. Leukemia. 2020;34(2):578–588. - PubMed
    1. Wang D., Xu Q., Yuan Q., et al. Proteasome inhibition boosts autophagic degradation of ubiquitinated-AGR2 and enhances the antitumor efficiency of bevacizumab. Oncogene. 2019;38(18):3458–3474. - PMC - PubMed
    1. Hershko A. The ubiquitin system for protein degradation and some of its roles in the control of the cell division cycle. Cell Death Differ. 2005;12(9):1191–1197. - PubMed
    1. Adams J. The proteasome: structure, function, and role in the cell. Cancer Treat Rev. 2003;29:3–9. - PubMed

MeSH terms