. 2022 May;605(7909):310-314.
doi: 10.1038/s41586-022-04650-z. Epub 2022 Mar 28.

Age-dependent formation of TMEM106B amyloid filaments in human brains

Affiliations

Age-dependent formation of TMEM106B amyloid filaments in human brains

Manuel Schweighauser et al. Nature. 2022 May.

Abstract

Many age-dependent neurodegenerative diseases, such as Alzheimer's and Parkinson's, are characterized by abundant inclusions of amyloid filaments. Filamentous inclusions of the proteins tau, amyloid-β, α-synuclein and transactive response DNA-binding protein (TARDBP; also known as TDP-43) are the most common1,2. Here we used structure determination by cryogenic electron microscopy to show that residues 120-254 of the lysosomal type II transmembrane protein 106B (TMEM106B) also form amyloid filaments in human brains. We determined the structures of TMEM106B filaments from a number of brain regions of 22 individuals with abundant amyloid deposits, including those resulting from sporadic and inherited tauopathies, amyloid-β amyloidoses, synucleinopathies and TDP-43 proteinopathies, as well as from the frontal cortex of 3 individuals with normal neurology and no or only a few amyloid deposits. We observed three TMEM106B folds, with no clear relationships between folds and diseases. TMEM106B filaments correlated with the presence of a 29-kDa sarkosyl-insoluble fragment and globular cytoplasmic inclusions, as detected by an antibody specific to the carboxy-terminal region of TMEM106B. The identification of TMEM106B filaments in the brains of older, but not younger, individuals with normal neurology indicates that they form in an age-dependent manner.


Conflict of interest statement

The authors declare no competing interests.

Figures

Fig. 1
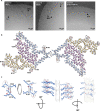
Fig. 1. Three TMEM106B protofilament folds from human brains.
a, Amino acid sequence of TMEM106B, with residues that form β-strands in folds I, IIa, IIb and III indicated with arrows. Residue 185 is either threonine or serine. bd, Cryo-EM density maps (in transparent grey) and atomic models for TMEM106B protofilament folds I (case 1, b), II (case 19, c) and III (case 17, d). Two alternative conformations of fold II (IIa and IIb) are indicated within dashed boxes. Residues 120–166 are shown in yellow; residues 167–210 in light blue and residues 211–254 in magenta.
Fig. 2
Fig. 2. Immunoblotting of TMEM106B inclusions from human brains.
a, Analysis with anti-TMEM239 antibody (residues 239–250) of sarkosyl-insoluble extracts from the frontal cortex of 16 neurologically normal individuals aged 20–101 years. Cryo-EM structures of TMEM106B filaments were determined from the frontal cortex of individuals aged 75, 84 and 101 years. b, Analysis with anti-TMEM239 antibody of sarkosyl-insoluble extracts from frontal or temporal cortex of 7 individuals with abundant filamentous amyloid deposits made of various proteins. For source images for the gels, see Supplementary Fig. 1.
Fig. 3
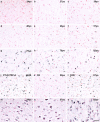
Fig. 3. Immunostaining of TMEM106B inclusions in human brain sections.
a, b, Analysis with anti-TMEM239 (residues 239–250) of frontal cortex from a 25-year-old (a) and an 84-year-old (b) individual with normal neurology. No specific staining was observed in a, but abundant globular cytoplasmic inclusions and stained brain cell processes were present in b. ce, Higher magnifications of inclusions from b. Nuclei were counterstained in red. Scale bars, 50 µm (a, b) and 20 µm (ce).
Extended Data Fig. 1
Extended Data Fig. 1. TMEM106B filament reconstructions.
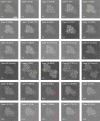
Cross-sections of TMEM106B filaments, perpendicular to the helical axis and with a projected thickness of approximately one β-rung, for all cases examined. Orange arrows point at additional densities in front of Y209; magenta arrows point at additional densities in front of K178. Scale bar, 5 nm.
Extended Data Fig. 2
Extended Data Fig. 2. Cryo-EM images and resolution estimates.
a. Cryo-EM micrographs of cases 1, 19 and 17, with insets showing representative 2D class averages of TMEM106B filaments I-s, I-d, II-s, II-d and III-s. Examples of the different types of TMEM106B filaments, as well as filaments of Aβ and MSA filaments of α-synuclein, are indicated in the micrographs with black arrows. Scale bars, 50 nm. b. Fourier shell correlation (FSC) curves for cryo-EM maps and structures of TMEM106B filaments I-s, I-d, II-s, II-d and III-s. FSC curves for two independently refined cryo-EM half maps are shown in black; for the final refined atomic model against the final cryo-EM map in red; for the atomic model refined in the first half map against that half map in blue; and for the refined atomic model in the first half map against the other half map in yellow.
Extended Data Fig. 3
Extended Data Fig. 3. Comparisons of TMEM106B folds I-III.
a Ribbon view of folds I-III aligned at residues 120–166 (centre) with close-up views for three regions (b-d). e. Cartoon views for three subsequent β-rungs for each fold, viewed from the left-hand side of the ribbon view in panel A. Fold I is shown in orange; fold IIa in blue; fold IIb in green; fold III in pink. Schematics of fold I (f), fold II (g), and fold III (h). Negatively charged residues are shown in red, positively charged residues in blue, polar residues in green, apolar residues in white, sulfur-containing residues in yellow, prolines in purple, and glycines in pink. Thick connecting lines with arrowheads indicate β-strands.
Extended Data Fig. 4
Extended Data Fig. 4. Close-up views of cryo-EM densities.
a. Cryo-EM densities (transparent grey) for N-linked glycosylation of asparagines 145, 151, 164 and 183 in fold III, showing the first, most ordered glcNac saccharide of the glycan chains. b. Density for residues 187–192 in fold I (left, orange), fold II (middle, blue) and fold III (right, pink), as viewed from the top (top panels) and the side (bottom panels). Carbonyl oxygens of P189 are indicated with black arrows. In folds I and II, P189 adopts a trans-configuration, whereas in fold III, P189 adopts a cis-conformation. c. Density for the N-terminal S120 residue, and its surrounding residues E161, H239, E241. The latter are one β-rung above (i+1) the β-rung of S120 (i) in folds I and II. In fold III, H239 and E241 are two β-rungs above (i+2) the β-rung of S120.
Extended Data Fig. 5
Extended Data Fig. 5. TMEM106B filaments comprising two protofilaments.
a. Cryo-EM micrographs with filaments comprising two protofilaments, with fold I for MSA case 18 (I-d; left), with putative fold II for MSA case 19 (II-d; middle), and with putative fold III for FTLD-TDP-C case 21 (III-d; right); α-synuclein filaments typical for MSA are also indicated (MSA). b. Cryo-EM density map and atomic model of TMEM106B filaments comprising two protofilaments of fold I. c. Three orthogional close-up views of the inter-protofilament interface.
Extended Data Fig. 6
Extended Data Fig. 6. AlphaFold prediction of TMEM106B.
a. Amino acid sequence of TMEM106B. Predicted α-helices are represented with wavy blue lines; predicted β-strands with red arrows. Residues 1–90, 91–119, 120–166, 167–210, 211–254 and 255–274 are coloured in grey, green, yellow, light blue, magenta and dark blue, respectively. b. AlphaFold prediction of TMEM106B. c. Close-up view of the AlphaFold prediction of part of the transmembrane helix (green) and the lumnal domain, with glycosylation sites N145, N151, N164, N183 and disulfide bridge C214, C253 shown as sticks. d. Hydrophobicity surface view at the interface between the lumenal domain and the transmembrane helix. Residues 119–121 are shown as sticks. e. Two orthogonal close-up views of residues close to the lysosomal membrane surface.
Extended Data Fig. 7
Extended Data Fig. 7. Immunoblot analysis of TMEM106B expressed in E. coli establishes the specificity of antibody TMEM239.
a. Diagram of the TMEM106B sequence, coloured in accordance with Fig. 1, with the immunogen of antibody TMEM239 (residues 239–250) indicated. b. Coomassie blue-stained gel and immunoblot (antibody TMEM239) of recombinant C-terminal TMEM106B fragment (WT; residues 120–274) and the immunogen-deletion construct (Δ239-250). Pellets from 1 ml cell extracts and TMEM106B purified from inclusion bodies (see Methods) were used. Red arrows indicate TMEM106B bands; red asterisks indicate non-specific binding.
Extended Data Fig. 8
Extended Data Fig. 8. TMEM106B immunohistochemistry.
Immunostaining of sections from the frontal cortex of neurologically normal individuals aged 24–82 years (yo: year-old) (a-i; m-o) and individuals with abundant filamentous amyloid deposits made of various proteins (j-l). a-l. Sections were stained with C-terminal anti-TMEM239 antibody. m-o. Sections were stained with an N-terminal anti-TMEM106B antibody (Bethyl Labs). Nuclei were counterstained in red. Scale bar, 50 µm (a-o). TMEM106B inclusions were visualised with the C-terminal antibody, while the N-terminal antibody showed only diffuse cytoplasmic staining. Previous studies also reported diffuse cytoplasmic staining with N-terminal TMEM106B antibodies,. Staining with the C-terminal antibody showed age-dependent assembly of TMEM106B, with no inclusions in the frontal cortex of young individuals (a-d, and Fig. 3a), a small number in middle-aged individuals (e, f) and abundant inclusions in older individuals (g-i and Fig. 3b–e). Inclusions of TMEM106B were also present in cases with neurodegenerative diseases who were older than 59 years. By immunoblotting with antibody TMEM239, a 29 kDa band was present in cases with inclusions.

References

    1. Goedert M. Alzheimer’s and Parkinson’s diseases: the prion concept in relation to assembled Aβ, tau and α-synuclein. Science. 2015;349:1255555. - PubMed
    1. Peng C, Trojanowski J. Q., Lee V. M.-Y. Protein transmission in neurodegenerative disease. Nat. Rev. Neurol. 2020;16:199–212. - PMC - PubMed
    1. Nicholson A, Rademakers R. What we know about TMEM106B in neurodegeneration. Acta Neuropathol. 2016;132:639–651. - PMC - PubMed
    1. Feng T, Lacrampe A, Hu F. Physiological and pathological functions of TMEM106B: a gene associated with brain aging and multiple brain disorders. Acta Neuropathol. 2021;141:327–339. - PMC - PubMed
    1. Uhlén M, et al. Tissue-based map of the human proteome. Science. 2015;347:1260419. - PubMed