. 2022 Jun 9:25:225-235.
doi: 10.1016/j.omtm.2022.03.013. Epub 2022 Mar 23.

Self-amplifying mRNA SARS-CoV-2 vaccines raise cross-reactive immune response to variants and prevent infection in animal models

Affiliations

Self-amplifying mRNA SARS-CoV-2 vaccines raise cross-reactive immune response to variants and prevent infection in animal models

Giuseppe Palladino et al. Mol Ther Methods Clin Dev. .

Abstract

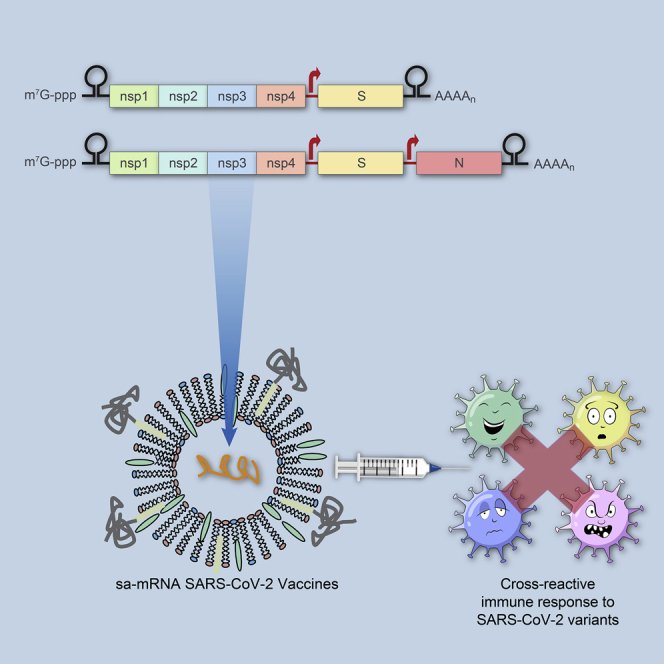
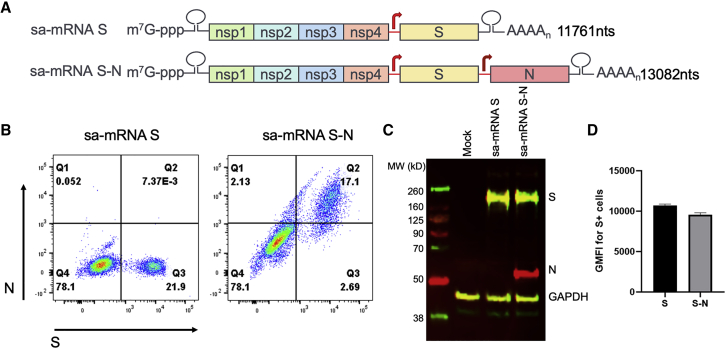
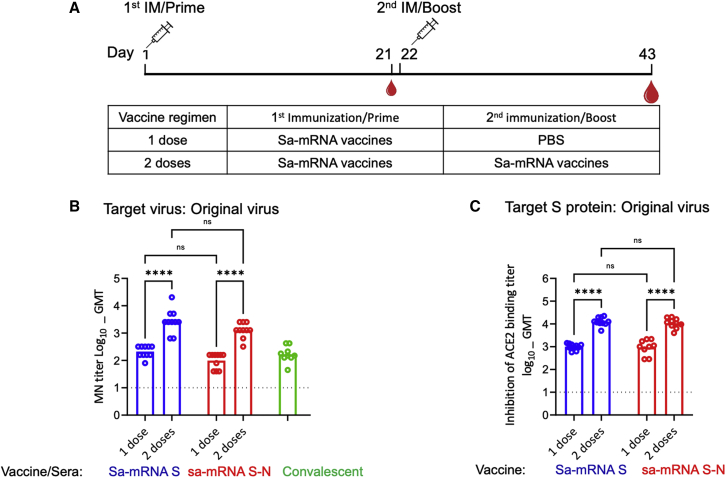
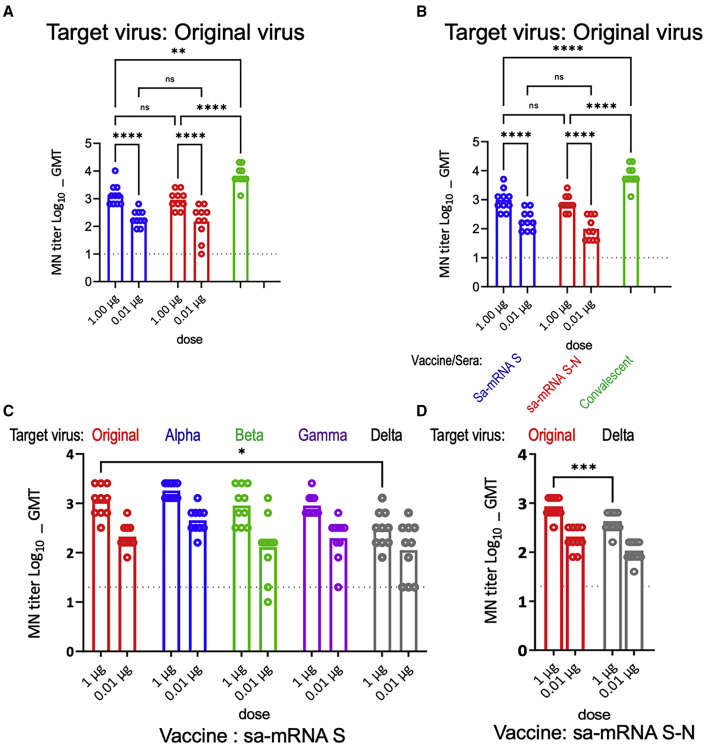
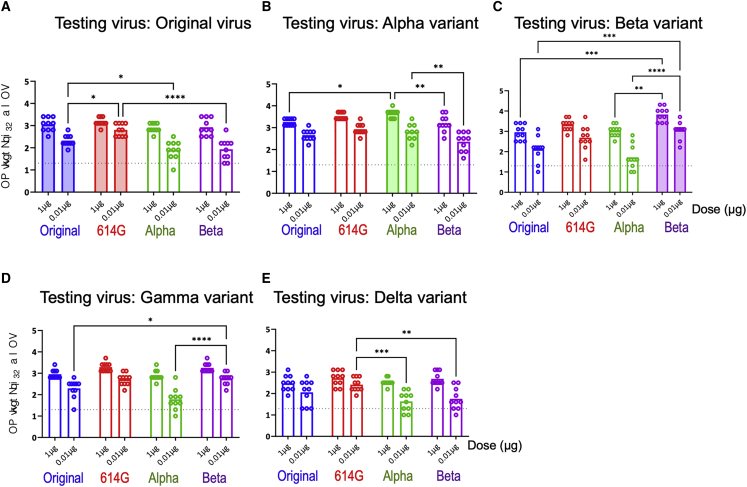
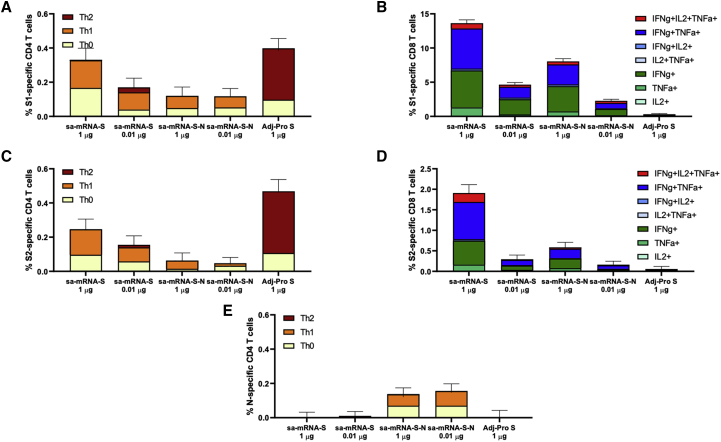
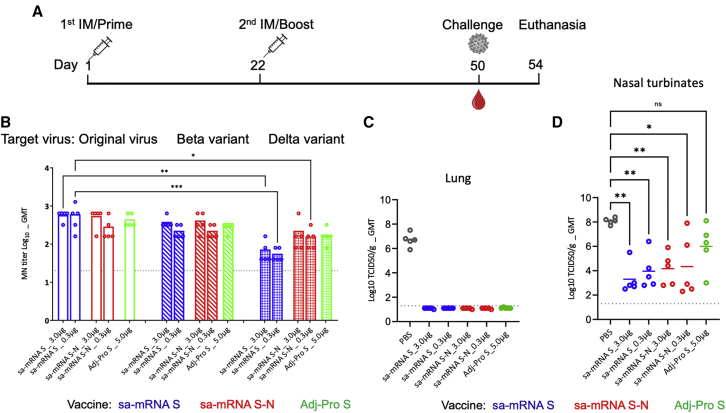
The spike (S) protein of SARS-CoV-2 plays a crucial role in cell entry, and the nucleocapsid (N) protein is highly conserved among human coronavirus homologs. For potentially broad effectiveness against both original virus and emerging variants, we developed Alphavirus-based self-amplifying mRNA (sa-mRNA) SARS-CoV-2 vaccines: an sa-mRNA S encoding a full-length S protein stabilized in a prefusion conformation and an sa-mRNA S-N co-expressing S and N proteins for the original virus. We show that these sa-mRNA SARS-CoV-2 vaccines raised potent neutralizing antibody responses in mice against not only the original virus but also the Alpha, Beta, Gamma, and Delta variants. sa-mRNA S vaccines against the Alpha and Beta variants also raised robust cross-reactive neutralizing antibody responses against their homologous viruses and heterologous variants. sa-mRNA S and sa-mRNA S-N vaccines elicited Th1-dominant, antigen-specific CD4+ T cell responses to S and N proteins and robust and broad CD8+ T cell responses to S protein. Hamsters immunized with either vaccine were fully protected from lung infection and showed significant reduction of viral load in upper respiratory tract. Our findings demonstrate that sa-mRNA SARS-CoV-2 vaccines are potent in animal models with potential to be highly effective against SARS-CoV-2 infection in humans.

Keywords: SARS-CoV-2 vaccine; cross-reactive immunogenicity; nucleocapsid protein; protection; self-amplifying mRNA; spike protein.


Conflict of interest statement

All authors are employees of Seqirus Inc., which funded this work.

Figures

None
Graphical abstract
Figure 1
Figure 1
Design and production of sa-mRNA S and sa-mRNA S-N vaccines (A) Full-length SARS-CoV-2 prefusion S and full-length N protein sequences based on the SARS-CoV-2/human/USA/WA-CDC-WA1/2020 virus (original virus) were inserted into Alphavirus-based sa-mRNA with both S and N downstream of two distinct subgenomic promoters. sa-mRNA S or sa-mRNA S-N transfected baby hamster kidney (BHK) cells were analyzed by flow cytometry for S+ or S+N+ expressing cells (B) and western blotting for expression of S and N proteins (C). (D) Flow cytometry was also used to analyze relative level of S protein expression in S+ expressing cells.
Figure 2
Figure 2
Neutralizing antibody response raised by one or two doses of sa-mRNA S and sa-mRNA S-N vaccines in BALB/c mice (A) BALB/c female mice (n = 10) were immunized once (one dose) or twice (two doses, 3 weeks apart) with 1.0 μg of sa-mRNA S (blue) or sa-mRNA S-N (red). Serum samples collected at day 43 were tested in a live virus microneutralization (MN) assay for homologous original virus (B) or an assay on inhabitation of angiotensin-converting enzyme 2 (ACE2) binding by SARS-CoV-2 S ectodomain (Secto) protein with sequences from original virus (C). Each dot represents an individual serum sample, and the column represents the geometric mean for the group. Green dots and column (B) represent MN results for the reference convalescent plasma, eight convalescent plasma samples from CSL plasma, and a pooled plasma sample from the National Institute for Biological Standards and Control. The dotted line in each panel represents the lower limit of quantitation for the assay. Statistical analysis by two-way ANOVA with Tukey’s multiple comparison test was performed using GraphPad Prism 9.1.0. ∗p < 0.05. ∗∗p < 0.01. ∗∗∗p < 0.001. ∗∗∗∗p < 0.0001. ns, not significant (p ≥ 0.05).
Figure 3
Figure 3
Cross-reactive neutralizing antibody responses raised by sa-mRNA S and sa-mRNA S-N vaccines or Adj-Pro S vaccine against original virus in BALB/C and C57BL/6J mice BALB/c or C57BL/6J female mice (n = 10 each) were immunized twice, 3 weeks apart, with 1.0 μg or 0.01 μg of sa-mRNA S (blue) or sa-mRNA S-N vaccines (red), or 1.0 μg Adj-Pro S vaccine (green). Serum samples were collected at day 43. Sera from BALB/C (A) or C57BL/6J (B) mice were tested in MN assay for the original virus. Sera from BALB/c mice raised by sa-mRNA S (C) and sa-mRNA S-N (D) were tested additionally in MN assay for the original virus (red) and the emerging Alpha (blue), Beta (green), Gamma (purple), and Delta (gray) variants. Each dot represents an individual serum sample, and the column represents the geometric mean for the group. The dotted line in each panel represents the lower limit of quantitation for the assay. Statistical analysis by two-way ANOVA with Tukey’s multiple comparison test was performed using GraphPad Prism 9.1.0. ∗p < 0.05. ∗∗p < 0.01. ∗∗∗p < 0.001. ∗∗∗∗p < 0.0001. ns, not significant (p ≥ 0.05).
Figure 4
Figure 4
Cross-reactive neutralizing antibody responses raised by sa-mRNA S vaccines against original virus, 614G, and Alpha and Beta variants in BALB/c mice BALB/c female mice (n = 10) were immunized twice, 3 weeks apart, with 1.0 μg or 0.01 μg of sa-mRNA S against the original virus (blue), 614G (red), Alpha variant (green), or Beta variant (purple). Serum samples were collected at day 43. Sera were tested in MN assay for the original virus (A), Alpha variant (B), Beta variant (C), Gamma variant (D), and Delta variant (E). Each dot represents an individual serum sample, and the column represents the geometric mean for the group. The dotted line in each panel represents the lower limit of quantitation for the assay. Statistical analysis by two-way ANOVA with Tukey’s multiple comparison test was performed using GraphPad Prism 9.1.0. ∗p < 0.05. ∗∗p < 0.01. ∗∗∗p < 0.001. ∗∗∗∗p < 0.0001. ns, not significant (p ≥ 0.05).
Figure 5
Figure 5
Antigen-specific CD4+ and CD8+ T cells raised by sa-mRNA S and sa-mRNA S-N vaccines or Adj-Pro S vaccines in BALB/c mice BALB/c female mice (n = 10) were immunized twice, 3 weeks apart, with 1.0 μg or 0.01 μg of sa-mRNA S or sa-mRNA S-N vaccines or with 1.0 μg Adj-Pro S vaccine. Spleens were collected on day 43 and pooled (five spleens/vaccine). Splenocytes were prepared, cultured in the presence or absence of antigen peptide mixtures, and analyzed by flow cytometry. The net (antigen-specific) percentage of cytokine-producing CD4+ and CD8+ T cells induced by each vaccine are shown for S1-specific CD4+ T cells (A), S1-specific CD8+ T cells (B), S2-specific CD4+ T cells (C), S2-specific CD8+ T cells (D), and N-specific CD4+ T cells (E). Contribution of various T helper subsets to the overall CD4 response was determined as follows: Th1, CD4+IFNγ+IL-5negIL-13neg; Th2, CD4+IFNγ−IL-5+/IL-13+; and Th0, CD4+IL-2+/TNFα+.
Figure 6
Figure 6
Cross-reactive neutralizing antibody response and challenge virus recovery in hamsters immunized with sa-mRNA S and sa-mRNA S-N vaccines or Adj-Pro S vaccine (A) Female Syrian hamsters (n = 5) were immunized twice, 3 weeks apart, with 3.0 μg or 0.3 μg of sa-mRNA S (blue) or the sa-mRNA S-N (red) or with 5.0 μg Adj-Pro S (green). Hamsters were challenged 4 weeks after the second dose with live SARS-CoV-2 original virus at 100 50% tissue culture infectious dose (TCID50) per animal and sacrificed 4 days later. Lungs and nasal turbinates were collected for recovery of infectious virus. (B) Serum samples collected at time of challenge were tested in MN assay for original virus, Beta, and Delta variants. Each dot represents an individual serum sample, and the column represents the geometric mean for the group. The dotted line in each panel represents the lower limit of quantitation for the assay. Total virus recovery from lung (C) and nasal turbinates (D) expressed as TCID50/g of tissue. Each dot represents an individual sample, and the line the geometric mean for the group. The dotted line in each panel represents the lower limit of quantitation for the assay. Statistical analysis by two-way ANOVA with Tukey’s multiple comparison test was performed using GraphPad Prism 9.1.0. ∗p < 0.05. ∗∗p < 0.01. ∗∗∗p < 0.001. ∗∗∗∗p < 0.0001. ns, not significant (p ≥ 0.05).

References

    1. Lu R., Zhao X., Li J., Niu P., Yang B., Wu H., Wang W., Song H., Huang B., Zhu N., et al. Genomic characterisation and epidemiology of 2019 novel coronavirus: implications for virus origins and receptor binding. Lancet. 2020;395:565–574. - PMC - PubMed
    1. Wu F., Zhao S., Yu B., Chen Y.M., Wang W., Song Z.G., Hu Y., Tao Z.W., Tian J.H., Pei Y.Y., et al. A new coronavirus associated with human respiratory disease in China. Nature. 2020;579:265–269. - PMC - PubMed
    1. Du L., He Y., Zhou Y., Liu S., Zheng B.J., Jiang S. The spike protein of SARS-CoV--a target for vaccine and therapeutic development. Nat. Rev. Microbiol. 2009;7:226–236. - PMC - PubMed
    1. Dai L., Gao G.F. Viral targets for vaccines against COVID-19. Nat. Rev. Immunol. 2021;21:73–82. - PMC - PubMed
    1. Wrapp D., Wang N., Corbett K.S., Goldsmith J.A., Hsieh C.L., Abiona O., Graham B.S., McLellan J.S. Cryo-EM structure of the 2019-nCoV spike in the prefusion conformation. Science. 2020;367:1260–1263. - PMC - PubMed