

Corticosteroid suppresses urea-cycle-related gene expressions in ornithine transcarbamylase deficiency
- PMID: 35346058
- PMCID: PMC8962007
- DOI: 10.1186/s12876-022-02213-0
Corticosteroid suppresses urea-cycle-related gene expressions in ornithine transcarbamylase deficiency
Abstract
Background: Ornithine transcarbamylase deficiency (OTCD) is most common among urea cycle disorders (UCDs), defined by defects in enzymes associated with ureagenesis. Corticosteroid administration to UCD patients, including OTCD patients, is suggested to be avoided, as it may induce life-threatening hyperammonemia. The mechanism has been considered nitrogen overload due to the catabolic effect of corticosteroids; however, the pathophysiological process is unclear.
Methods: To elucidate the mechanism of hyperammonemia induced by corticosteroid administration in OTCD patients, we analyzed a mouse model by administering corticosteroids to OTCspf-ash mice deficient in the OTC gene. Dexamethasone (DEX; 20 mg/kg) was administered to the OTCspf-ash and wild-type (WT) mice at 0 and 24 h, and the serum ammonia concentrations, the levels of the hepatic metabolites, and the gene expressions related with ammonia metabolism in the livers and muscles were analyzed.
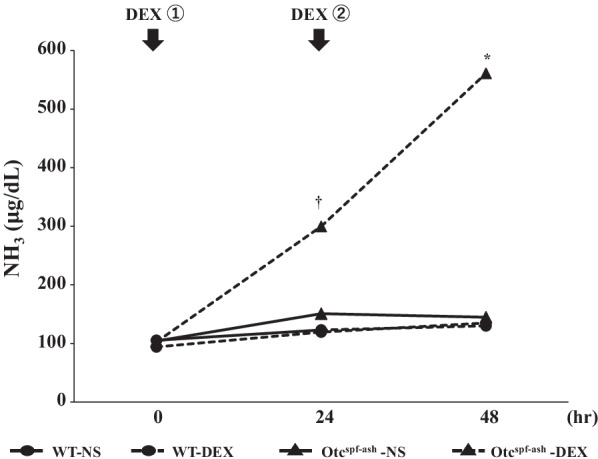
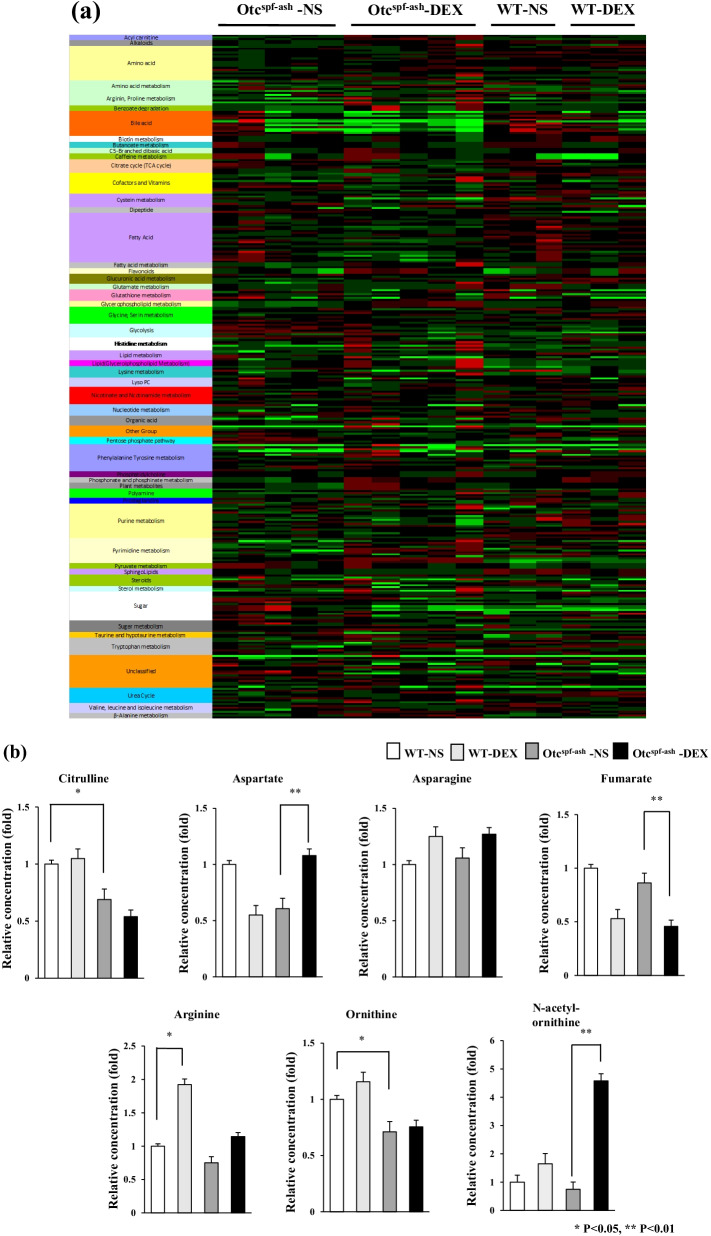
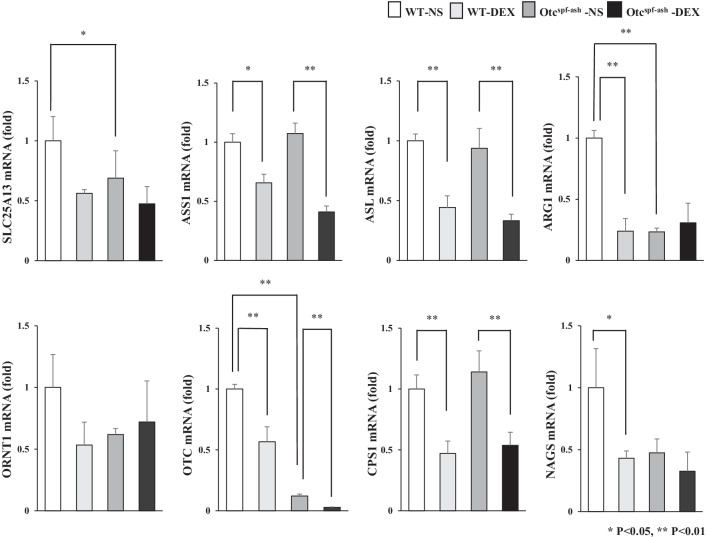
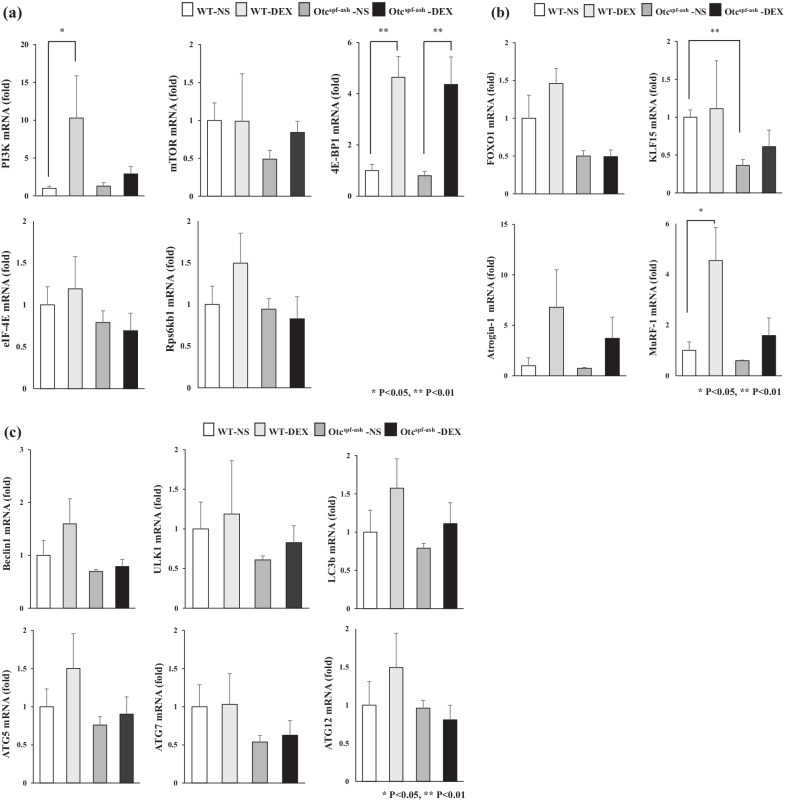
Results: The ammonia levels in Otcspf-ash mice that were administered DEX tended to increase at 24 h and increased significantly at 48 h. The metabolomic analysis showed that the levels of citrulline, arginine, and ornithine did not differ significantly between Otcspf-ash mice that were administered DEX and normal saline; however, the level of aspartate was increased drastically in Otcspf-ash mice owing to DEX administration (P < 0.01). Among the enzymes associated with the urea cycle, mRNA expressions of carbamoyl-phosphate synthase 1, ornithine transcarbamylase, arginosuccinate synthase 1, and arginosuccinate lyase in the livers were significantly downregulated by DEX administration in both the Otcspf-ash and WT mice (P < 0.01). Among the enzymes associated with catabolism, mRNA expression of Muscle RING-finger protein-1 in the muscles was significantly upregulated in the muscles of WT mice by DEX administration (P < 0.05).
Conclusions: We elucidated that corticosteroid administration induced hyperammonemia in Otcspf-ash mice by not only muscle catabolism but also suppressing urea-cycle-related gene expressions. Since the urea cycle intermediate amino acids, such as arginine, might not be effective because of the suppressed expression of urea-cycle-related genes by corticosteroid administration, we should consider an early intervention by renal replacement therapy in cases of UCD patients induced by corticosteroids to avoid brain injuries or fatal outcomes.
Keywords: Corticosteroid; Hyperammonemia; Late-onset ornithine transcarbamylase deficiency; Ornithine transcarbamylase deficiency; Urea cycle disorder.
© 2022. The Author(s).
Conflict of interest statement
The authors declare that they have no competing interests.
Figures
Similar articles
-
Acute metabolic decompensation due to influenza in a mouse model of ornithine transcarbamylase deficiency.Dis Model Mech. 2014 Feb;7(2):205-13. doi: 10.1242/dmm.013003. Epub 2013 Nov 21. Dis Model Mech. 2014. PMID: 24271778 Free PMC article.
-
Comprehensive characterization of ureagenesis in the spfash mouse, a model of human ornithine transcarbamylase deficiency, reveals age-dependency of ammonia detoxification.J Inherit Metab Dis. 2019 Nov;42(6):1064-1076. doi: 10.1002/jimd.12068. Epub 2019 Mar 13. J Inherit Metab Dis. 2019. PMID: 30714172 Review.
-
Ornithine restores ureagenesis capacity and mitigates hyperammonemia in Otc(spf-ash) mice.J Nutr. 2006 Jul;136(7):1834-8. doi: 10.1093/jn/136.7.1834. J Nutr. 2006. PMID: 16772445
-
Interaction between murine spf-ash mutation and genetic background yields different metabolic phenotypes.Am J Physiol Endocrinol Metab. 2007 Dec;293(6):E1764-71. doi: 10.1152/ajpendo.00525.2007. Epub 2007 Oct 9. Am J Physiol Endocrinol Metab. 2007. PMID: 17925451
-
Genotype-Phenotype Correlations in Ornithine Transcarbamylase Deficiency: A Mutation Update.J Genet Genomics. 2015 May 20;42(5):181-94. doi: 10.1016/j.jgg.2015.04.003. Epub 2015 May 19. J Genet Genomics. 2015. PMID: 26059767 Free PMC article. Review.
Cited by
-
Corticosteroid-induced hyperammonaemic encephalopathy in a woman with late-onset ornithine transcarbamylase deficiency.BMJ Case Rep. 2024 May 2;17(5):e255793. doi: 10.1136/bcr-2023-255793. BMJ Case Rep. 2024. PMID: 38697679
-
Late-Onset Ornithine Transcarbamylase Deficiency Complicated with Extremely High Serum Ammonia Level: Prompt Induction of Hemodialysis as the Key to Successful Treatment.Am J Case Rep. 2022 Nov 15;23:e937658. doi: 10.12659/AJCR.937658. Am J Case Rep. 2022. PMID: 36377209 Free PMC article.
-
Diagnostic and Management Issues in Patients with Late-Onset Ornithine Transcarbamylase Deficiency.Children (Basel). 2023 Aug 9;10(8):1368. doi: 10.3390/children10081368. Children (Basel). 2023. PMID: 37628367 Free PMC article. Review.
-
ASL mRNA-LNP Therapeutic for the Treatment of Argininosuccinic Aciduria Enables Survival Benefit in a Mouse Model.Biomedicines. 2023 Jun 16;11(6):1735. doi: 10.3390/biomedicines11061735. Biomedicines. 2023. PMID: 37371829 Free PMC article.
-
Carbamoyl phosphate synthetase 1 deficiency manifested in an adult treated with prednisone for polymyositis, and cured by live-donor liver transplantation.Mol Genet Metab Rep. 2025 Mar 5;43:101200. doi: 10.1016/j.ymgmr.2025.101200. eCollection 2025 Jun. Mol Genet Metab Rep. 2025. PMID: 40125546 Free PMC article.
References
MeSH terms
Substances
Grants and funding
LinkOut - more resources
Full Text Sources
Medical
Research Materials
Miscellaneous
