. 2022 Mar 29;14(1):33.
doi: 10.1186/s13073-022-01034-w.

An 8-gene machine learning model improves clinical prediction of severe dengue progression

Affiliations

An 8-gene machine learning model improves clinical prediction of severe dengue progression

Yiran E Liu et al. Genome Med. .

Abstract

Background: Each year 3-6 million people develop life-threatening severe dengue (SD). Clinical warning signs for SD manifest late in the disease course and are nonspecific, leading to missed cases and excess hospital burden. Better SD prognostics are urgently needed.

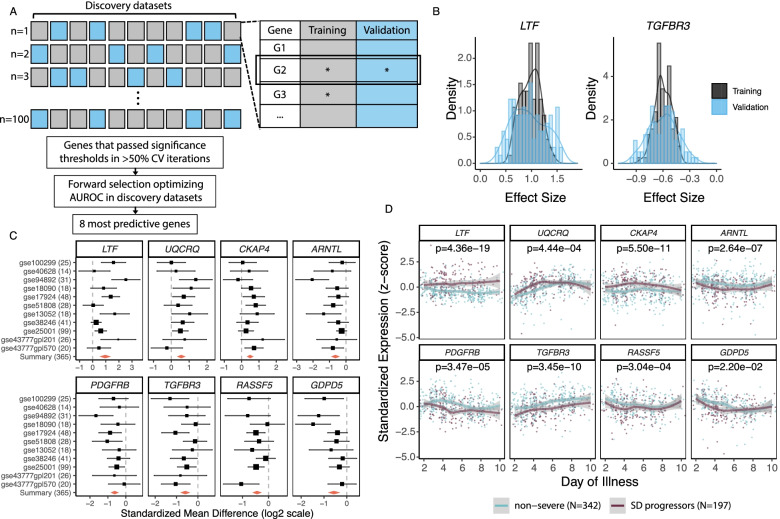
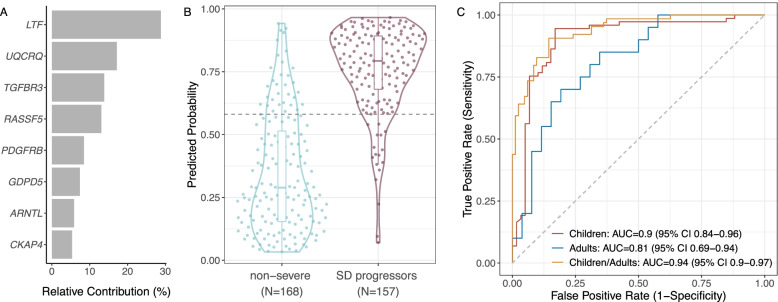
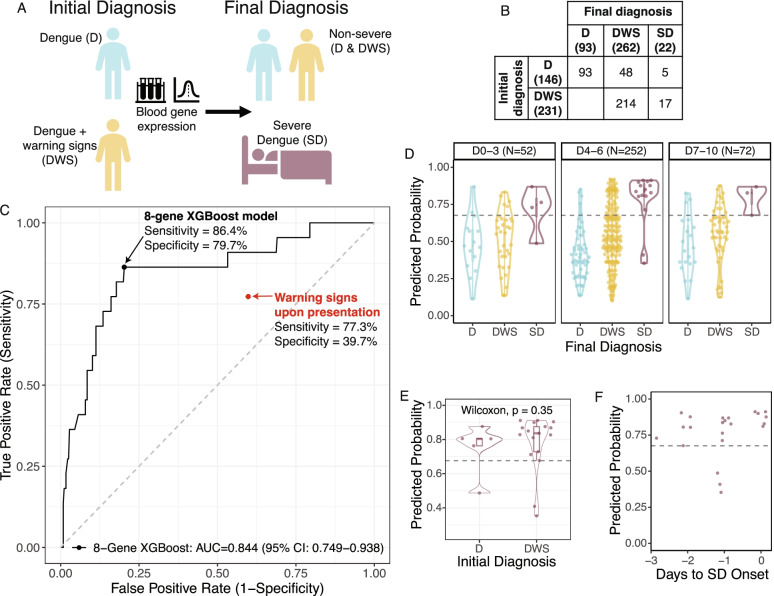
Methods: We integrated 11 public datasets profiling the blood transcriptome of 365 dengue patients of all ages and from seven countries, encompassing biological, clinical, and technical heterogeneity. We performed an iterative multi-cohort analysis to identify differentially expressed genes (DEGs) between non-severe patients and SD progressors. Using only these DEGs, we trained an XGBoost machine learning model on public data to predict progression to SD. All model parameters were "locked" prior to validation in an independent, prospectively enrolled cohort of 377 dengue patients in Colombia. We measured expression of the DEGs in whole blood samples collected upon presentation, prior to SD progression. We then compared the accuracy of the locked XGBoost model and clinical warning signs in predicting SD.

Results: We identified eight SD-associated DEGs in the public datasets and built an 8-gene XGBoost model that accurately predicted SD progression in the independent validation cohort with 86.4% (95% CI 68.2-100) sensitivity and 79.7% (95% CI 75.5-83.9) specificity. Given the 5.8% proportion of SD cases in this cohort, the 8-gene model had a positive and negative predictive value (PPV and NPV) of 20.9% (95% CI 16.7-25.6) and 99.0% (95% CI 97.7-100.0), respectively. Compared to clinical warning signs at presentation, which had 77.3% (95% CI 58.3-94.1) sensitivity and 39.7% (95% CI 34.7-44.9) specificity, the 8-gene model led to an 80% reduction in the number needed to predict (NNP) from 25.4 to 5.0. Importantly, the 8-gene model accurately predicted subsequent SD in the first three days post-fever onset and up to three days prior to SD progression.

Conclusions: The 8-gene XGBoost model, trained on heterogeneous public datasets, accurately predicted progression to SD in a large, independent, prospective cohort, including during the early febrile stage when SD prediction remains clinically difficult. The model has potential to be translated to a point-of-care prognostic assay to reduce dengue morbidity and mortality without overwhelming limited healthcare resources.

Keywords: Biomarkers; Dengue; Gene signature; Host response; Machine learning; Prognostic; Severe dengue.


Conflict of interest statement

BAP reports Scientific Advisory Board membership for Globavir, outside the submitted work; in addition, BAP has a patent US 9725774 B2 licensed to Globavir. PK reports personal fees from Inflammatix, Inc., Cepheid, Inc., Vir Biotechnology, and Genentech, outside the submitted work. The 8-gene set has been disclosed for possible patent protection to the Stanford Office of Technology and Licensing by YEL, SE, and PK. The remaining authors declare that they have no competing interests.

Figures

Fig. 1
Fig. 1
Multi-cohort analysis identifies eight genes robustly associated with progression to SD. A Schematic of multi-cohort analysis method with Monte Carlo sampling at the dataset level. In each of 100 cross-validation (CV) iterations, we randomly selected seven datasets for “training” (gray), identified differentially expressed genes (DEGs) using MetaIntegrator, and examined them in the remaining four “validation” (blue) datasets. DEGs that passed significance thresholds (as denoted by asterisks) in both training and validation were considered significant for that iteration. We then did a greedy forward search on DEGs significant in greater than 50% of all iterations and identified the eight most predictive DEGs. B Representative plots of the distribution of effect size (log2) in training (gray) and validation (blue) across the 100 iterations for over-expressed (LTF) and under-expressed (TGFBR3) genes that passed significance thresholds in >50% of iterations. Regardless of the combination of datasets in training or validation, the distribution of effect sizes for all 25 genes did not contain 0. C Forest plot of the effect size of the eight genes in each discovery dataset. Two genes (RASSF5 and GDPD5) were not measured in every dataset. The black lines indicate the 95% confidence interval (CI) of the effect size for a given gene in a given dataset, and the size of the black box is proportional to the sample size of each dataset. The summary effect size of each gene across all datasets is indicated by the red diamond; the width of the diamond indicates the 95% CI. D Standardized expression of each of the eight genes over the disease course (days post-symptom onset) in patients who remained non-severe (blue) or progressed to SD (purple). Seven discovery datasets that reported day of sample collection were included in longitudinal analysis. Lines represent the local regression (LOESS) curve fit for non-severe patients and SD progressors. Gray bands represent the 95% CI
Fig. 2
Fig. 2
The 8-gene XGBoost-based model predicts progression to SD in public datasets. A Relative contribution of each of the eight genes to the XGBoost model. B Violin plot of predicted probabilities of progression to SD for samples across all public datasets. The dotted horizontal line indicates the Youden optimal threshold for the public datasets. C ROC curves of the 8-gene model predictions for distinguishing non-severe patients from SD progressors in datasets profiling children (red), adults (blue), or both children and adults (orange). The DeLong test p-value for children vs. adults is 0.205
Fig. 3
Fig. 3
The locked 8-gene XGBoost model predicts progression to SD in an independent prospective dengue cohort. A Description of independent Colombia cohort. Blood samples were collected upon presentation from dengue patients presenting with or without warning signs. B Confusion matrix depicting the number of patients with an initial diagnosis of D or DWS upon presentation and final diagnosis of D, DWS, or SD. C ROC curve of the locked 8-gene XGBoost model in predicting progression to SD in the independent cohort. The black point indicates the sensitivity and specificity of the 8-gene model at the Youden threshold in the independent cohort. The red point indicates the sensitivity and specificity of clinical warning signs in predicting progression to SD in the independent cohort. D 8-gene model predictions on samples collected throughout the disease course, on days 0–3, 4–6, or 7–10 post-fever onset. E Violin plot of the predicted probabilities of progression to SD for SD progressors in the independent cohort who initially presented with or without warning signs. F Predicted probabilities using the 8-gene model for the 22 patients in the independent Colombia cohort who progressed to SD, by days from sample collection to the appearance of severe manifestations (“Days to SD Onset”). “0” indicates patients whose sample was collected on the day of—but at least several hours prior to—the appearance of SD manifestations. The dotted horizontal line indicates the Youden threshold in the Colombia cohort

References

    1. WHO. Dengue and severe dengue. Geneva: World Health Organization; 2020. Available from: https://www.who.int/news-room/fact-sheets/detail/dengue-and-severe-dengue. Accessed 10 Dec 2020.
    1. Xin Tian C, Baharuddin KA, Shaik Farid AW, Andey R, Ridzuan MI, Siti-Azrin AH. Ultrasound findings of plasma leakage as imaging adjunct in clinical management of dengue fever without warning signs. Med J Malaysia. 2020;75(6):635–641. - PubMed
    1. Rafi A, Mousumi AN, Ahmed R, Chowdhury RH, Wadood A, Hossain G. Dengue epidemic in a non-endemic zone of Bangladesh: Clinical and laboratory profiles of patients. PLoS Negl Trop Dis. 2020;14(10):e0008567. doi: 10.1371/journal.pntd.0008567. - DOI - PMC - PubMed
    1. Shepard DS, Undurraga EA, Halasa YA, Stanaway JD. The global economic burden of dengue: a systematic analysis. Lancet Infect Dis. 2016;16(8):935–941. doi: 10.1016/S1473-3099(16)00146-8. - DOI - PubMed
    1. Stanaway JD, Shepard DS, Undurraga EA, Halasa YA, Coffeng LE, Brady OJ, et al. The global burden of dengue: an analysis from the Global Burden of Disease Study 2013. Lancet Infect Dis. 2016;16(6):712–723. doi: 10.1016/S1473-3099(16)00026-8. - DOI - PMC - PubMed

Publication types

LinkOut - more resources