Meta-Analysis
. 2022 Mar 29:11:e75374.
doi: 10.7554/eLife.75374.

Assessing the causal role of epigenetic clocks in the development of multiple cancers: a Mendelian randomization study

Collaborators, Affiliations
Meta-Analysis

Assessing the causal role of epigenetic clocks in the development of multiple cancers: a Mendelian randomization study

Fernanda Morales Berstein et al. Elife. .

Abstract

Background: Epigenetic clocks have been associated with cancer risk in several observational studies. Nevertheless, it is unclear whether they play a causal role in cancer risk or if they act as a non-causal biomarker.

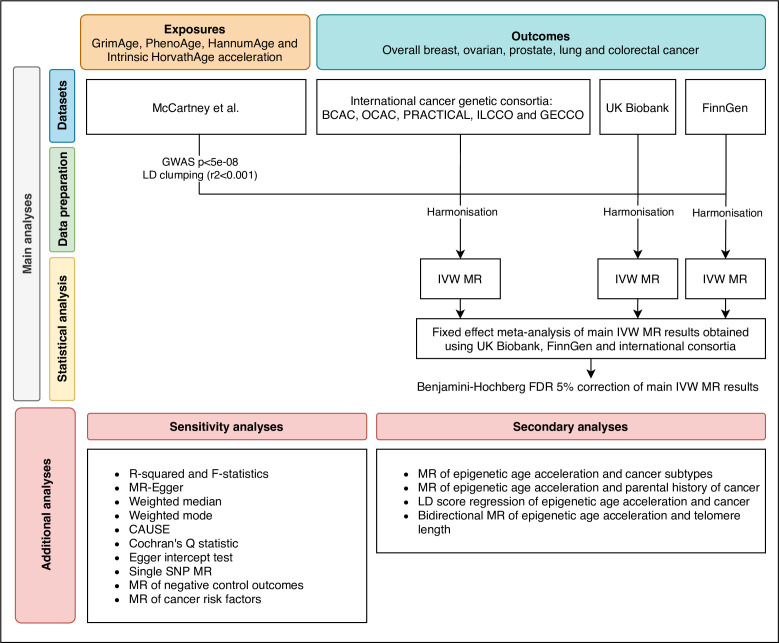
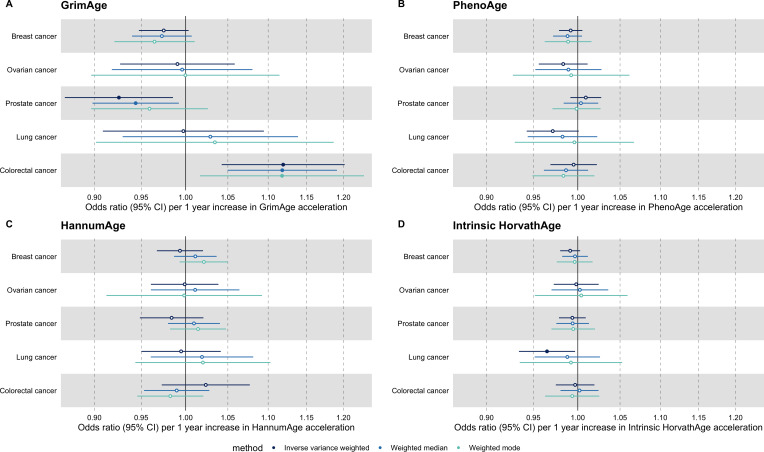
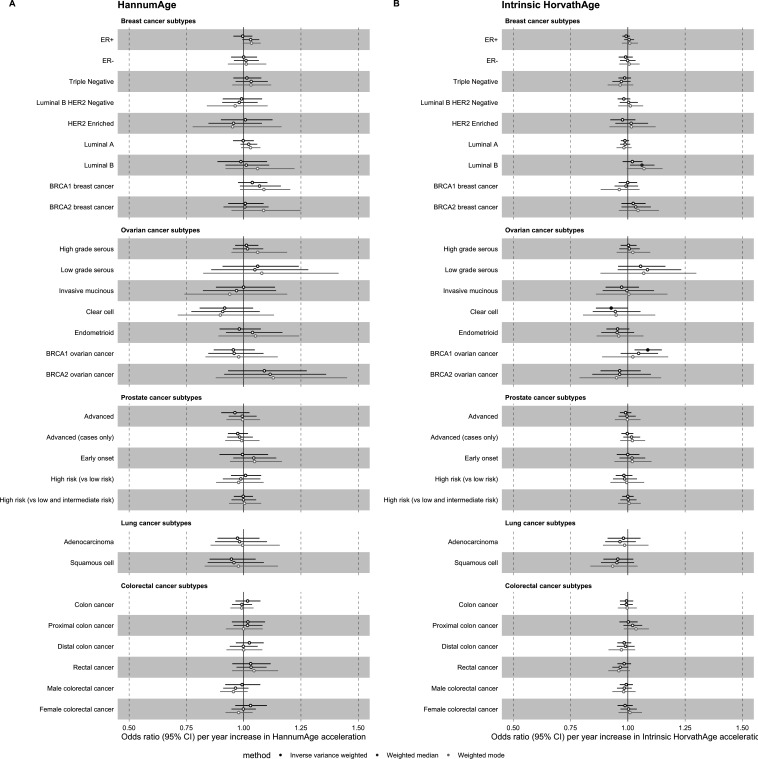
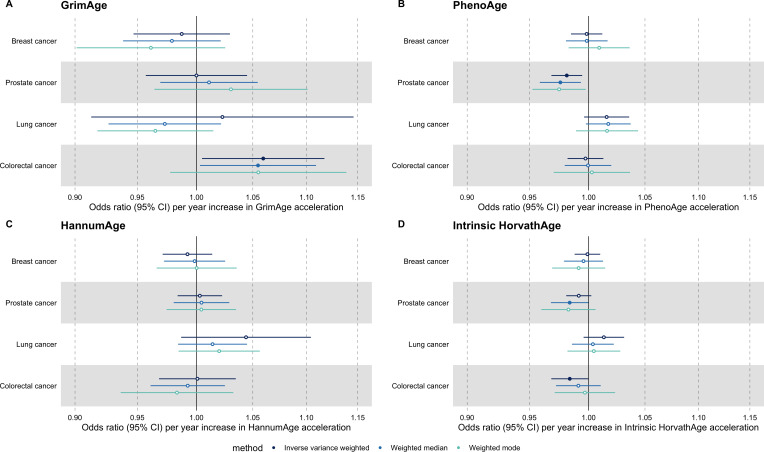
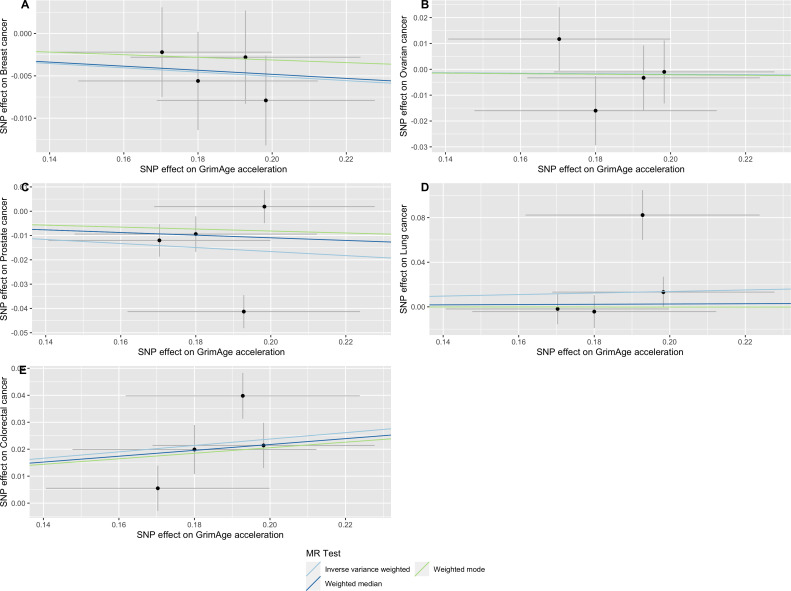
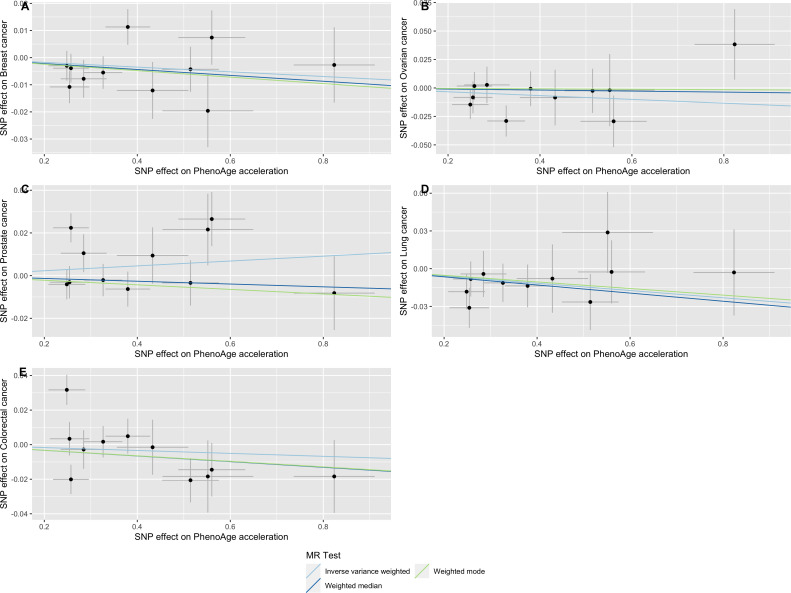
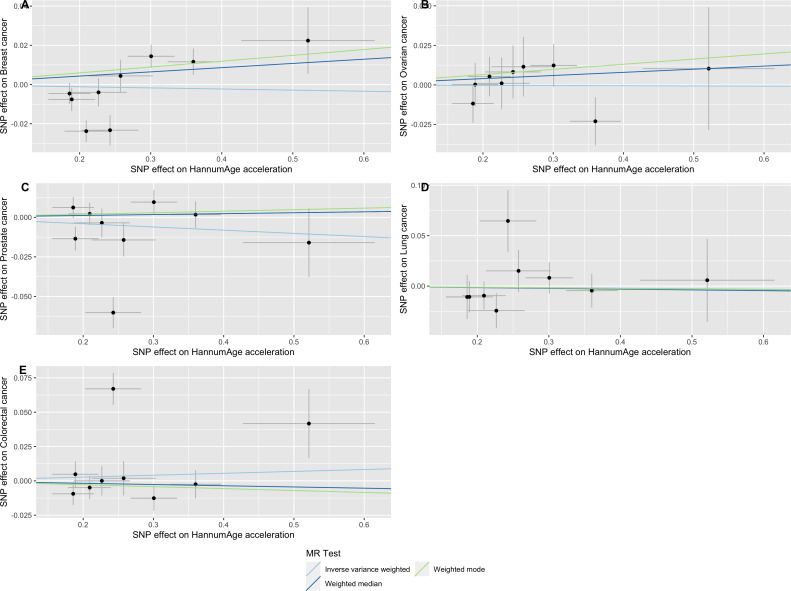
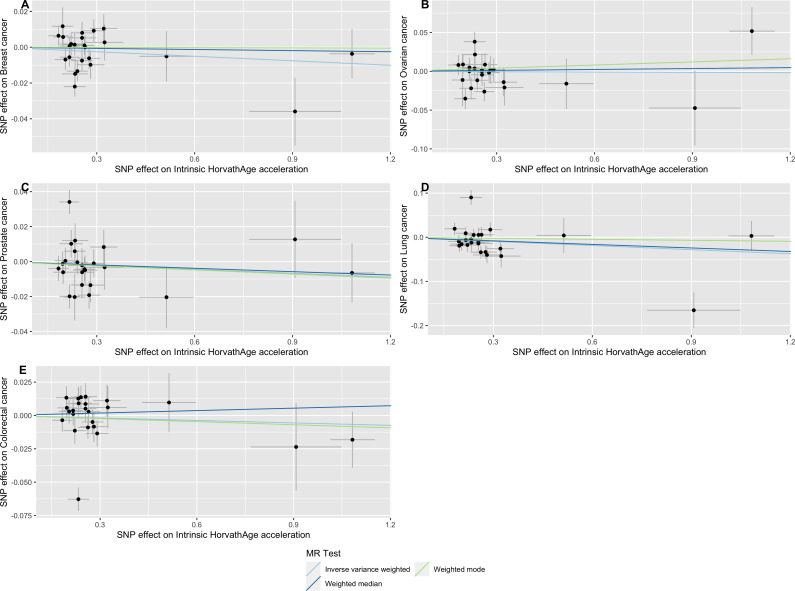
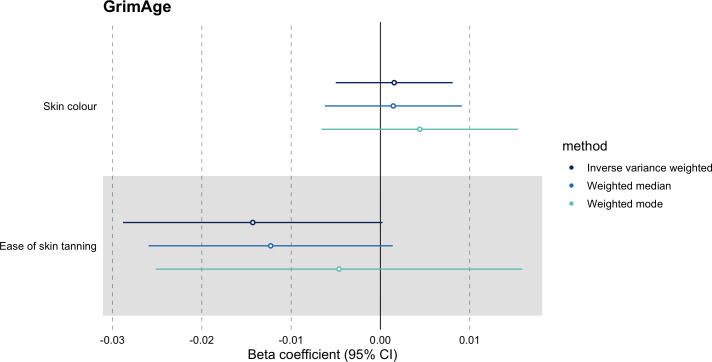
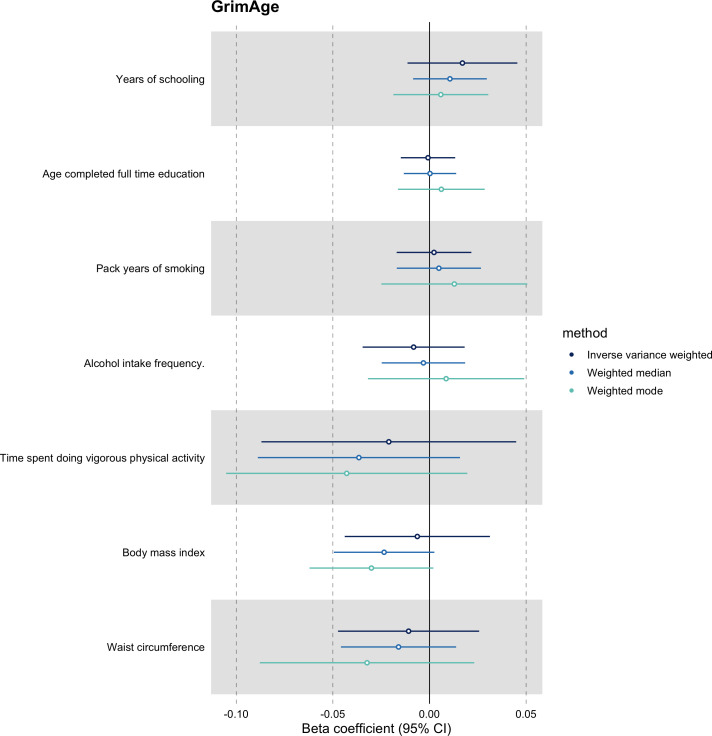
Methods: We conducted a two-sample Mendelian randomization (MR) study to examine the genetically predicted effects of epigenetic age acceleration as measured by HannumAge (nine single-nucleotide polymorphisms (SNPs)), Horvath Intrinsic Age (24 SNPs), PhenoAge (11 SNPs), and GrimAge (4 SNPs) on multiple cancers (i.e. breast, prostate, colorectal, ovarian and lung cancer). We obtained genome-wide association data for biological ageing from a meta-analysis (N = 34,710), and for cancer from the UK Biobank (N cases = 2671-13,879; N controls = 173,493-372,016), FinnGen (N cases = 719-8401; N controls = 74,685-174,006) and several international cancer genetic consortia (N cases = 11,348-122,977; N controls = 15,861-105,974). Main analyses were performed using multiplicative random effects inverse variance weighted (IVW) MR. Individual study estimates were pooled using fixed effect meta-analysis. Sensitivity analyses included MR-Egger, weighted median, weighted mode and Causal Analysis using Summary Effect Estimates (CAUSE) methods, which are robust to some of the assumptions of the IVW approach.

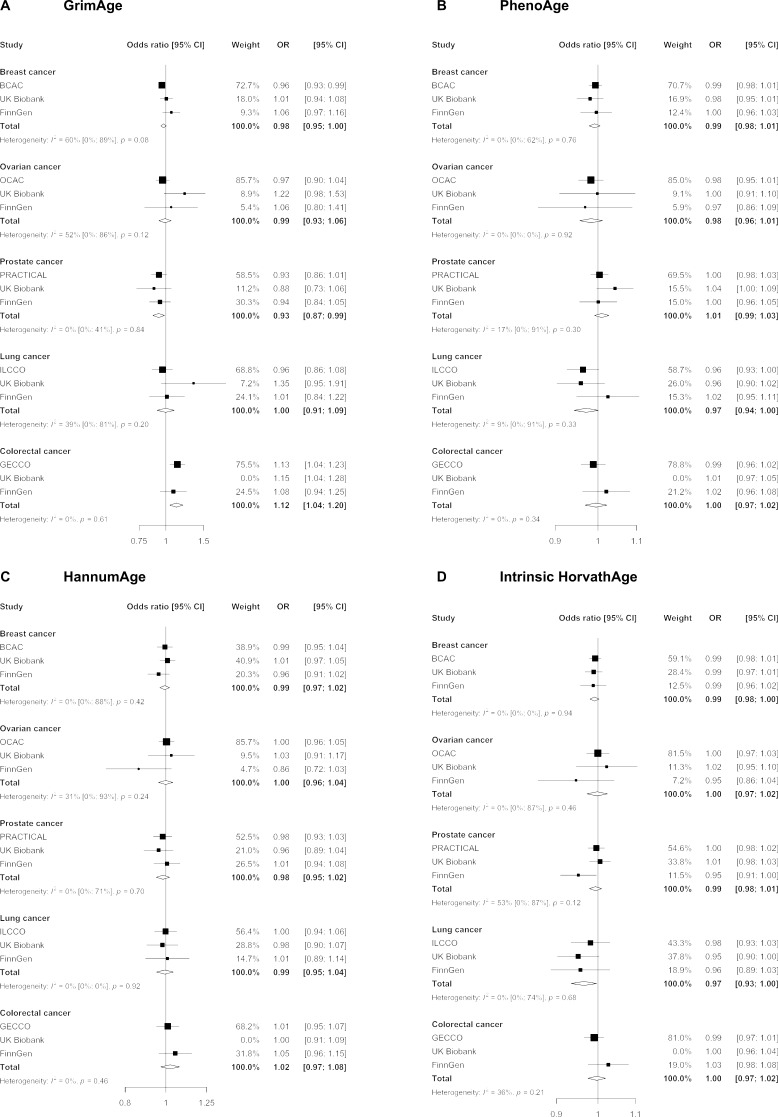
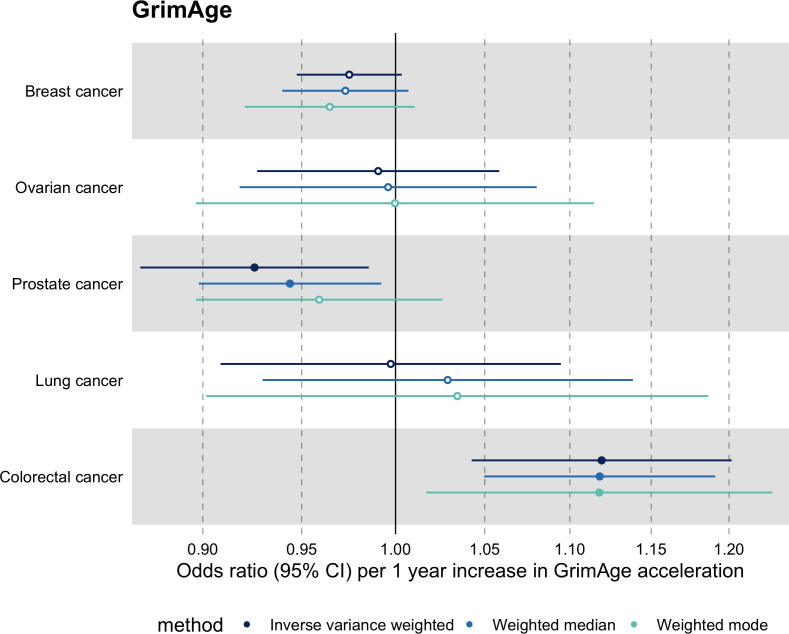
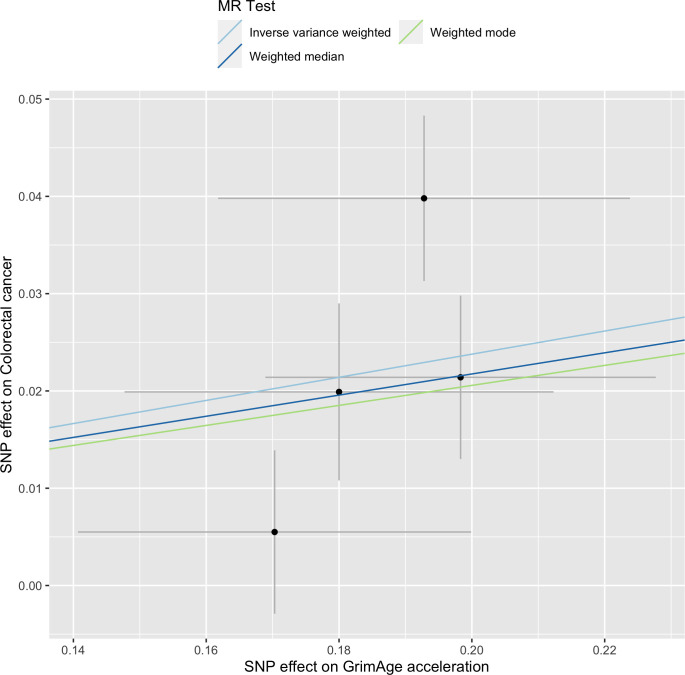
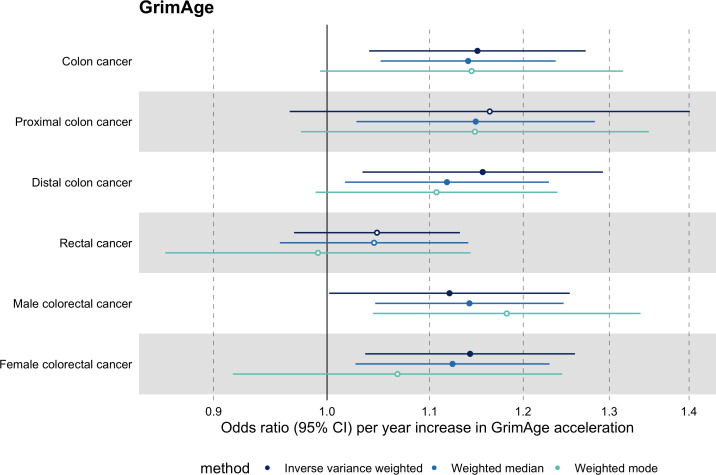
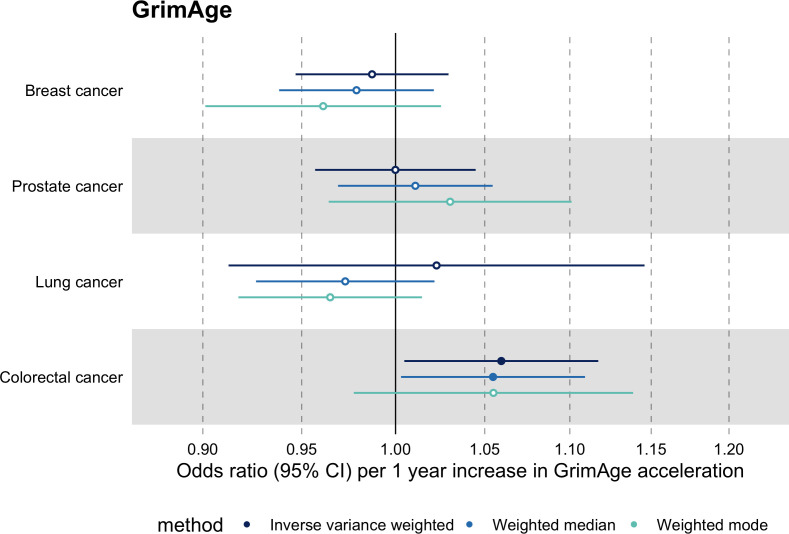
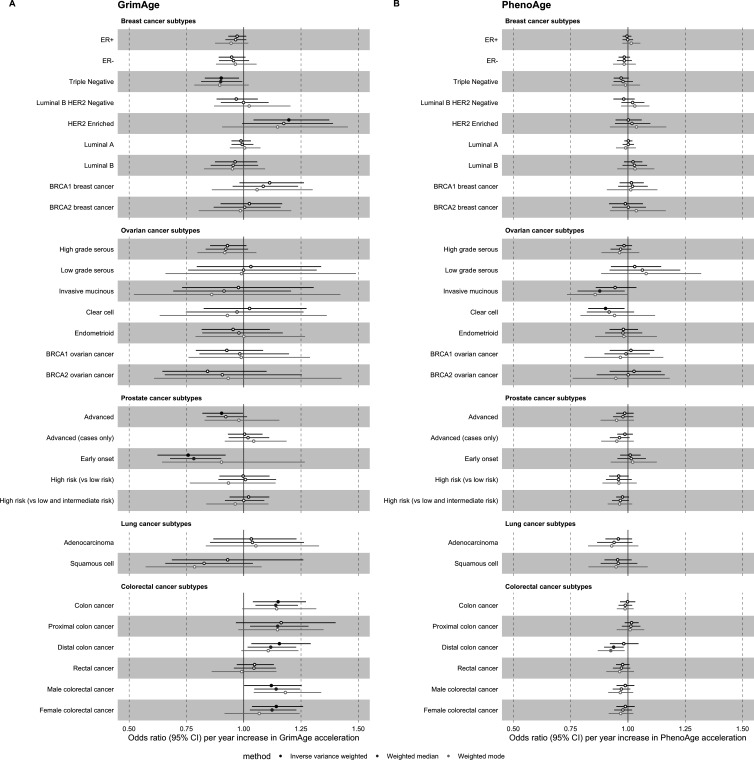
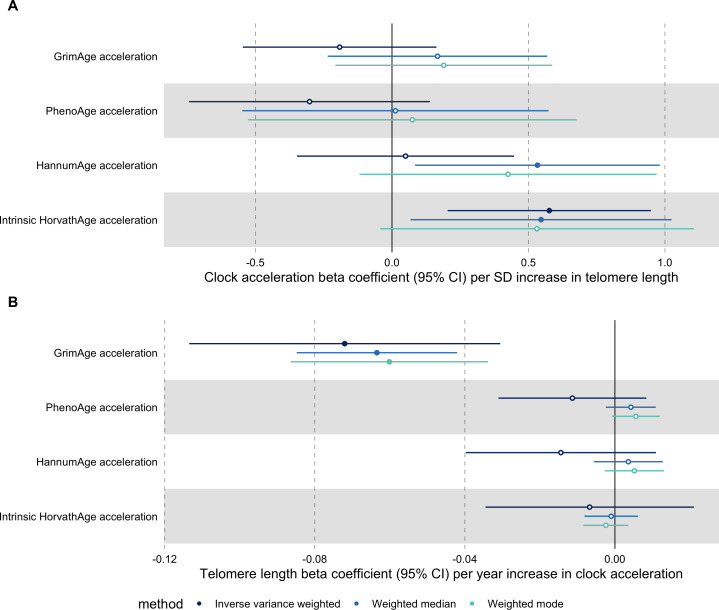
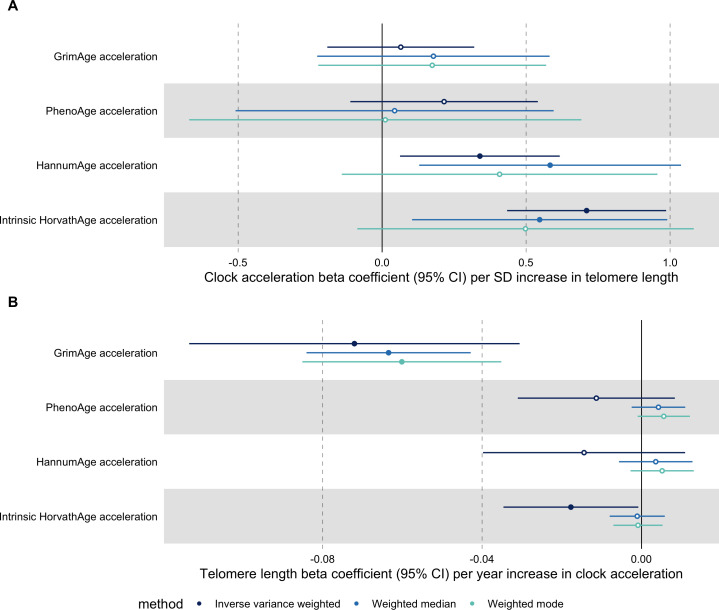
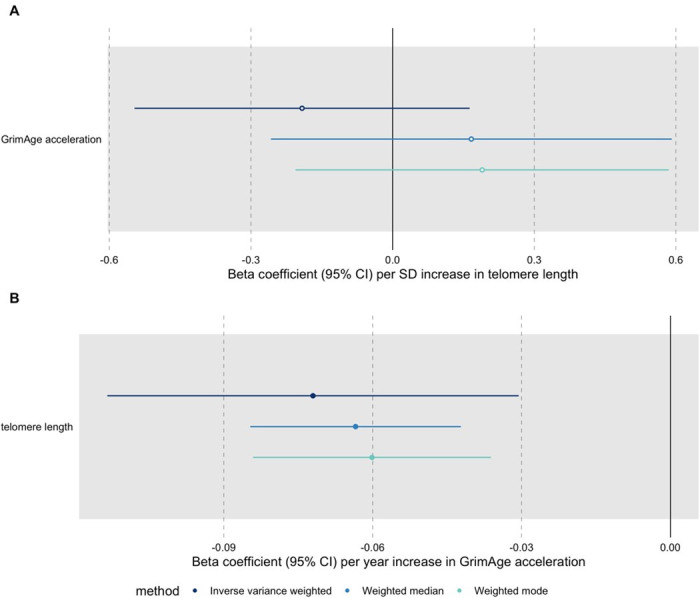
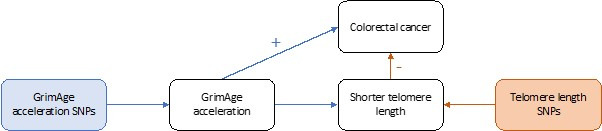
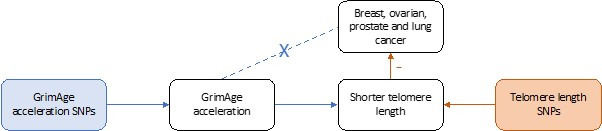
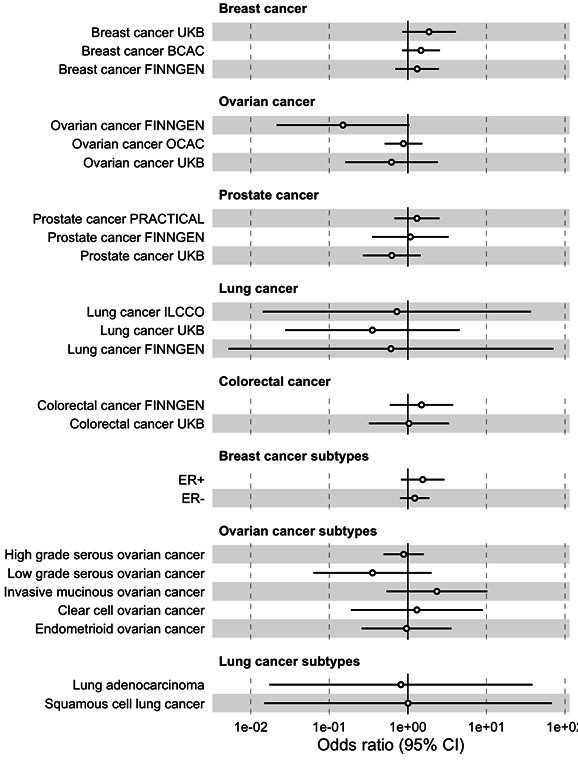
Results: Meta-analysed IVW MR findings suggested that higher GrimAge acceleration increased the risk of colorectal cancer (OR = 1.12 per year increase in GrimAge acceleration, 95% CI 1.04-1.20, p = 0.002). The direction of the genetically predicted effects was consistent across main and sensitivity MR analyses. Among subtypes, the genetically predicted effect of GrimAge acceleration was greater for colon cancer (IVW OR = 1.15, 95% CI 1.09-1.21, p = 0.006), than rectal cancer (IVW OR = 1.05, 95% CI 0.97-1.13, p = 0.24). Results were less consistent for associations between other epigenetic clocks and cancers.

Conclusions: GrimAge acceleration may increase the risk of colorectal cancer. Findings for other clocks and cancers were inconsistent. Further work is required to investigate the potential mechanisms underlying the results.

Funding: FMB was supported by a Wellcome Trust PhD studentship in Molecular, Genetic and Lifecourse Epidemiology (224982/Z/22/Z which is part of grant 218495/Z/19/Z). KKT was supported by a Cancer Research UK (C18281/A29019) programme grant (the Integrative Cancer Epidemiology Programme) and by the Hellenic Republic's Operational Programme 'Competitiveness, Entrepreneurship & Innovation' (OΠΣ 5047228). PH was supported by Cancer Research UK (C18281/A29019). RMM was supported by the NIHR Biomedical Research Centre at University Hospitals Bristol and Weston NHS Foundation Trust and the University of Bristol and by a Cancer Research UK (C18281/A29019) programme grant (the Integrative Cancer Epidemiology Programme). RMM is a National Institute for Health Research Senior Investigator (NIHR202411). The views expressed are those of the author(s) and not necessarily those of the NIHR or the Department of Health and Social Care. GDS and CLR were supported by the Medical Research Council (MC_UU_00011/1 and MC_UU_00011/5, respectively) and by a Cancer Research UK (C18281/A29019) programme grant (the Integrative Cancer Epidemiology Programme). REM was supported by an Alzheimer's Society project grant (AS-PG-19b-010) and NIH grant (U01 AG-18-018, PI: Steve Horvath). RCR is a de Pass Vice Chancellor's Research Fellow at the University of Bristol.

Keywords: DNA methylation; Mendelian randomization; cancer; epidemiology; epigenetic age acceleration; epigenetic clocks; genetics; genomics; human; medicine.

Plain language summary

Have you noticed that some people seem to get older faster than others? Scientists have previously found that a chemical tag on DNA known as DNA methylation can be used to predict an individual’s chronological age. However, age predicted using DNA methylation (also known as biological or epigenetic age) does not always perfectly correspond to chronological age. Indeed, some people’s biological age is higher than their years, while other people’s is lower. When an individual’s biological age is higher than their chronological age, they are said to be experiencing ‘epigenetic age acceleration’. This type of accelerated ageing, which can be measured with ‘epigenetic clocks’ based on DNA methylation, has been associated with several adverse health outcomes, including cancer. This means that epigenetic clocks may improve our ability to predict cancer risk and detect cancer early. However, it is still unclear whether accelerated biological ageing causes cancer, or whether it simply correlates with the disease. Morales-Berstein et al. wanted to investigate whether epigenetic age acceleration, as measured by epigenetic clocks, plays a role in the development of several cancers. To do so, they used an approach known as Mendelian randomization. Using genetic variants as natural experiments, they studied the effect of different measures of epigenetic age acceleration on cancer risk. Their work focused on five types of cancer: breast, colorectal, prostate, ovarian and lung cancer. They used genetic association data from people of European ancestry to determine whether genetic variants that are strongly associated with accelerated ageing are also strongly associated with cancer. The results showed that one of the DNA methylation markers used as an estimate of biological ageing could be directly related to the risk of developing colorectal cancer. This work provides new insights into the relationship between markers of biological ageing and cancer. Similar relationships should also be studied in other groups of people and for other cancer sites. The results suggest that reversing biological ageing by altering DNA methylation could prevent or delay the development of colorectal cancer.


Conflict of interest statement

FM, DM, KT, EB, PH, KB, AP, DB, IC, RM, GD, TR, RR No competing interests declared, AL declares that UC Regents filed the patent "DNA METHYLATION BASED BIOMARKERS FOR LIFE EXPECTANCY AND MORBIDITY" (International Application Number PCT/US2019/055444; in pending status) and that the Epigenetic Clock Development Foundation and Foxo Labs hold licenses, CR declares that UC Regents filed the patent "DNA METHYLATION BASED BIOMARKERS FOR LIFE EXPECTANCY AND MORBIDITY" (International Application Number PCT/US2019/055444; in pending status) and that the Epigenetic Clock Development Foundation and Foxo Labs hold licenses. SH receives consulting fees from the Epigenetic Clock Development Foundation and royalties for patents involving epigenetic clocks, SH has received a speaker fee from Illumina and is an advisor to the Epigenetic Clock Development Foundation, RM is employed part time by Novo Nordisk outside of this work

Figures

Figure 1.
Figure 1.. Flowchart summarising study methods.
Abbreviations: BCAC, Breast Cancer Association Consortium; OCAC, Ovarian Cancer Association Consortium; PRACTICAL, Prostate Cancer Association Group to Investigate Cancer Associated Alterations in the Genome; ILCCO, International Lung Cancer Consortium; GECCO, Genetics and Epidemiology of Colorectal Cancer Consortium; LD, linkage disequilibrium; IVW, inverse variance weighted; MR, Mendelian randomization; FDR, false discovery rate; GWAS, genome-wide association study; CAUSE, Causal Analysis Using Summary Effect estimates, SNP, single-nucleotide polymorphism.
Figure 2.
Figure 2.. Fixed effect meta-analysis of inverse-variance weighted Mendelian randomization estimates for genetically predicted effects of epigenetic age acceleration on multiple cancers.
Odds ratios and 95% confidence intervals are reported per 1 year increase in (A) GrimAge acceleration, (B) PhenoAge acceleration, (C) HannumAge acceleration and (D) Intrinsic HorvathAge acceleration. GrimAge, PhenoAge, HannumAge and Intrinsic HorvathAge acceleration were instrumented by 4, 11, 9, and 24 genetic variants, respectively. All meta-analysis estimates were calculated using data from UK Biobank, FinnGen and international consortia, except for colorectal cancer estimates, which exclude UK Biobank data to avoid double counting.
Figure 3.
Figure 3.. Fixed effect meta-analysis of Mendelian randomization estimates for genetically predicted effects of GrimAge acceleration on multiple cancers.
Odds ratios and 95% confidence intervals are reported per 1 year increase in GrimAge acceleration. GrimAge acceleration was instrumented by four genetic variants. Results were obtained using inverse variance weighted MR (dark blue), weighted median (sky blue) and weighted mode (turquoise) methods. All meta-analysis estimates were calculated using data from UK Biobank, FinnGen and international consortia, except for colorectal cancer estimates, which exclude UK Biobank data to avoid double counting.
Figure 4.
Figure 4.. Scatter plot showing the effect of genetic instruments on GrimAge acceleration against their effect on colorectal cancer.
FinnGen and Genetics and Epidemiology of Colorectal Cancer (GECCO) genome-wide association estimates for colorectal cancer were meta-analysed using the METAL software. UK Biobank estimates were not included in the meta-analysis to avoid double counting participants included in the GECCO consortium. Results were obtained using inverse variance weighted MR (light blue), weighted median (dark blue) and weighted mode (light green) methods.
Figure 5.
Figure 5.. Mendelian randomization estimates for genetically predicted effects of GrimAge acceleration on colorectal cancer subtypes.
Odds ratios and 95% confidence intervals are reported per 1 year increase in GrimAge acceleration. GrimAge acceleration was instrumented by four genetic variants. Results were obtained using inverse variance weighted MR (dark blue), weighted median (sky blue) and weighted mode (turquoise) methods. Data source: GECCO.
Figure 6.
Figure 6.. Mendelian randomization estimates for genetically predicted effects of GrimAge acceleration on parental history of multiple cancers.
Odds ratios and 95% confidence intervals are reported per 1 year increase in GrimAge acceleration. GrimAge acceleration was instrumented by four genetic variants. Results were obtained using inverse variance weighted MR (dark blue), weighted median (sky blue) and weighted mode (turquoise) methods. Data source: UK Biobank.
Appendix 2—figure 1.
Appendix 2—figure 1.. Fixed effect meta-analysis of Mendelian randomization estimates for genetically predicted effects of epigenetic age acceleration on multiple cancers.
Odds ratios and 95% confidence intervals are reported per 1 year increase in (A) GrimAge acceleration, (B) PhenoAge acceleration, (C) HannumAge acceleration and (D) Intrinsic HorvathAge acceleration. Results were obtained using inverse variance weighted MR (dark blue), weighted median (sky blue) and weighted mode (turquoise) methods. All meta-analysis estimates were calculated using data from UK Biobank, FinnGen and international consortia, except for colorectal cancer estimates, which exclude UK Biobank data to avoid double counting.
Appendix 2—figure 2.
Appendix 2—figure 2.. Mendelian randomization estimates for genetically predicted effects of GrimAge and PhenoAge acceleration on multiple cancer subtypes.
Odds ratios and 95% confidence intervals are reported per 1 year increase in (A) GrimAge acceleration, (B) PhenoAge acceleration. GrimAge and PhenoAge acceleration were instrumented by four and 11 genetic variants, respectively. Results were obtained using inverse variance weighted MR (dark blue), weighted median (sky blue) and weighted mode (turquoise) methods. Data sources: BCAC, OCAC, CIMBA, PRACTICAL, ILCCO and GECCO.
Appendix 2—figure 3.
Appendix 2—figure 3.. Mendelian randomization estimates for genetically predicted effects of HannumAge and Intrinsic HorvathAge acceleration on multiple cancer subtypes.
Odds ratios and 95% confidence intervals are reported per 1 year increase in (A) HannumAge acceleration, (B) Intrinsic HorvathAge acceleration. HannumAge and Intrinsic HorvathAge acceleration were instrumented by nine and 24 genetic variants, respectively. Results were obtained using inverse variance weighted MR (dark blue), weighted median (sky blue) and weighted mode (turquoise) methods. Data sources: BCAC, OCAC, CIMBA, PRACTICAL, ILCCO and GECCO.
Appendix 2—figure 4.
Appendix 2—figure 4.. Mendelian randomization estimates for genetically predicted effects of epigenetic age acceleration on parental history of multiple cancers.
Odds ratios and 95% confidence intervals are reported per 1 year increase in (A) GrimAge acceleration, (B) PhenoAge acceleration, (C) HannumAge acceleration and (D) Intrinsic HorvathAge acceleration. GrimAge, PhenoAge, HannumAge and Intrinsic HorvathAge acceleration were instrumented by 4, 11, 9 and 24 genetic variants, respectively. Results were obtained using inverse variance weighted MR (dark blue), weighted median (sky blue) and weighted mode (turquoise) methods. Data source: UK Biobank.
Appendix 2—figure 5.
Appendix 2—figure 5.. Scatter plot showing the effect of genetic instruments on GrimAge acceleration against their effect on multiple cancer.
Genome-wide association estimates for (A) breast, (B) ovarian, (C) prostate, (D) lung and (E) colorectal cancer were meta-analysed using the METAL software. Results were obtained using inverse variance weighted MR (light blue), weighted median (dark blue) and weighted mode (light green) methods. Data sources: UK Biobank, FinnGen and international cancer genetic consortia. For colorectal cancer, UK Biobank estimates were not included in the meta-analysis to avoid double counting participants included in the GECCO consortium.
Appendix 2—figure 6.
Appendix 2—figure 6.. Scatter plot showing the effect of genetic instruments on PhenoAge acceleration against their effect on multiple cancer.
Genome-wide association estimates for (A) breast, (B) ovarian, (C) prostate, (D) lung and (E) colorectal cancer were meta-analysed using the METAL software. Results were obtained using inverse variance weighted MR (light blue), weighted median (dark blue) and weighted mode (light green) methods. Data sources: UK Biobank, FinnGen and international cancer genetic consortia. For colorectal cancer, UK Biobank estimates were not included in the meta-analysis to avoid double counting participants included in the GECCO consortium.
Appendix 2—figure 7.
Appendix 2—figure 7.. Scatter plot showing the effect of genetic instruments on HannumAge acceleration against their effect on multiple cancer.
Genome-wide association estimates for (A) breast, (B) ovarian, (C) prostate, (D) lung and (E) colorectal cancer were meta-analysed using the METAL software. Results were obtained using inverse variance weighted MR (light blue), weighted median (dark blue) and weighted mode (light green) methods. Data sources: UK Biobank, FinnGen and international cancer genetic consortia. For colorectal cancer, UK Biobank estimates were not included in the meta-analysis to avoid double counting participants included in the GECCO consortium.
Appendix 2—figure 8.
Appendix 2—figure 8.. Scatter plot showing the effect of genetic instruments on Intrinsic HorvathAge acceleration against their effect on multiple cancer.
Genome-wide association estimates for (A) breast, (B) ovarian, (C) prostate, (D) lung and (E) colorectal cancer were meta-analysed using the METAL software. Results were obtained using inverse variance weighted MR (light blue), weighted median (dark blue) and weighted mode (light green) methods. Data sources: UK Biobank, FinnGen and international cancer genetic consortia. For colorectal cancer, UK Biobank estimates were not included in the meta-analysis to avoid double counting participants included in the GECCO consortium.
Appendix 2—figure 9.
Appendix 2—figure 9.. Mendelian randomization estimates for genetically predicted effects of GrimAge acceleration on negative control outcomes.
Odds ratios and 95% confidence intervals are reported per 1 year increase in GrimAge acceleration. GrimAge was instrumented by four genetic variants. Results were obtained using inverse variance weighted MR (dark blue), weighted median (sky blue) and weighted mode (turquoise) methods. Data source: UK Biobank.
Appendix 2—figure 10.
Appendix 2—figure 10.. Mendelian randomization estimates for genetically predicted effects of GrimAge acceleration on potential confounders of the association between GrimAge acceleration and colorectal cancer.
Odds ratios and 95% confidence intervals are reported per 1 year increase in GrimAge acceleration. GrimAge was instrumented by four genetic variants. Results were obtained using inverse variance weighted MR (dark blue), weighted median (sky blue) and weighted mode (turquoise) methods. Data sources: UK Biobank (for time spent doing vigorous physical activity, pack years of smoking, alcohol intake frequency and age completed full time education), GIANT consortium (for waist circumference and body mass index) and the SSAGC consortium (for years of schooling).
Appendix 2—figure 11.
Appendix 2—figure 11.. CAUSE analysis for the genetically predicted effect of GrimAge acceleration on colorectal cancer in GECCO.
CAUSE estimates for colorectal cancer reported per 1 year increase in GrimAge acceleration. The ELPD Contribution plot shows the relative contribution of each SNP to the CAUSE test statistic. Only SNPs with P < 5e-8 are shown. SNPs represented by larger circles reflect smaller p-values for the associations between genetic variants and GrimAge acceleration. SNPs that contribute more to the causal model are shown in warmer tones (i.e. red), while those that contribute more to the sharing model are shown in colder tones (i.e. blue). The delta_elpd is the statistic used to compare models. It is equal to elpd(model 1)- elpd(model 2). In the upper table, positive delta_elpd’s suggest that model one is a better fit to the data than model 2 (i.e. that the null model is better than the sharing model in row 1, that the null model is better than the causal model in row 2, and that the sharing model is better than the causal model in row 3). The corresponding p-values test whether model two is a better fit than model 1. Here, row three suggests that the causal model is not a better fit than the sharing model (the delta_elpd is positive and the p-value is 1, so there is no detectable evidence against the null hypothesis that the sharing model is better than the causal model). In the bottom table, eta represents the sharing factor effect (SNPs affect shared factor and shared factor simultaneously affects GrimAge and colorectal cancer) and gamma represents the causal factor effect (SNPs affect GrimAge and GrimAge affects colorectal cancer). Here, “0 (-0.04, 0.04)” represents the genetically predicted effect of GrimAge acceleration on colorectal cancer after adjusting for correlated and uncorrelated horizontal pleiotropy (results in log odds ratio scale). The intervals shown are credible intervals. Data source: GECCO, Genetics and Epidemiology of Colorectal Cancer Consortium.
Appendix 2—figure 12.
Appendix 2—figure 12.. Genetic correlation estimates for epigenetic age acceleration and multiple cancers.
Genetic correlation coefficients are reported per 1 year increase in epigenetic age acceleration. Results were obtained using LD Score regression. Abbreviations: BCAC, Breast Cancer Association Consortium; OCAC, Ovarian Cancer Association Consortium; PRACTICAL, Prostate Cancer Association Group to Investigate Cancer Associated Alterations in the Genome; ILCCO, International Lung Cancer Consortium; GECCO, Genetics and Epidemiology of Colorectal Cancer Consortium. For UK Biobank lung cancer results, adjusted means results have been adjusted for genotyping chip and unadjusted means results have not been adjusted for genotyping chip.
Appendix 2—figure 13.
Appendix 2—figure 13.. Bidirectional Mendelian randomization estimates for epigenetic age acceleration and measured telomere length.
Beta coefficients and 95% confidence intervals are reported per (A) one standard deviation increase in telomere length and (B) 1 year increase in epigenetic clock acceleration. Results were obtained using inverse variance weighted MR (dark blue), weighted median (sky blue) and weighted mode (turquoise) methods. Telomere length, GrimAge, PhenoAge, HannumAge and Intrinsic HorvathAge acceleration were instrumented by 128, 4, 11, 9 and 23 genetic variants, respectively.
Appendix 2—figure 14.
Appendix 2—figure 14.. Bidirectional Mendelian randomization estimates for epigenetic age acceleration and measured telomere length after Steiger filtering.
Beta coefficients and 95% confidence intervals are reported per (A) one standard deviation increase in telomere length and (B) 1 year increase in epigenetic clock acceleration. Results were obtained using inverse variance weighted MR (dark blue), weighted median (sky blue) and weighted mode (turquoise) methods. GrimAge, PhenoAge, HannumAge and Intrinsic HorvathAge acceleration were instrumented by 4, 11, 9 and 22 genetic variants, respectively. Telomere length was instrumented by 104, 105, 105 and 109 genetic variants in GrimAge, PhenoAge, HannumAge and Intrinsic HorvathAge acceleration analyses, respectively,.
Author response image 1.
Author response image 1.. Bidirectional Mendelian randomization estimates for GrimAge acceleration and telomere length.
Here we see the genetically predicted effect of (A) telomere length on GrimAge acceleration and (B) GrimAge acceleration on telomere length.
Author response image 2.
Author response image 2.. Causal associations between GrimAge acceleration, shorter telomere length and colorectal cancer.
Author response image 3.
Author response image 3.. Causal associations between GrimAge acceleration, shorter telomere length and breast, ovarian, prostate and lung cancer.
Author response image 4.
Author response image 4.. Inverse-variance weighted Mendelian randomization estimates for genetically predicted effects of parental longevity (combined parental age at death) on multiple cancers.
Author response image 5.
Author response image 5.. Bidirectional Mendelian randomization estimates for GrimAge acceleration and parental longevity.
Here we see the genetically predicted effect of (A) parental longevity estimated as combined parental age at death on GrimAge acceleration and (B) GrimAge acceleration on parental longevity estimated as combined parental age at death.

Comment in

References

    1. Ambatipudi S, Horvath S, Perrier F. DNA methylome analysis identifies accelerated epigenetic ageing associated with postmenopausal breast cancer susceptibility. European Journal of Cancer. 2017;75:299–307. doi: 10.1016/j.ejca.2017.01.014. - DOI - PMC - PubMed
    1. Amos CI, Wu X, Broderick P, Gorlov IP, Gu J, Eisen T, Dong Q, Zhang Q, Gu X, Vijayakrishnan J, Sullivan K, Matakidou A, Wang Y, Mills G, Doheny K, Tsai Y-Y, Chen WV, Shete S, Spitz MR, Houlston RS. Genome-wide association scan of tag SNPs identifies a susceptibility locus for lung cancer at 15q25.1. Nature Genetics. 2008;40:616–622. doi: 10.1038/ng.109. - DOI - PMC - PubMed
    1. Benjamini Y, Hochberg Y. Controlling the False Discovery Rate: A Practical and Powerful Approach to Multiple Testing. Journal of the Royal Statistical Society. 1995;57:289–300. doi: 10.1111/j.2517-6161.1995.tb02031.x. - DOI
    1. Bottazzi B, Riboli E, Mantovani A. Aging, inflammation and cancer. Seminars in Immunology. 2018;40:74–82. doi: 10.1016/j.smim.2018.10.011. - DOI - PubMed
    1. Bowden J, Davey Smith G, Burgess S. Mendelian randomization with invalid instruments: effect estimation and bias detection through Egger regression. International Journal of Epidemiology. 2015;44:512–525. doi: 10.1093/ije/dyv080. - DOI - PMC - PubMed

Publication types