. 2022 Apr 15;208(8):1873-1885.
doi: 10.4049/jimmunol.2100948. Epub 2022 Mar 28.

H3K27me3 Demethylase UTX Restrains Plasma Cell Formation

Affiliations

H3K27me3 Demethylase UTX Restrains Plasma Cell Formation

Anna K Kania et al. J Immunol. .

Abstract

B cell differentiation is associated with substantial transcriptional, metabolic, and epigenetic remodeling, including redistribution of histone 3 lysine 27 trimethylation (H3K27me3), which is associated with a repressive chromatin state and gene silencing. Although the role of the methyltransferase EZH2 (Enhancer of zeste homolog 2) in B cell fate decisions has been well established, it is not known whether H3K27me3 demethylation is equally important. In this study, we showed that simultaneous genetic deletion of the two H3K27 demethylases UTX and JMJD3 (double-knockout [Utx fl/fl Jmjd3 fl/fl Cd19 cre/+] [dKO]) led to a significant increase in plasma cell (PC) formation after stimulation with the T cell-independent Ags LPS and NP-Ficoll. This phenotype occurred in a UTX-dependent manner as UTX single-knockout mice, but not JMJD3 single-knockout mice, mimicked the dKO. Although UTX- and JMJD3-deficient marginal zone B cells showed increased proliferation, dKO follicular B cells also showed increased PC formation. PCs from dKO mice upregulated genes associated with oxidative phosphorylation and exhibited increased spare respiratory capacity. Mechanistically, deletion of Utx and Jmjd3 resulted in higher levels of H3K27me3 at proapoptotic genes and resulted in reduced apoptosis of dKO PCs in vivo. Furthermore, UTX regulated chromatin accessibility at regions containing ETS and IFN regulatory factor (IRF) transcription factor family motifs, including motifs of known repressors of PC fate. Taken together, these data demonstrate that the H3K27me3 demethylases restrain B cell differentiation.


Figures

Figure 1.
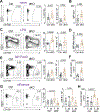
Figure 1.. Deletion of Utx and Jmjd3 promotes PC formation.
(A) Representative plots of B220 and CD138 expression (left) and quantification of splenic CD138+ PC from the highlighted gates (right) in naïve Ctrl and dKO mice. (B) Serum IgM antibody titers of Ctrl and dKO from (A). (C) Representative plots of B220 and CD138 expression (left) and quantification of splenic CD138+ PC three days later after stimulation with 50μg LPS. (D) Serum IgM antibody titers of Ctrl and dKO from (C). (E) Representative plots of B220 and CD138 expression (left) and quantification of splenic CD138+ PC (right) seven days after stimulation with 50μg NP-Ficoll. (F) Serum NP-specific IgM antibody titers of Ctrl and dKO mice from (E). (G) Representative plots of B220 and CD138 expression (left) and quantification of CD138+ PC in the draining lymph nodes (right) ten days after infection with 150,00 vfu of PR8 influenza virus. (H) Hemagglutinin (HA)-specific serum IgM antibody titers of Ctrl and dKO from (G). Females are designated with open symbols and males with closed symbols. The data represent combined results of at least two independent experiments with a minimum of 3 mice per group. Significance was determined by Student’s t test with p-values ≤0.05 considered significant.
Figure 2.
Figure 2.. UTX- and JMJD3-deficient MZB generate more PC
(A) Representative plots and of CD21 and CD23 expression in B220+CD93 naïve Ctrl and dKO mice and quantification of splenic B220+CD93CD21+ MZB and B220+CD93CD21mid/lowCD23+ FOB. (B) Magnetically enriched splenic Ctrl and dKO MZB were cultured ex vivo with LPS, IL-2, IL-5. Representative plots of B220 and CD138 expression (left) and quantification of CD138+ PC (right) after three days of ex vivo culture. Each point represents samples from individual mice. Females are designated with open symbols and males with closed symbols. The data represent combined results of at least two independent experiments with a minimum of 3 mice per group. Significance was determined by Student’s t test with p-values ≤0.05 considered significant.
Figure 3.
Figure 3.. Loss of UTX alone leads to increases in PC formation.
(A) Representative plots of B220 and CD138 expression in Ctrl, dKO, UTX sKO, JMJD3 sKO mice three days after stimulation with 50μg LPS. Quantification of splenic CD138+ PC frequency (B) and absolute cell numbers (C) from (A). (D) Serum IgM antibody titers of Ctrl, dKO, UTX sKO, JMJD3 sKO mice from (A). Females are designated with open symbols and males with closed symbols. The data represent combined results of two independent experiments with a minimum of 3 mice per group. Significance was determined by two-tailed Student’s t test with p-values ≤ 0.05 considered significant.
Figure 4.
Figure 4.. Deletion of Utx and Jmjd3 results in upregulation of genes associated with cell growth and proliferation.
Splenic B220+CD93CD21+ MZB and B220+CD93CD21mid/lowCD23+ FOB from Ctrl and dKO mice were FACS isolated and saved for RNA-seq or cultured ex vivo with LPS, IL-2, and IL-5 as described in the methods section. Three days later, CD138+ PC generated from these cultures were isolated via FACS for RNA-seq. (A) Volcano plots representing DEG (FDR≤0.05) between Ctrl and dKO samples in each comparison. (B) GSEA plots for top pathways upregulated in dKO MZB. (C) Heatmap of z-score normalized Rpkm average expression top genes in gene datasets from (B) in each group. (D) Bar plots representing the expression of the indicated genes in all sample groups. Asterisk represent DEG between the indicated pair. The data are the summary of results obtained from three biological replicates of Ctrl MZB, dKO MZB, Ctrl FOB, Ctrl MZB-PC, dKO MZB-PC and two biological replicates of dKO FOB, Ctrl FOB-PC, dKO FOB-PC.
Figure 5.
Figure 5.. UTX- and JMJD3-deficient MZB have a proliferative advantage.
(A) Schematic of experimental design. Splenic B220+CD93CD21+ MZB and B220+CD93CD21mid/lowCD23+ FOB were magnetically enriched from Ctrl (CD45.1/2) and dKO (CD45.2) mice, mixed at a 1:1 ratio, stained with CTV, and adoptively transferred into CD45.1 μMT hosts. Host mice were inoculated with 50 μg of LPS the next day, injected with BrdU 60 hours later, and scarified one hour later. Representative plots of transferred MZB (B) and FOB (C) populations sixty-one hours post LPS stimulation. Representative plots of B220 and CD138 expression and quantification of splenic CD138+ PC derived from the transferred Ctrl and dKO MZB (D) OR FOB (E). Representative CTV histograms of adoptively transferred Ctrl and dKO MZB (F) or FOB (G). Representative plots of BrdU and 7-AAD incorporation (left) and quantification of BrdU+ cells (right) in transferred Ctrl and dKO MZB (H) or FOB (I). These results were derived from two independent experiments with 3–4 adoptive transfers per group (MZB or FOB). Females are designated with open symbols and males with closed symbols. Statistical analysis was performed using paired two-tailed Student’s t test with p-value ≤ 0.05 considered significant.
Figure 6.
Figure 6.. UTX- and JMJD3-deficient PC upregulate OXPHOS.
(A) Heatmap of hierarchical-clustering, Z-score normalized DEG between Ctrl and dKO PC derived from either MZB (MZB→PC) or FOB (FOB→PC). (B) GSEA for Hallmark Oxidative Phosphorylation gene set for Ctrl and dKO PC from (A). (C) Bar plot representing the expression of the Pdk1 gene in each experimental group. Asterisk indicates FDR ≤ 0.05. (D) Splenic naïve B cells from Ctrl and dKO mice were cultured ex vivo with LPS, IL-2, IL-5. Three days later, CD138+ PC were magnetically enriched and assessed for their oxygen consumption rates (OCR) using the Seahorse extracellular flux assay. OCR was measured before and after administration of the indicated metabolic inhibitors (left). Spare respiratory capacity (SRC) was calculated as the difference between maximal and basal OCR. The data is a summary of two independent experiments with at least four biological replicates per group. Females are designated with open symbols and males with closed symbols. Significance was determined by two-tailed Student’s t test with p-values ≤0.05 considered significant.
Figure 7.
Figure 7.. UTX and JMJD3 regulate H3K27me3 enrichment and chromatin accessibility.
ATAC-seq, ChIP-seq, and C&T were performed on FACS-isolated Ctrl and dKO PC three days after LPS inoculation in vivo. (A) ChIP-seq data scatterplot representing regions with 1.5-fold change in enrichment (FDR ≤ 0.05) in H3K27me3 levels between Ctrl and dKO PC. Genes with large changes are highlighted. (B) Scatterplot of changes in H3K27me3 (ChIP-seq) enrichment versus gene expression (RNA-seq) between Ctrl and dKO PC. (C) Volcano plot representing DAR (1.5-fold change, FDR ≤ 0.05) between Ctrl and dKO PC. (D) H3K27me3 enrichment within 1kb of downDAR from (C) in Ctrl and dKO PC based on results from ChIP-seq (left) or C&T (right). (E) Top TF motif, family, and p-value enriched at downDAR. (F) Scatterplot of Page Rank score versus gene expression between Ctrl and dKO PC. Red dots indicate DEG (FDR ≤ 0.05). (G) Genome plot for Bcl2l11 depicting chromatin accessibility (ATAC-seq) and H3K27me3 enrichment from ChIP-seq and C&T in Ctrl and dKO PC (left). The blue and gray shaded regions indicate DAR and g regions with differential levels of H3K27me3 enrichment in ChIP-seq, respectively. Bar plot of Bcl2l11 gene expression (right). Representative plots of Annexin V versus viability (H) and active caspase 3 verses viability (I) in splenic TACI+CD98+ Ctrl and dKO PC three days after stimulation with 50μg LPS in vivo (left) with quantification (right). The ATAC-seq and ChIP-seq were performed on three Ctrl and four dKO PC. C&T was performed on four Ctrl and four dKO PC. Data in (H) and (I) are the summary of two independent experiments with at least three biological replicates. Females are designated with open symbols and males with closed symbols. Statistical analysis was performed using two-tailed Student’s t test with p-value ≤ 0.05 considered significant. ws

References

    1. Fairfax KA, Kallies A, Nutt SL, and Tarlinton DM. 2008. Plasma cell development: from B-cell subsets to long-term survival niches. Semin Immunol 20: 49–58. - PubMed
    1. Amanna IJ, Carlson NE, and Slifka MK. 2007. Duration of humoral immunity to common viral and vaccine antigens. N Engl J Med 357: 1903–1915. - PubMed
    1. Pillai S, and Cariappa A. 2009. The follicular versus marginal zone B lymphocyte cell fate decision. Nat Rev Immunol 9: 767–777. - PubMed
    1. Allman D, and Pillai S. 2008. Peripheral B cell subsets. Curr Opin Immunol 20: 149–157. - PMC - PubMed
    1. Nutt SL, Hodgkin PD, Tarlinton DM, and Corcoran LM. 2015. The generation of antibody-secreting plasma cells. Nat Rev Immunol 15: 160–171. - PubMed

MeSH terms