

Modeling of waning immunity after SARS-CoV-2 vaccination and influencing factors
- PMID: 35347129
- PMCID: PMC8960902
- DOI: 10.1038/s41467-022-29225-4
Modeling of waning immunity after SARS-CoV-2 vaccination and influencing factors
Abstract
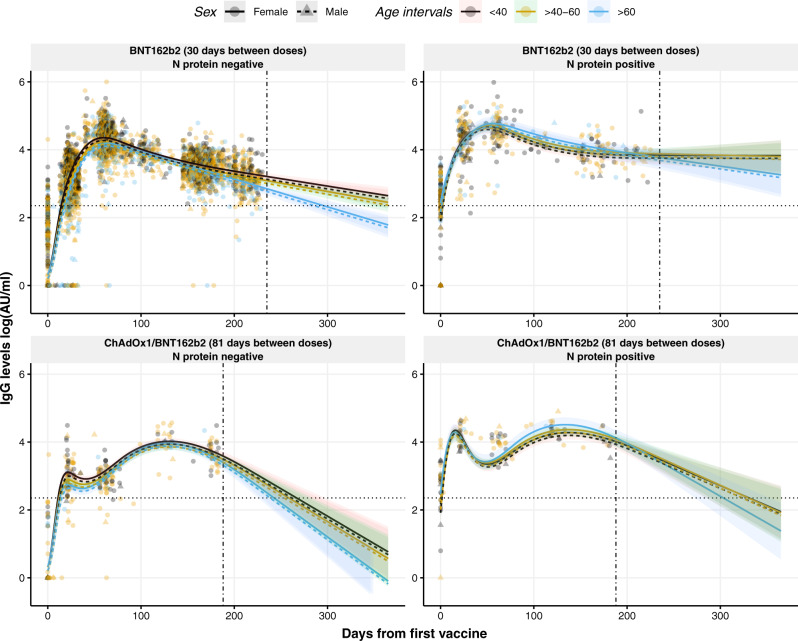
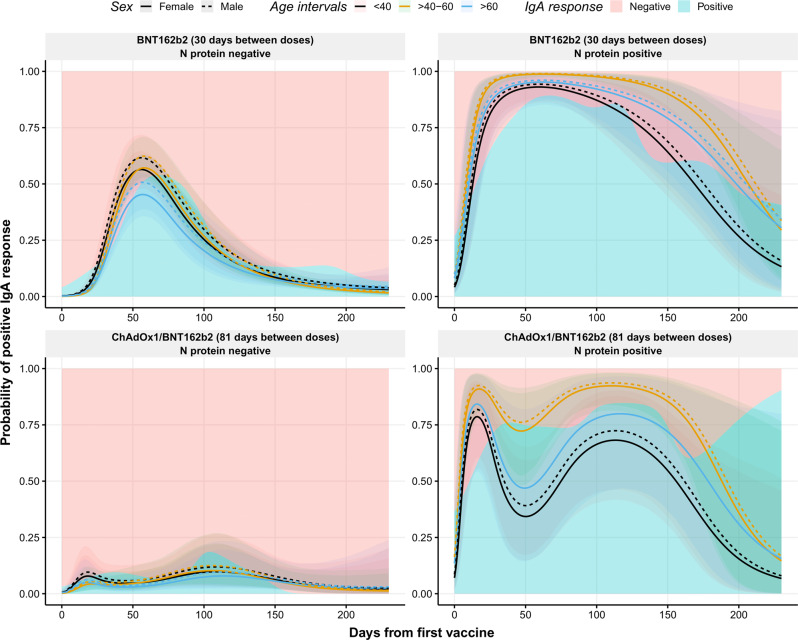
SARS-CoV-2 vaccines are crucial in controlling COVID-19, but knowledge of which factors determine waning immunity is limited. We examined antibody levels and T-cell gamma-interferon release after two doses of BNT162b2 vaccine or a combination of ChAdOx1-nCoV19 and BNT162b2 vaccines for up to 230 days after the first dose. Generalized mixed models with and without natural cubic splines were used to determine immunity over time. Antibody responses were influenced by natural infection, sex, and age. IgA only became significant in naturally infected. A one-year IgG projection suggested an initial two-phase response in those given the second dose delayed (ChAdOx1/BNT162b2) followed by a more rapid decrease of antibody levels. T-cell responses correlated significantly with IgG antibody responses. Our results indicate that IgG levels will drop at different rates depending on prior infection, age, sex, T-cell response, and the interval between vaccine injections. Only natural infection mounted a significant and lasting IgA response.
© 2022. The Author(s).
Conflict of interest statement
The authors declare no competing interests.
Figures


Similar articles
-
Humoral immune response after different SARS-CoV-2 vaccination regimens.BMC Med. 2022 Jan 21;20(1):31. doi: 10.1186/s12916-021-02231-x. BMC Med. 2022. PMID: 35057798 Free PMC article.
-
Differences in IgG Antibody Responses following BNT162b2 and mRNA-1273 SARS-CoV-2 Vaccines.Microbiol Spectr. 2021 Dec 22;9(3):e0116221. doi: 10.1128/Spectrum.01162-21. Epub 2021 Nov 10. Microbiol Spectr. 2021. PMID: 34756093 Free PMC article.
-
BNT162b2 COVID-19 vaccine and correlates of humoral immune responses and dynamics: a prospective, single-centre, longitudinal cohort study in health-care workers.Lancet Respir Med. 2021 Sep;9(9):999-1009. doi: 10.1016/S2213-2600(21)00220-4. Epub 2021 Jul 2. Lancet Respir Med. 2021. PMID: 34224675 Free PMC article.
-
Healthcare Workers in South Korea Maintain a SARS-CoV-2 Antibody Response Six Months After Receiving a Second Dose of the BNT162b2 mRNA Vaccine.Front Immunol. 2022 Jan 31;13:827306. doi: 10.3389/fimmu.2022.827306. eCollection 2022. Front Immunol. 2022. PMID: 35173736 Free PMC article.
-
Immunogenicity of COVID-19 Tozinameran Vaccination in Patients on Chronic Dialysis.Front Immunol. 2021 Jun 30;12:690698. doi: 10.3389/fimmu.2021.690698. eCollection 2021. Front Immunol. 2021. PMID: 34276681 Free PMC article.
Cited by
-
Eleven-month SARS-CoV-2 binding antibody decay, and associated factors, among mRNA vaccinees: implications for booster vaccination.Access Microbiol. 2023 Nov 28;5(11):000678.v3. doi: 10.1099/acmi.0.000678.v3. eCollection 2023. Access Microbiol. 2023. PMID: 38074111 Free PMC article.
-
Antibody and T-cellular response to COVID-19 booster vaccine in SARS-CoV-1 survivors.Clin Immunol. 2022 Nov;244:109103. doi: 10.1016/j.clim.2022.109103. Epub 2022 Aug 29. Clin Immunol. 2022. PMID: 36049602 Free PMC article.
-
Riding high: seroprevalence of SARS-CoV-2 after 4 pandemic waves in Manitoba, Canada, April 2020-February 2022.BMC Public Health. 2023 Dec 5;23(1):2420. doi: 10.1186/s12889-023-17239-6. BMC Public Health. 2023. PMID: 38053033 Free PMC article.
-
Impact of BNT162b2 Booster Dose on SARS-CoV-2 Anti-Trimeric Spike Antibody Dynamics in a Large Cohort of Italian Health Care Workers.Vaccines (Basel). 2023 Feb 17;11(2):463. doi: 10.3390/vaccines11020463. Vaccines (Basel). 2023. PMID: 36851340 Free PMC article.
-
A prospective longitudinal cohort study on risk factors for COVID-19 vaccination failure (RisCoin): methods, procedures and characterization of the cohort.Clin Exp Med. 2023 Dec;23(8):4901-4917. doi: 10.1007/s10238-023-01170-6. Epub 2023 Sep 2. Clin Exp Med. 2023. PMID: 37659994 Free PMC article.
References
Publication types
MeSH terms
Substances
Grants and funding
LinkOut - more resources
Full Text Sources
Medical
Miscellaneous
