. 2022 Mar 28;13(1):1642.
doi: 10.1038/s41467-022-29164-0.

Single-cell transcriptomic analysis suggests two molecularly subtypes of intrahepatic cholangiocarcinoma

Affiliations

Single-cell transcriptomic analysis suggests two molecularly subtypes of intrahepatic cholangiocarcinoma

Guohe Song et al. Nat Commun. .

Erratum in

Abstract

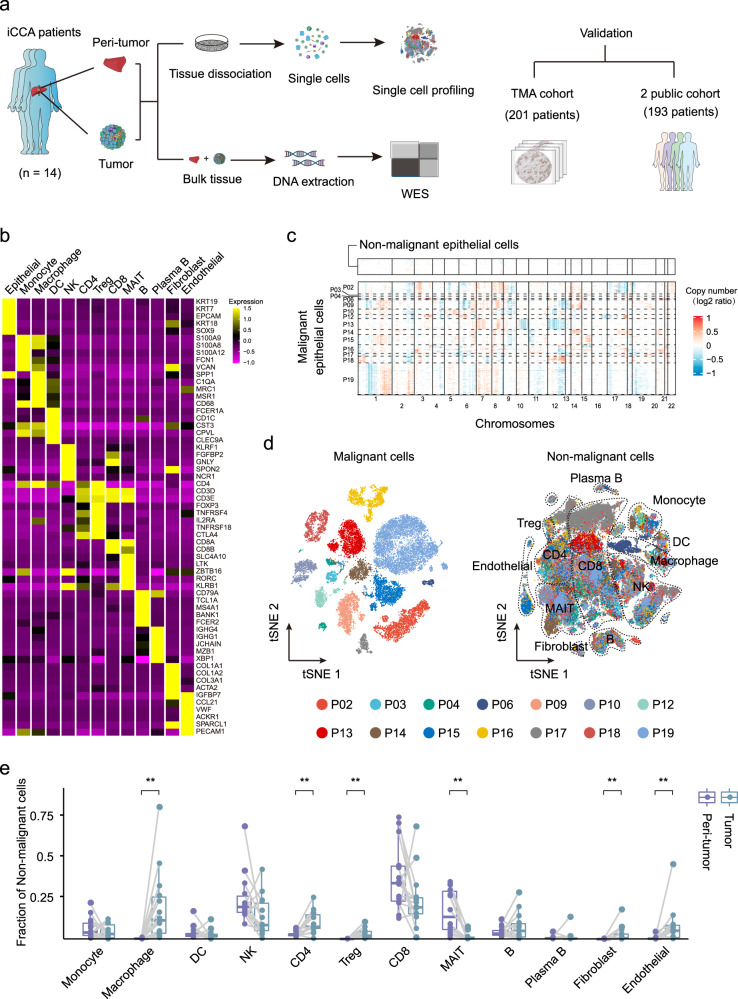
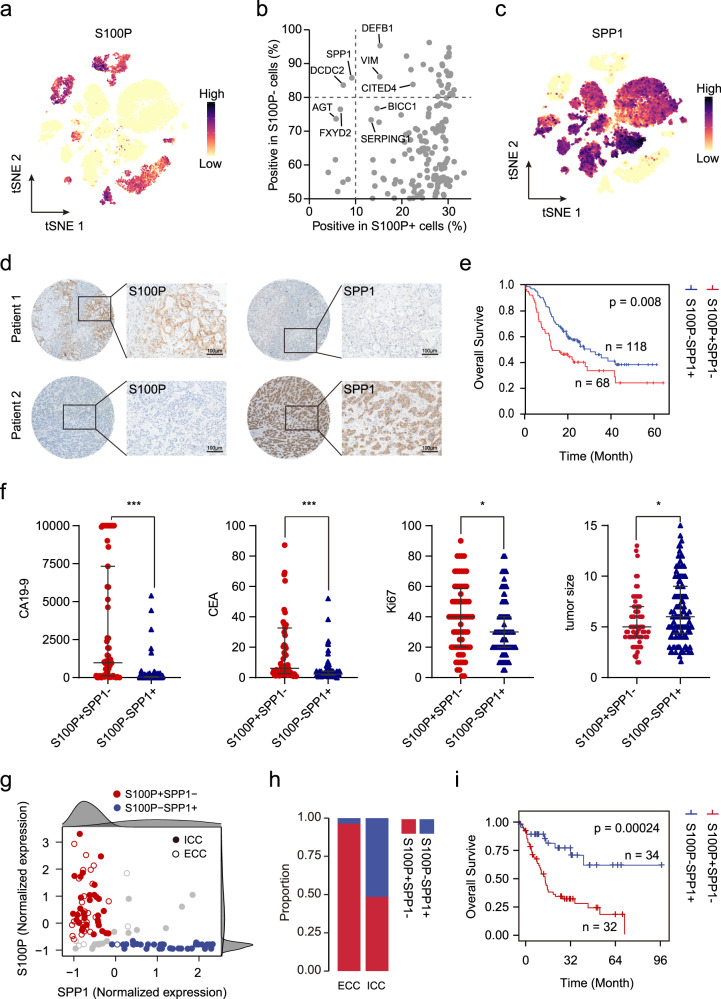
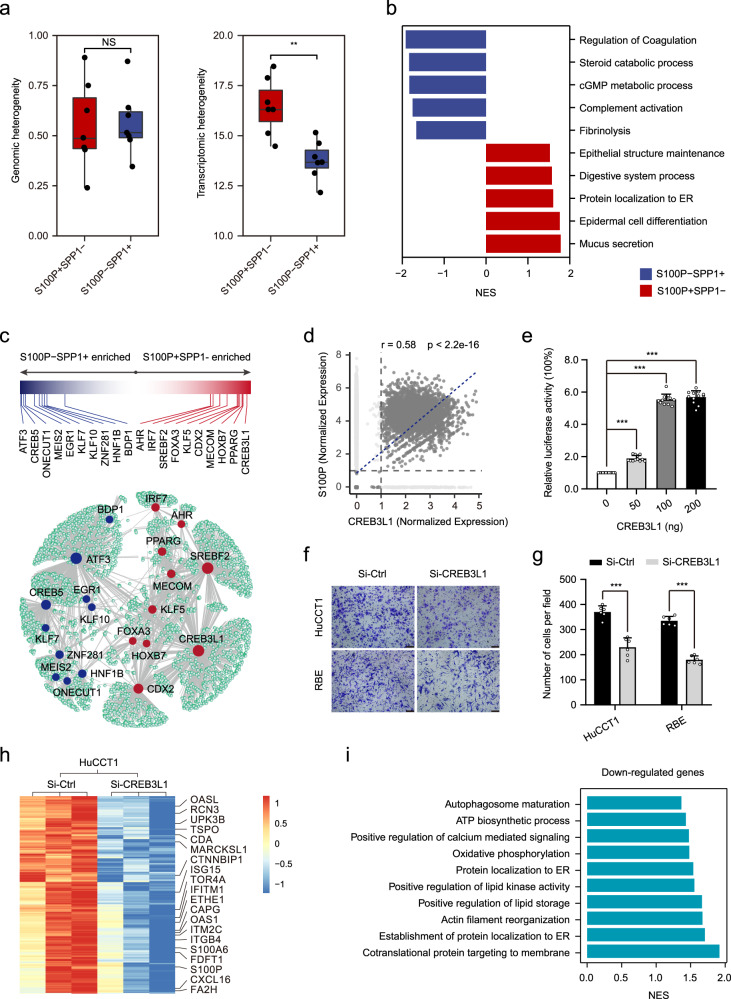
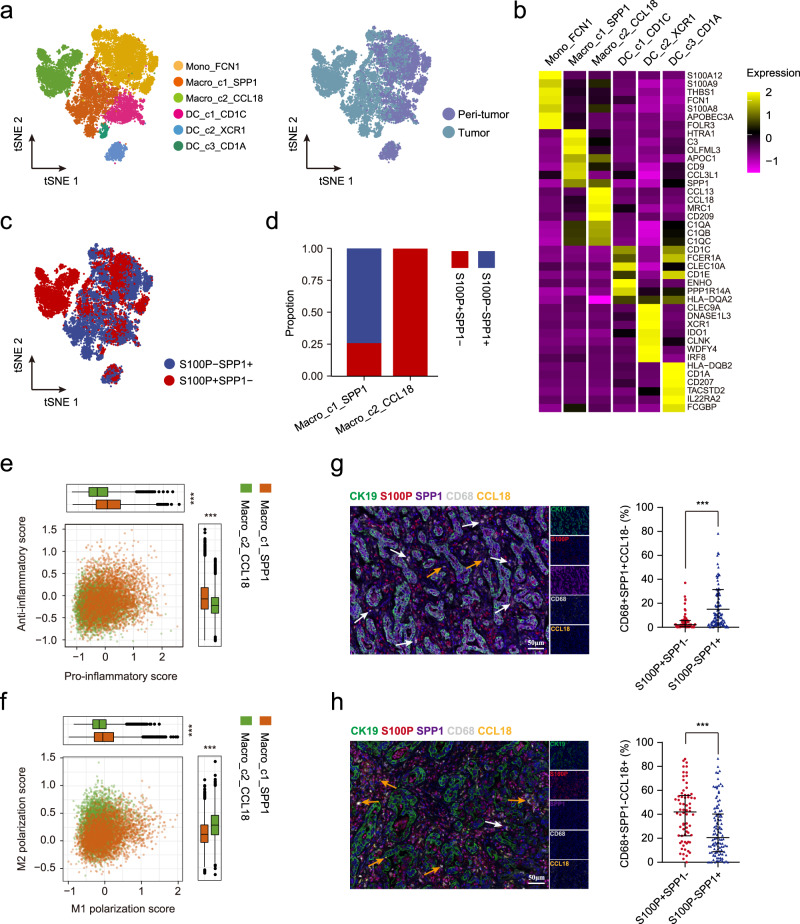
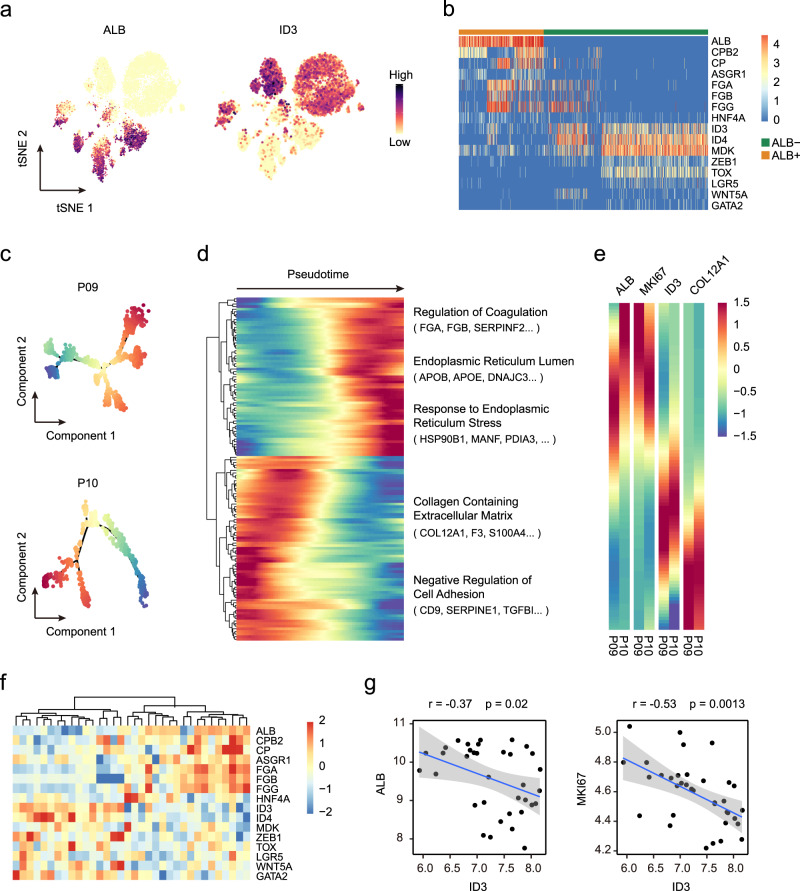
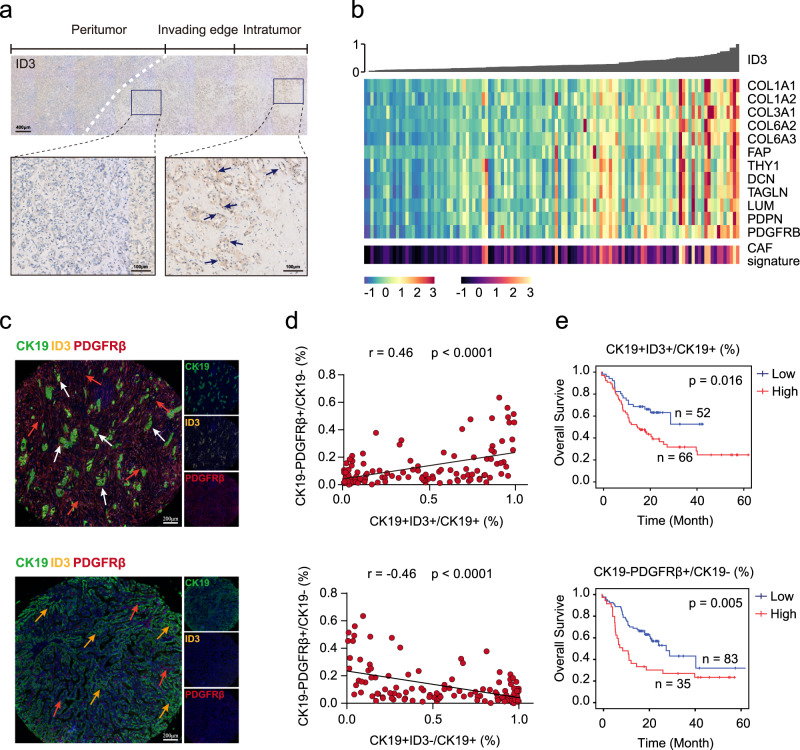
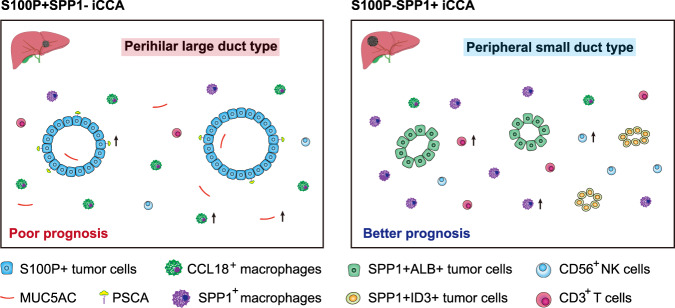
Intrahepatic cholangiocarcinoma (iCCA) is a highly heterogeneous cancer with limited understanding of its classification and tumor microenvironment. Here, by performing single-cell RNA sequencing on 144,878 cells from 14 pairs of iCCA tumors and non-tumor liver tissues, we find that S100P and SPP1 are two markers for iCCA perihilar large duct type (iCCAphl) and peripheral small duct type (iCCApps). S100P + SPP1- iCCAphl has significantly reduced levels of infiltrating CD4+ T cells, CD56+ NK cells, and increased CCL18+ macrophages and PD1+CD8+ T cells compared to S100P-SPP1 + iCCApps. The transcription factor CREB3L1 is identified to regulate the S100P expression and promote tumor cell invasion. S100P-SPP1 + iCCApps has significantly more SPP1+ macrophage infiltration, less aggressiveness and better survival than S100P + SPP1- iCCAphl. Moreover, S100P-SPP1 + iCCApps harbors tumor cells at different status of differentiation, such as ALB + hepatocyte differentiation and ID3+ stemness. Our study extends the understanding of the diversity of tumor cells in iCCA.


Conflict of interest statement

The authors declare no competing interests.

Figures

Fig. 1
Fig. 1. ScRNA-seq profiling of 14 iCCAs.
a Schematic representation of the experimental strategy. WES whole-exome sequencing, TMA tissue microarray. Part of the picture was adapted from motifolio.com. b Heatmap showing the expression of marker genes in the indicated cell types. c Chromosomal landscape of inferred large-scale copy number variations (CNVs) in nonmalignant epithelial cells (top) and malignant cells from 14 iCCA samples. Rows represent individual cells and columns represent chromosomal positions. Amplifications (red) or deletions (blue) were inferred by averaging expression over 100-gene stretches on the respective chromosomes. d t-SNE plot of malignant and nonmalignant cells from 14 iCCAs. e Boxplot showing the fraction of nonmalignant cells in peri-tumor and tumor. (Peri-tumor n = 14, Tumor n = 14; **P < 0.01; two-sided Wilcoxon matched-pairs signed-rank test; Macrophage: P = 0.00012; CD4: P = 0.0012; Treg: P = 0.00012; MAIT: P = 0.00012; Fibroblast: P = 0.0017; Endothelial: P = 0.0012). The central mark indicates the median, and the bottom and top edges of the box indicate the first and third quartiles, respectively. The top and bottom whiskers extend the boxes to a maximum of 1.5 times the interquartile range. Source data are provided as a Source Data file.
Fig. 2
Fig. 2. iCCA can be classified into two subtypes according to the expression of S100P and SPP1.
a t-SNE plot showing the expression level of S100P in malignant cells. b Proportion of positive cells with gene expression in S100P + (x-axis) and S100P- cells (y-axis). c t-SNE plot showing the expression level of SPP1 in malignant cells. d Representative images of immunohistochemical expression of S100P and SPP1 in iCCAs from TMA cohort (n = 201). Patient 1: S100P +  SPP1−, Patient 2: S100P-SPP1+. Scale bar, 100 μm. The experiment was repeated once with similar results. e Kaplan–Meier plot of the S100P + SPP1− and S100P-SPP1+ based on TMA data. Two-sided log-rank test. f The scatter diagrams showing the differences in carbohydrate antigen 19-9 (CA19-9, S100P + SPP1− n = 63, S100P-SPP1 + n = 114), carcinoembryonic antigen, (CEA, S100P + SPP1 − n = 63, S100P − SPP1 + n = 115), Ki67 (S100P + SPP1− n = 68, S100P−SPP1 + n = 118), and tumor size (S100P + SPP1− n = 68, S100P-SPP1 + n = 118) between the two groups (*P < 0.05; ***P < 0.001; two-sided Mann–Whitney U-test; CA19-9: P < 0.0001; CEA: P < 0.0001; Ki67: P = 0.025; tumor size: P = 0.019). Data were presented as median with interquartile range. g Scatterplot of S100P and SPP1 expression in Jusakul et al. dataset. A Gaussian mixture model with two mixture components was used to identify S100P +/− and SPP1 +/− patients (right and top distribution curves). Solid circles represent iCCA and open circles represent extrahepatic cholangiocarcinoma (ECC). Red represents S100P + SPP1- while blue represents S100P-SPP1+. h Graphical representation of the proportion of S100P + SPP1- and S100P-SPP1+ in iCCA and ECC. i Kaplan–Meier plot of the S100P + SPP1− and S100P-SPP1+ based on Jusakul et al. dataset. Two-sided log-rank test. Source data are provided as a Source Data file.
Fig. 3
Fig. 3. Different gene expression profiles between S100P + SPP1− and S100P-SPP1+ cells.
a Boxplot of the genomic heterogeneity (left) and transcriptomic heterogeneity (right) of S100P + SPP1−(n = 7) and S100P-SPP1 + (n = 7) iCCAs. (**P < 0.01; two-sided Wilcoxon rank-sum test; Transcriptomic heterogeneity: P = 0.0041; NS not significant). The central mark indicates the median, and the bottom and top edges of the box indicate the first and third quartiles, respectively. The top and bottom whiskers extend the boxes to a maximum of 1.5 times the interquartile range. b Top enriched pathways for genes with specific expression in S100P + SPP1− and S100P-SPP1 + cells. c Network representation of selected differentially expressed transcription factors between S100P + SPP1− and S100P-SPP1 + cells, as analyzed by SCENIC. Transcription factors in S100P + SPP1− are shown in red; transcription factors in S100P-SPP1 + are shown in blue. Bar graph showing the difference score for the selected set of differentially expressed transcription factors in S100P + SPP1− (red) and S100P-SPP1 + (blue). d Scatterplot showing the correlation of CREB3L1 expression (x-axis) with S100P expression (y-axis). Correlation is evaluated by the Spearman correlation coefficient. e The relative luciferase activity in HEK-293T cells following co-transfection with plasmid containing S100P promoter and increasing doses of the CREB3L1 expression vector (***P < 0.001; two-sided student’s t-test; CREB3L1 50 ng: P < 0.0001; 100 ng: P < 0.0001; 200 ng: P < 0.0001; n = 12 biologically independent samples). f, g Representative images of the Transwell invasion assay (f) and a statistical histogram (g) (***P < 0.001; two-sided student’s t-test; HuCCT1: P < 0.0001; RBE: P < 0.0001; n = 6 biologically independent samples). Scale bar, 100 μm. h Heatmap displaying expression levels of differentially expressed genes in Si-CREB3L1 versus Si-Ctl in HuCCT1 cells. i Top enriched pathways for downregulated genes in Si-CREB3L1 HuCCT1 cells. Si-Ctl Small interfering control (f, g, and h); NES normalized enrichment score (i). Error bars of (e and g) represent the means ± SD. Source data are provided as a Source Data file.
Fig. 4
Fig. 4. Two different subsets of macrophages infiltrated in iCCAphl and iCCApps.
a The t-SNE plot showing the subtypes of myeloid cells derived from iCCA peri-tumor and tumor. b Heatmap showing the expression of marker genes in each subtype of myeloid cells. c t-SNE plot of myeloid cells from S100P + SPP1− (red dots) and S100P-SPP1 + (blue dots). d Bar plot showing the proportion of macrophage subsets from S100P + SPP1− and S100P-SPP1+. e, f Scatterplots showing pro-/anti-inflammatory scores (e) and M1/M2 scores (f) for two macrophage subsets. Macro_c1_SPP1, n = 4016 cells; Macro_c2_CCL18, n = 3447 cells. (***P < 0.001; two-sided Wilcoxon rank-sum test; Anti-inflammatory score: P < 2.22e-16; Pro-inflammatory score: P < 2.22e-16; M2 polarization score: P < 2.22e-16; M1 polarization score: P < 2.22e-16). The central mark indicates the median, and the bottom and top edges of the box indicate the first and third quartiles, respectively. The top and bottom whiskers extend the boxes to a maximum of 1.5 times the interquartile range. g, h Representative mIHC images (left) and statistical graphs (right) to show the distribution of CD68+SPP1+CCL18 and CD68+SPP1-CCL18+ macrophages in S100P+SPP1− (g) and S100P−SPP1 + (h), respectively: CK19 (green), S100P (red), SPP1 (purple), CD68 (white), CCL18 (yellow), and DAPI (blue) (S100P + SPP1− n = 68, S100P-SPP1 + n = 112). White arrows (CD68 + SPP1 + CCL18−), yellow arrows (CD68 + SPP1−CCL18+). (***P < 0.001; two-sided Mann–Whitney U-test; CD68 + SPP1 + CCL18− (%): P < 0.0001; CD68 + SPP1-CCL18 + (%): P < 0.0001). Data were presented as median with interquartile range (g and h). Scale bar, 50 μm. Source data are provided as a Source Data file.
Fig. 5
Fig. 5. Tumor cells at different status of differentiation exist in S100P-SPP1 + iCCAs.
a t-SNE plot showing expression levels of ALB and ID3 in 7 S100P-SPP1 + iCCAs. b Heatmap showing expression levels of differentially expressed genes (rows) between ALB + and ALB- S100P-SPP1 + tumor cells (columns). c Trajectory of tumor cells from P09 and P10 separately in a two-dimensional state-space defined by Monocle. d Differentially expressed genes along the pseudo-time were clustered hierarchically into two profiles. The representative gene functions and pathways were shown. e Heatmap showing expression of representative genes. Color key from blue to red indicates relative expression levels from low to high. f Heatmap of ALB + and ALB- specific genes (rows) and hierarchical clustering result in 34 S100P-SPP1 + iCCA (columns) from Jusakul et al. dataset. g Correlation between expression of ID3 and expression of ALB and MKI67. Blue line represents the linear regression curve. The gray band represents the 95% confidence interval of the regression line. Correlation is evaluated by the two-sided Spearman correlation coefficient. Source data are provided as a Source Data file.
Fig. 6
Fig. 6. Prognostic significance of CK19 + ID3 + tumor cells in S100P-SPP1 + iCCAs.
a Representative immunostaining of ID3 in the indicated S100P-SPP1 + iCCAs. ID3 + tumor cells were predominantly located in the intratumor region. Scale bar, 400 μm (up) and 100 μm (down). Images were collected from 17 additional iCCA slides that contained both tumor and corresponding paracancerous tissues. The experiment was repeated once with similar results. b Correlation between ID3 expression and CAFs. iCCA from Jusakul et al.’s dataset were ordered by their ID3 expression level as shown by bar plot (top). Heatmap (middle) showing expression levels of selected CAF markers (rows) for each tumor (columns). Colored bar (bottom) showing the CAFs score estimated by MCP-Counter of each tumor. c Representative mIHC images showing the distribution of CK19 + ID3 + , CK19 + ID3- tumor cells and CK19-PDGFRβ + cells in S100P-SPP1 + iCCA (n = 118) from TMA cohort: CK19 (green), ID3 (yellow), PDGFRβ (red), and DAPI (blue). White arrows (CK19 + ID3 + ), yellow arrows (CK19 + ID3−), red arrows (CK19-PDGFRβ+). The experiment was repeated once with similar results. Scale bar, 200 μm. d Correlation analysis between the proportion of CK19 + ID3 + (up) and CK19 + ID3- (down) within CK19 + tumor cells and the proportion of CK19-PDGFRβ + cells within CK19− cells per core, respectively. (Two-sided spearman correlation coefficient). e Kaplan–Meier analysis of overall survival (OS) in S100P-SPP1 + iCCA tumors according to the proportion of CK19 + ID3 + within CK19+ tumor cells (up) and CK19-PDGFRβ + within CK19− cells (down) in the TMA cohort. Two-sided log-rank test. Source data are provided as a Source Data file.
Fig. 7
Fig. 7. Schematics for the classification of iCCA. Two major subtypes of iCCA were identified in this study.
Morphological features, cellular component, immune infiltration, and prognosis varied significantly between these two iCCA subtypes. Part of the picture was adapted from motifolio.com.

References

    1. Valle JW, Lamarca A, Goyal L, Barriuso J, Zhu AX. New horizons for precision medicine in biliary tract cancers. Cancer Disco. 2017;7:943–962. - PMC - PubMed
    1. Nakanuma, Y., Klimstra, D., Komuta, M. & Zen, Y. in WHO Classification of Tumours: Digestive System Tumours 5th edn (ed. WHO Classification of Tumors Editorial Board.) 8, 254–259 (World Health Organization, 2019).
    1. Banales JM, et al. Cholangiocarcinoma 2020: the next horizon in mechanisms and management. Nat. Rev. Gastroenterol. Hepatol. 2020;17:557–588. - PMC - PubMed
    1. Kendall T, et al. Anatomical, histomorphological and molecular classification of cholangiocarcinoma. Liver Int. 2019;39:7–18. - PubMed
    1. Aishima S, Oda Y. Pathogenesis and classification of intrahepatic cholangiocarcinoma: different characters of perihilar large duct type versus peripheral small duct type. J. Hepatobiliary Pancreat. Sci. 2015;22:94–100. - PubMed

Publication types

MeSH terms