. 2022 Mar 28;13(1):1637.
doi: 10.1038/s41467-022-29183-x.

Genetic variation of macronutrient tolerance in Drosophila melanogaster

Affiliations

Genetic variation of macronutrient tolerance in Drosophila melanogaster

E Havula et al. Nat Commun. .

Abstract

Carbohydrates, proteins and lipids are essential nutrients to all animals; however, closely related species, populations, and individuals can display dramatic variation in diet. Here we explore the variation in macronutrient tolerance in Drosophila melanogaster using the Drosophila genetic reference panel, a collection of ~200 strains derived from a single natural population. Our study demonstrates that D. melanogaster, often considered a "dietary generalist", displays marked genetic variation in survival on different diets, notably on high-sugar diet. Our genetic analysis and functional validation identify several regulators of macronutrient tolerance, including CG10960/GLUT8, Pkn and Eip75B. We also demonstrate a role for the JNK pathway in sugar tolerance and de novo lipogenesis. Finally, we report a role for tailless, a conserved orphan nuclear hormone receptor, in regulating sugar metabolism via insulin-like peptide secretion and sugar-responsive CCHamide-2 expression. Our study provides support for the use of nutrigenomics in the development of personalized nutrition.


Conflict of interest statement

The authors declare no competing interests.

Figures
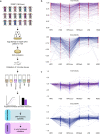
Fig. 1
Fig. 1. Experimental outline and survival of DGRP across the six diets.
a The experimental outline. 196 lines of the Drosophila melanogaster genetic reference panel (DGRP) were raised on six different diets: high-protein (HPD), high-sugar (HSD), high-fat-coconut-oil (HFDcoco), high-fat-lard (HFDlard), Western (WD), and high-starch (HStD). First-instar larvae were collected onto the diets in a controlled density of 30 larvae per vial, and at four replicate vials per diet. The experiment was run in cohorts of 10 strains (all diets at the same time). Pupation was monitored daily to establish pupation kinetics of each strain across the diets and finally total eclosion was scored two weeks after. HPD was composed of 10% (w/v) dry baker’s yeast, and the other diets had the same amount of yeast as a base. HSD was supplemented with 20% (w/v) sucrose, HFDcoco with 20% (w/v) coconut oil, HFDlard with 20% (w/v) lard, WD with 10% (w/v) sucrose and 10% (w/v) lard, and HStD with 20% (w/v) potato starch. b Survival of the 196 DGRP strains to pupal stage (pupation) and to adult (eclosion) across the six diets. Pupation rate standard deviations (among lines) of 0.194 (HSD), 0.188 (HFDcoco), 0.162 (WD), 0.145 (HPD), 0.144 (HFDlard), and 0.140 (HStD). Eclosion rate standard deviations (among lines) of 0.211 (HSD), 0.203 (HFDcoco), 0.166 (HPD), 0.138 (HStD), 0.099 (HFDlard), and 0.092 (WD). c HPD-normalized survival of the 196 DGRP strains to pupal stage (pupation) and to adult (eclosion) across the other five diets. Source data are provided as a Source Data file.
Fig. 2
Fig. 2. Diet-dependent survival of DGRP strains into pupae.
a A heatmap showing the survival of the 196 DGRP strains into pupal stage across six different diets. b Pupation kinetics of selected DGRP strains. The numbers after DGRP strain IDs correspond to the ones indicated in the heatmap, n = 4 vials (each with 30 larvae) per diet and genotype. dAEL = days after egg laying. Source data are provided as a Source Data file.
Fig. 3
Fig. 3. In vivo functional validation screen.
a A schematic outline of the functional validation screen. Please see FlyBase for further information: https://flybase.org/. b A table presenting the number of genes identified with one or multiple SNPs associated with altered survival, the number of genes tested in functional validation screen, and the number of genes validated in the screen. c Plots for relative pupation and eclosion (HSD/HPD) of candidate genes. The dashed lines (0.5 for pupation and 0.15 for eclosion) present the chosen cut-off values. d Plots for relative pupation and eclosion (HFDcoco/HPD) of candidate genes. The dashed lines (0.5 for pupation and 0.15 for eclosion) present the chosen cut-off values. n = 2–3 vials (each with 30 larvae) per diet and genotype.
Fig. 4
Fig. 4. Tissue-specific metabolic phenotypes of the HSD hits.
a The relative point (normalized to control) at which 50% of larvae pupated under tissue-specific knockdowns (Cg-GAL4, Mef2-GAL4 and NP1-GAL4) of HSD hits. n = minimum of 3 vials (each with 30 larvae) per diet and genotype. Error bars display SD. See Source Data file for statistical analyses and exact p-values. b Relative resting rate of energy metabolism (mJ h−1) of Cg-GAL4 knockdown of HSD hits (normalized to control HPD), n = minimum of 3 flies per diet and genotype. Error bars display SD. Statistical significances were calculated using the two-way ANOVA in conjunction with Dunnett’s multiple comparisons test (by genotype) and with Šídák’s multiple comparisons test (by diet). Data are presented as mean values +/− SD. * p = 0.0348 (Dunnett’s multiple comparisons test), # p = 0.004 (Šídák’s multiple comparisons test). Source data are provided as a Source Data File.
Fig. 5
Fig. 5. CG10960/GLUT8, Pkn, and Eip75B regulate sugar tolerance in Drosophila.
a Pupation kinetics of CG10960/GLUT8 RNAi and Trip control (Tub-GAL4 > ) animals on six different diets, n = minimum of 3 vials (each with 30 larvae) per diet and genotype. b Circulating glucose levels of CG10960/GLUT8 RNAi and Trip control (Ubi-GAL4 > ) larvae on HPD and HSD (10% sucrose), n = minimum of 7 (each with 15 larvae) per diet and genotype. c Pupation kinetics of Pkn RNAi and kk control (Tub-GAL4 > ) animals on six different diets, n = 3 vials (each with 30 larvae) per diet and genotype. d Whole-body expression of Pkn, FAS, ACC, and sugarbabe in control and Pkn RNAi (Tub-GAL4>) larvae after transient (8 h) HSD feeding (HSDind), n = 4 (five second-instar larvae per sample) per diet and genotype. e Pupation kinetics of Eip75B RNAi (Tub-GAL4>) animals on six different diets, n = 3 vials (each with 30 larvae) per diet and genotype. f Whole-body expression of Eip75B, FAS, ACC and sugarbabe in control and Eip75B RNAi (Tub-GAL4>) larvae after transient (8 h) HSD feeding (HSDind), n = 4 (five second-instar larvae per sample) per diet and genotype. Statistical significances were calculated using the two-way ANOVA in conjunction with Tukey’s multiple comparisons test (b) or unpaired two-tailed Student’s t test assuming unequal variances (d and f). Data are presented as mean values +/− SD. Source data are provided as a Source Data File.
Fig. 6
Fig. 6. JNK signalling is required for dietary sugar tolerance and DNL.
a JNK pathway is well-conserved in Drosophila. b Knockdown of wengen (wgn), grindelwald (Grnd), TNF-receptor-associated factor 6 (Traf2/6), sigmar, misshapen, TAK1-associated binding protein 2 (Tab2), TGF-β activated kinase 1 (Tak1), hemipterous (hep), basket (bsk) and kayak (kay), all lead to a significantly reduced survival on HSD. # = significantly lower survival on HSD vs. HPD (within genotype). n = minimum of 3 vials (each with 30 larvae) per diet and genotype. Data for control animals (Tub-GAL4> kk control 60100, Tub-GAL4> GD control 6000, Tub-GAL4> Trip control 36303, Ubi-GAL4> kk control 60100 and Ubi-GAL4> Trip control 36303), is pooled in the figure. Statistical significances for each knockdown were however calculated against their respective library control line. Statistical significances were calculated using the two-way ANOVA in conjunction with Dunnett’s multiple comparisons test (by genotype) and with Šídák’s multiple comparisons test (by diet). * p < 0.05, ** p < 0.01, *** p < 0.001 (Dunnett’s multiple comparisons test), # p < 0.05 (Šídák’s multiple comparisons test). See Source Data file for exact p-values. c Whole-body expression of FAS and ACC in control and sigmar RNAi (Tub-GAL4>) larvae after transient (8 h) HSD feeding (HSDind), n = 4 (five second-instar larvae per sample) per diet and genotype. Statistical significances were calculated using an unpaired Student’s t test assuming unequal variances. Data are presented as mean values +/− SD. Source data are provided as a Source Data File.
Fig. 7
Fig. 7. Tailless, a nuclear orphan hormone receptor, regulates dietary sugar tolerance in the fat body.
a Pupation kinetics of control and tailless (tll) knockdown (Cg-GAL4>) animals on HPD and HSD, n = 3 vials (each with 30 larvae) per diet and genotype. Circulating glucose (b) and relative trehalose (c) levels in haemolymph of control and tll knockdown (Cg-GAL4>) pre-wandering third-instar larvae raised on HPD or HSD. n = 4 (each with 10 larvae) per diet and genotype. d Triglyceride levels of control and tll knockdown (Cg-GAL4>) pre-wandering third-instar larvae raised on HPD or HSD. n = minimum of 3 (each with 10 larvae) per diet and genotype. e Pupal volumes of control and tll knockdown (Cg-GAL4>) raised on HPD and HSD, n = 30 per diet and genotype. f Food consumed by control and tll knockdown (Cg-GAL4>) pre-wandering third-instar larvae on HPD and HSD, n = minimum of 3 (each with 10 larvae) per diet and genotype. g dILP2 accumulation measured by immunostaining of control and tll knockdown (Cg-GAL4>) pre-wandering third-instar larvae raised on a standard laboratory diet, n = 11 per genotype. h mRNA levels of CCHa2 in fat bodies of control and tll knockdown (Cg-GAL4 >) pre-wandering third-instar larvae after transient (8 h) HSD feeding as measured by quantitative RT-PCR. CDK7 was used as a reference gene, n = 4 (3 fat bodies per sample) per diet and genotype. i Pupation kinetics of control and CCHa2 mutant larvae on HPD and HSD, n = minimum of 3 vials (each with 30 larvae) per diet and genotype. j Pupal volumes of control and CCHa2 mutants raised on HPD and HSD, n = 20 per diet and genotype. Statistical significances were calculated using the two-way ANOVA in conjunction with Tukey’s multiple comparisons test (bf, h, and j) or two-tailed Mann–Whitney U-test (g). p-values < 0.05 were used to denote a significant result. Data are presented as mean values +/− SD (ad, f, hi) or as mean values +/− SE (e, g, j). Source data are provided as a Source Data File.
Fig. 8
Fig. 8. Comparison of hits to human SNP data associated to diabetes phenotypes.
The majority of the human homologues of the identified hits are associated with T2D related traits. T2D knowledge portal (https://www.type2diabetesgenetics.org/).

Similar articles

Cited by

References

    1. Efeyan A, Comb WC, Sabatini DM. Nutrient-sensing mechanisms and pathways. Nature. 2015;517:302–310. - PMC - PubMed
    1. Havula E, Hietakangas V. Sugar sensing by ChREBP/Mondo-Mlx-new insight into downstream regulatory networks and integration of nutrient-derived signals. Curr. Opin. Cell Biol. 2018;51:89–96. - PubMed
    1. Mattila J, et al. Mondo-Mlx mediates organismal sugar sensing through the Gli-similar transcription factor sugarbabe. Cell Rep. 2015;13:350–364. - PubMed
    1. Bartok O, et al. The transcription factor Cabut coordinates energy metabolism and the circadian clock in response to sugar sensing. EMBO J. 2015;34:1538–1553. - PMC - PubMed
    1. Havula, E. & Hietakangas, V. Glucose sensing by ChREBP/MondoA-Mlx transcription factors. Semin. Cell Dev. Biol.10.1016/j.semcdb.2012.02.007 (2012). - PubMed

Publication types

LinkOut - more resources