

Rational design and synthesis of a novel BODIPY-based probe for selective imaging of tau tangles in human iPSC-derived cortical neurons
- PMID: 35347170
- PMCID: PMC8960764
- DOI: 10.1038/s41598-022-09016-z
Rational design and synthesis of a novel BODIPY-based probe for selective imaging of tau tangles in human iPSC-derived cortical neurons
Abstract
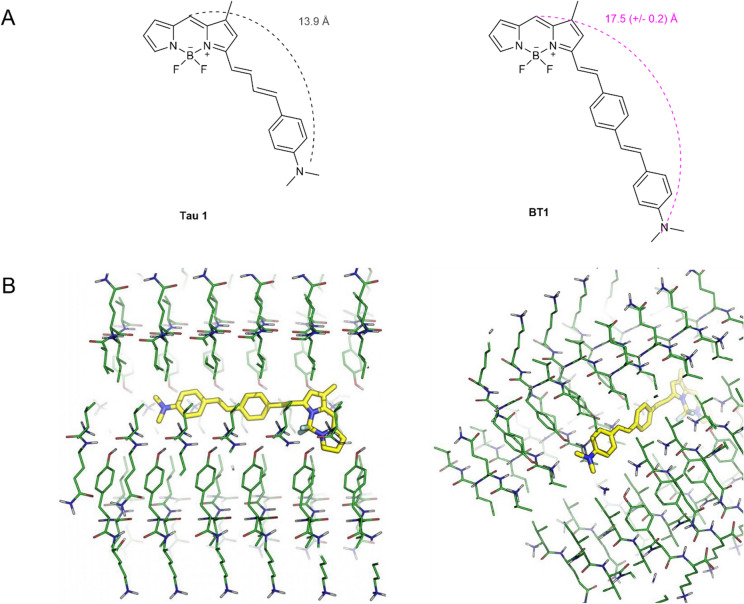
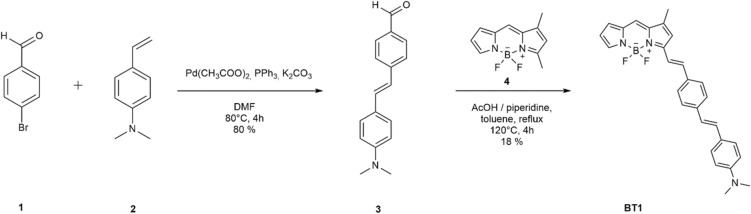
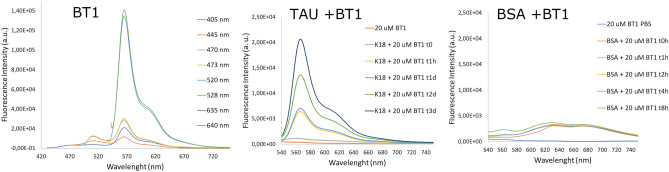
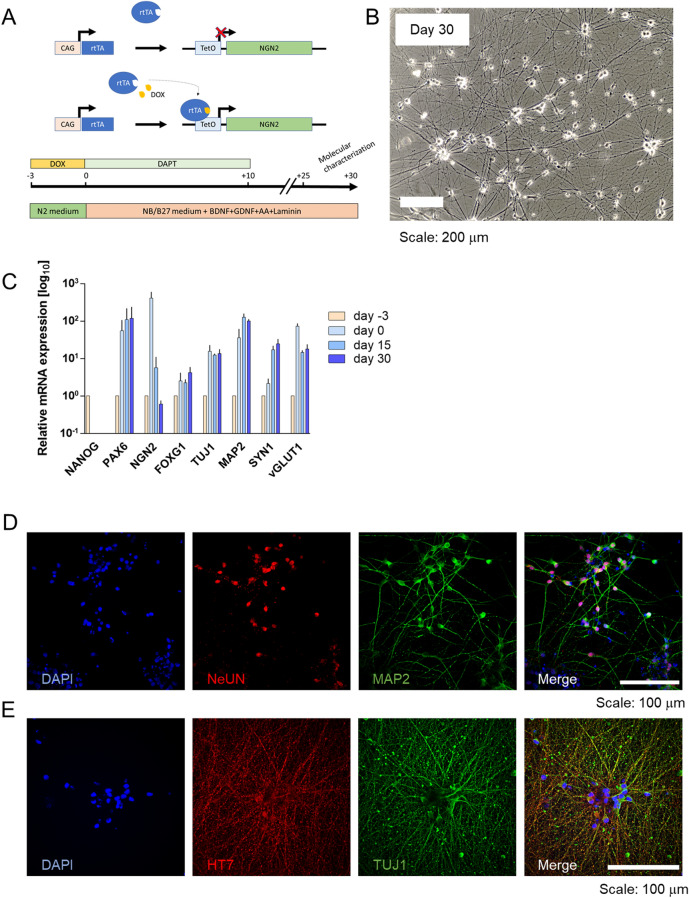
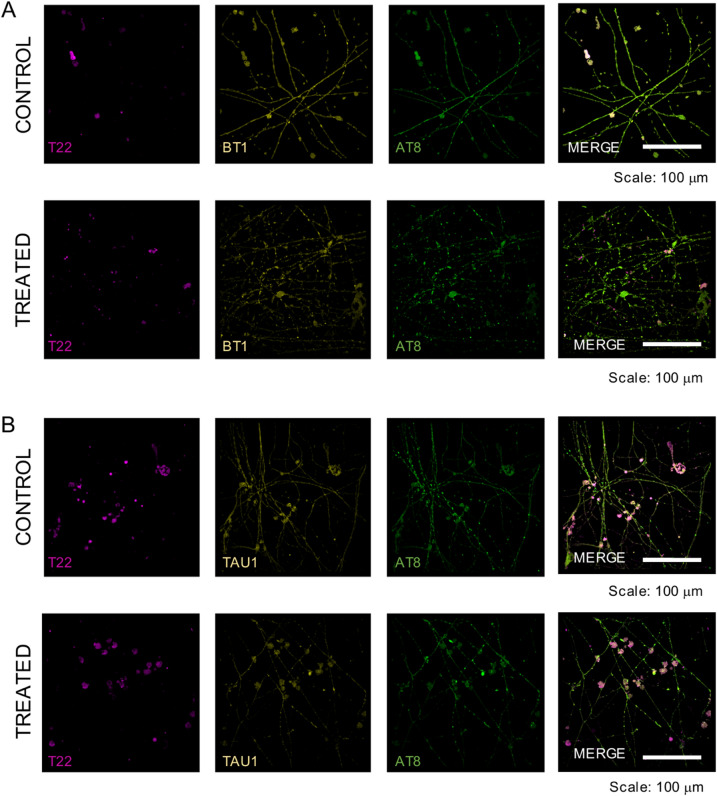
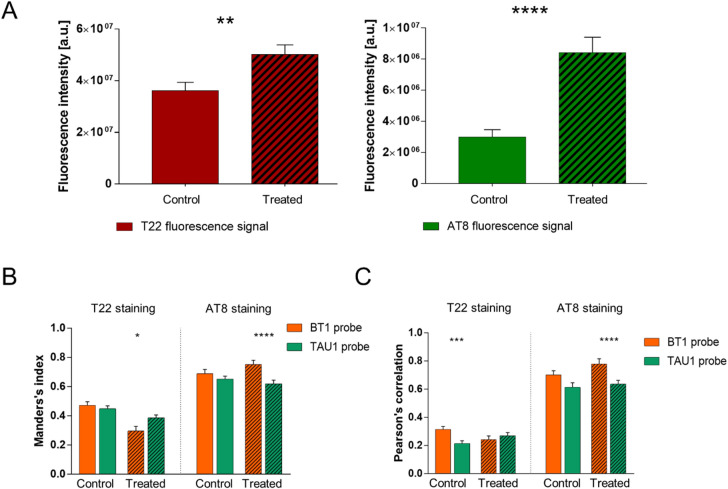
Numerous studies have shown a strong correlation between the number of neurofibrillary tangles of the tau protein and Alzheimer's disease progression, making the quantitative detection of tau very promising from a clinical point of view. However, the lack of highly reliable fluorescent probes for selective imaging of tau neurofibrillary tangles is a major challenge due to sharing similar β-sheet motifs with homologous Amyloid-β fibrils. In the current work, we describe the rational design and the in silico evaluation of a small-size focused library of fluorescent probes, consisting of a BODIPY core (electron acceptor) featuring highly conjugated systems (electron donor) with a length in the range 13-19 Å at C3. Among the most promising probes in terms of binding mode, theoretical affinity and polarity, BT1 has been synthesized and tested in vitro onto human induced pluripotent stem cells derived neuronal cell cultures. The probe showed excellent photophysical properties and high selectivity allowing in vitro imaging of hyperphosphorylated tau protein filaments with minimal background noise. Our findings offer new insight into the structure-activity relationship of this class of tau selective fluorophores, paving the way for boosting tau tangle detection in patients possibly through retinal spectral scans.
© 2022. The Author(s).
Conflict of interest statement
The authors declare no competing interests.
Figures
Similar articles
-
Fluorescent BODIPY-based Zn(II) complex as a molecular probe for selective detection of neurofibrillary tangles in the brains of Alzheimer's disease patients.J Am Chem Soc. 2009 May 13;131(18):6543-8. doi: 10.1021/ja9008369. J Am Chem Soc. 2009. PMID: 19368380
-
Rational Design of in Vivo Tau Tangle-Selective Near-Infrared Fluorophores: Expanding the BODIPY Universe.J Am Chem Soc. 2017 Sep 27;139(38):13393-13403. doi: 10.1021/jacs.7b05878. Epub 2017 Sep 15. J Am Chem Soc. 2017. PMID: 28857559
-
In vitro comparison of major memory-support dietary supplements for their effectiveness in reduction/inhibition of beta-amyloid protein fibrils and tau protein tangles: key primary targets for memory loss.Sci Rep. 2021 Feb 15;11(1):3001. doi: 10.1038/s41598-020-79275-1. Sci Rep. 2021. PMID: 33589649 Free PMC article.
-
Mechanisms of neurofibrillary degeneration and the formation of neurofibrillary tangles.J Neural Transm Suppl. 1998;53:169-80. doi: 10.1007/978-3-7091-6467-9_15. J Neural Transm Suppl. 1998. PMID: 9700655 Review.
-
[Development of SPECT Probes for In Vivo Imaging of β-Amyloid and Tau Aggregates in the Alzheimer's Disease Brain].Yakugaku Zasshi. 2017;137(11):1361-1365. doi: 10.1248/yakushi.17-00156. Yakugaku Zasshi. 2017. PMID: 29093372 Review. Japanese.
Cited by
-
TDP-43 as a potential retinal biomarker for neurodegenerative diseases.Front Neurosci. 2025 Feb 12;19:1533045. doi: 10.3389/fnins.2025.1533045. eCollection 2025. Front Neurosci. 2025. PMID: 40012679 Free PMC article. Review.
-
Recent Research Progress in Fluorescent Probes for Detection of Amyloid-β In Vivo.Biosensors (Basel). 2023 Nov 19;13(11):990. doi: 10.3390/bios13110990. Biosensors (Basel). 2023. PMID: 37998165 Free PMC article. Review.
-
Optical signature of retinal Tau fibrillation.Sci Rep. 2025 Mar 6;15(1):7792. doi: 10.1038/s41598-025-92565-w. Sci Rep. 2025. PMID: 40044873 Free PMC article.
-
Stochastically structured illumination microscopy scan less super resolution imaging.Npj Imaging. 2024;2(1):45. doi: 10.1038/s44303-024-00047-x. Epub 2024 Nov 6. Npj Imaging. 2024. PMID: 39525281 Free PMC article.
-
Short-chain polyphosphates induce tau fibrillation and neurotoxicity in human iPSC-derived retinal neurons.Cell Death Dis. 2025 May 9;16(1):369. doi: 10.1038/s41419-025-07662-5. Cell Death Dis. 2025. PMID: 40346074 Free PMC article.
References
-
- Graham WV, Bonito-Oliva A, Sakmar TP. Update on Alzheimer’s disease therapy and prevention strategies. Ann. Rev. Med. 2017;68:413–430. - PubMed
-
- Masters, C. L. et al. Alzheimer’s disease. Nature Reviews Disease Primers1, (2015). - PubMed
-
- Delacourte A, Sergeant N, Wattez A, Gauvreau D, Robitaille Y. Vulnerable neuronal subsets in Alzheimer’s and Pick’s disease are distinguished by their ? isoform distribution and phosphorylation. Ann. Neurol. 1998;43:193–204. - PubMed
-
- Olsson, B. et al. CSF and blood biomarkers for the diagnosis of Alzheimer’s disease: a systematic review and meta-analysis. The Lancet Neurology15, (2016). - PubMed
-
- Pietrzak, K., Czarnecka, K., Mikiciuk-Olasik, E. & Szymanski, P. New perspectives of Alzheimer disease diagnosis – the most popular and future methods. Med. Chem.14, (2018). - PubMed
Publication types
MeSH terms
Substances
Grants and funding
LinkOut - more resources
Full Text Sources
Miscellaneous
