. 2022 Mar 28;5(1):274.
doi: 10.1038/s42003-022-03215-0.

Artemisinin resistance in the malaria parasite, Plasmodium falciparum, originates from its initial transcriptional response

Affiliations

Artemisinin resistance in the malaria parasite, Plasmodium falciparum, originates from its initial transcriptional response

Lei Zhu et al. Commun Biol. .

Abstract

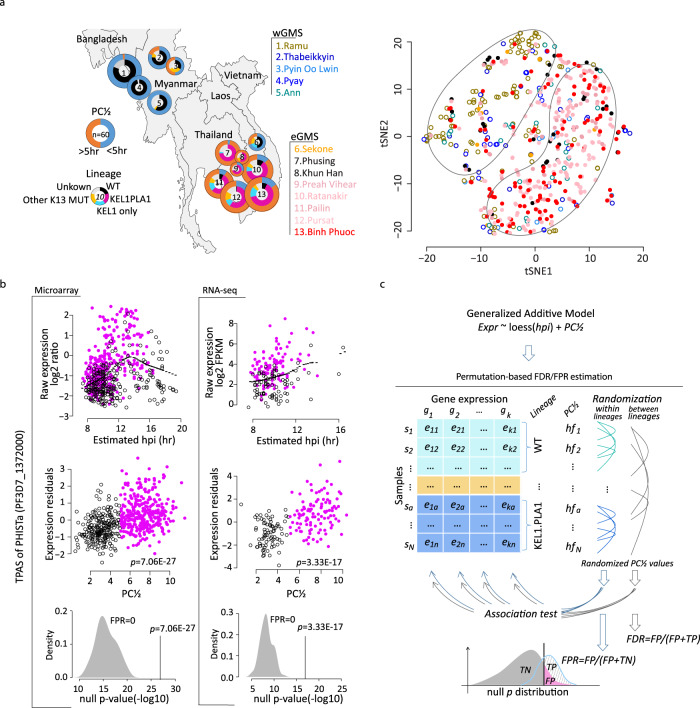
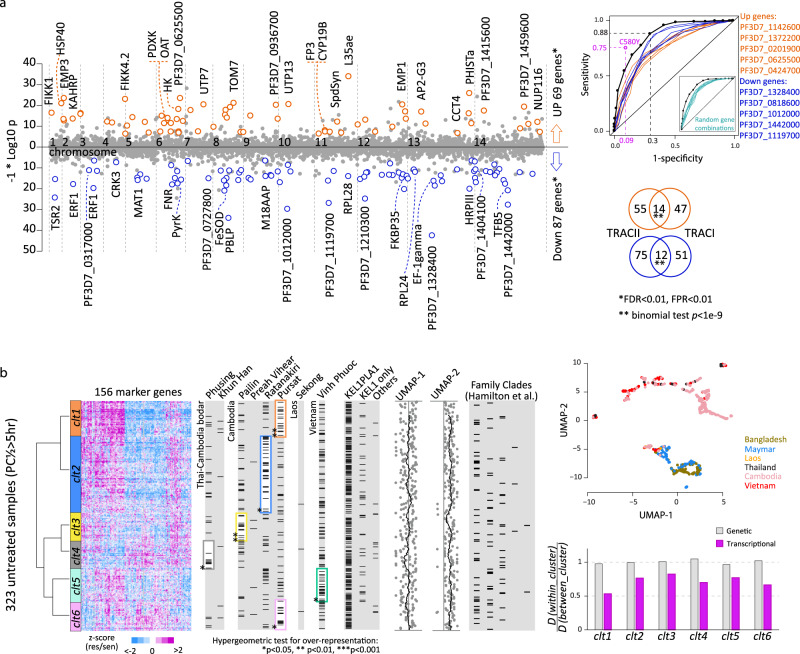
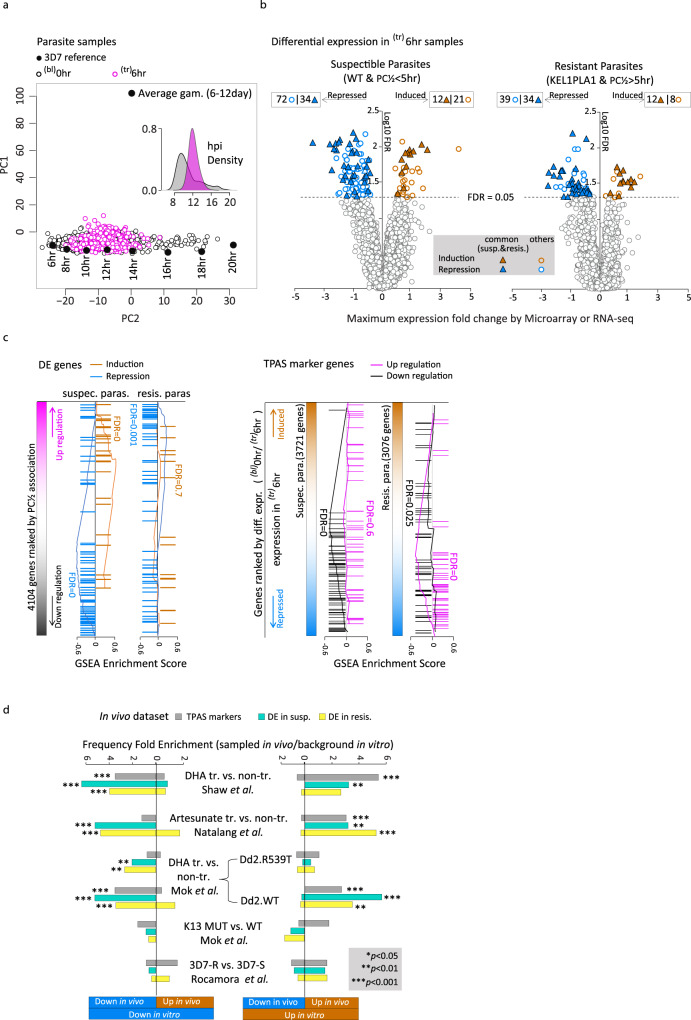
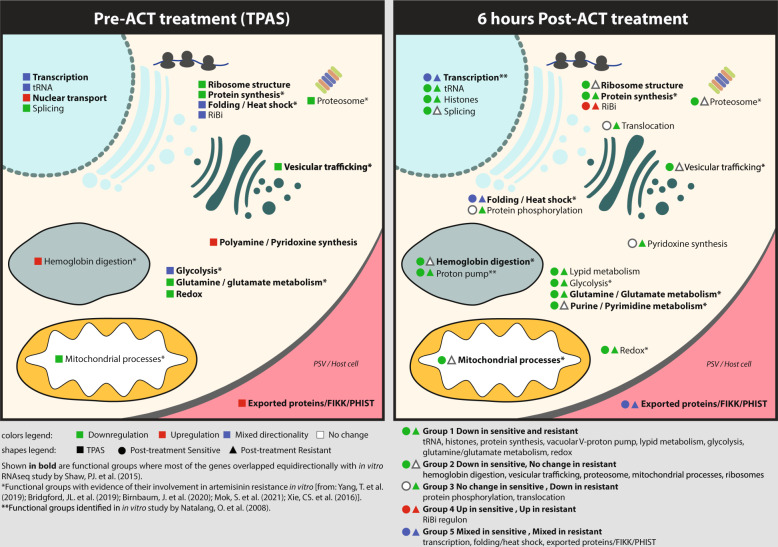
The emergence and spread of artemisinin-resistant Plasmodium falciparum, first in the Greater Mekong Subregion (GMS), and now in East Africa, is a major threat to global malaria elimination ambitions. To investigate the artemisinin resistance mechanism, transcriptome analysis was conducted of 577 P. falciparum isolates collected in the GMS between 2016-2018. A specific artemisinin resistance-associated transcriptional profile was identified that involves a broad but discrete set of biological functions related to proteotoxic stress, host cytoplasm remodelling, and REDOX metabolism. The artemisinin resistance-associated transcriptional profile evolved from initial transcriptional responses of susceptible parasites to artemisinin. The genetic basis for this adapted response is likely to be complex.


Conflict of interest statement

Authors declare no competing interests.

Figures

Fig. 1
Fig. 1. Transcriptome of TRACII P. falciparum parasite population and a schematic illustration of the TPAS methodology.
a Geographic distribution of all samples used in this study. Pie charts represent the proportion of slow (PC½ > 5 h) and fast (PC½ < 5 h) clearing parasites, or lineages in categories based on PfK13 mutations and plasmepsin II/III copy numbers (WT, KEL1 only, KEL1PLA1, other PfK13 MUT and unknown). On the right, 577 samples before drug treatment are plotted to display two main clusters formed by the eGMS or wGMS parasites geographical distribution using t-SNE algorithm based on the top 2-12 PCs. b TPAS explanation using an example gene of PHISTa (PF3D7_1372000). The expression-hpi/age relationship is shown as the raw expression level (log2 ratio) plotted against the estimated hpi for the microarray data on the left (577 samples) and RNA-seq data on the right (188 samples) with purple dots representing resistant parasites (PC½ > 5 h), black circles for susceptible parasites (PC½ < 5 h) and black dotted lines for the loess curve using all dots. The expression-resistance relationship is represented by the expression residuals plotted against the PC½ for each data set. The density plots at the bottom represent 100 times permutation result within lineages for the FPR calculation. c Workflow of FDR and FPR estimation for the TPAS. The null p distribution was built using permutated resistance status (PC½ values) across parasite samples within lineages for FPR estimation and between lineages for multiple testing correction.
Fig. 2
Fig. 2. Transcriptional resistance markers.
a The scatter plot represents all studied genes along the genomic coordinates on the X-axis with their resistance-association p-values displayed as -log10 p on the Y-axis. Genes passing the threshold (FDR < 0.05, FPR < 0.05) are highlighted in 69 orange circles (upregulation) and 87 blue circles (downregulation). The ROC plot shows the ability to distinguish resistant and susceptible parasites in TRACII for 5 upregulated genes (orange) and 5 downregulated genes (blue) with the best performance. Their gene IDs are shown on the side from top to bottom for the line from left corner to the centre of the plot. The black line with dots represents the distinguishing ability of the combination of all the 156 genes which was calculated as the sum up of expression values of the 69 upregulations with a subtraction of the sum up of the 87 downregulations. It is compared to the roc of randomly selected gene set on the bottom right (see “Methods”). The Venn diagrams show the overlap of TPAS results between the TRACII and TRACI studies. b A heatmap represents the transcriptional profiles clustering for 323 eGMS (bl)0 h samples showing prolonged PC½( > 5 h) based on the 156 resistance markers. The colour (purple to blue) indicates the level of differential expression (upregulation to downregulation) in the resistant parasites. The left dendrogram represents Ward’s clustering result and the colour bars represent the 6 clusters obtained by clustering tree cutting. On the right, samples in each column (marked by black bars) are categorized by their respective sites or lineages, or population structure. Frames mark the overrepresentations of categorized samples in the corresponding clusters. *p < 0.05, **p < 0.01 and ***p < 0.001. The scatter plot represents the population structure of the whole GMS samples, and the bar plot represents the ratio of distance between within-clusters individuals and between-clusters individuals (see “Methods”).
Fig. 3
Fig. 3. In vivo transcriptional response to artemisinins.
a The principal components space of PC1 vs. PC2 was constructed by the PCA on reference transcriptomes of the laboratory strain 3D7 at ring stage and gametocyte stages (average of the day 5th–12th). It was used to visualize transcriptome differences driven by parasite age/hpi or developmental stage (asexual/sexual). The 577 (bl)0 h (black circles) and 459 (tr)6 h (purple circles) samples are projected onto this space to show their age differences. The density plot represents the estimated hpi distribution for (bl)0 hr (grey) and tr)6 hr (purple) parasites. b Volcano plot represents each gene’s association p value of differential expression against the average expression fold change between the (tr)6 h and (bl)0 h parasites for the susceptible group (left, WT with PC½ < 5 h) and the resistant group (right, KELPLA1 with PC½ > 5 h) respectively. c Genes differentially expressed as upregulation/induction (orange) and downregulation/repression (blue) are marked along the rank of their association to PC½ (from TPAS). Markers associated with PC½ positively (purple) or negatively (black) are marked along the rank of their differential expression levels (from b). GSEA was applied to estimate the FDR for ranking bias to either side of upregulation/induction or downregulation/repression. d Bar plots represent significant overlaps between our in vivo study and other independent in vitro studies, In vivo: baseline TPAS analysis ((bl)0 h, 156 resistant markers, grey); post-treatment differentially expressed genes ((tr)6 h/(bl)0 h) in susceptible (turquoise) and resistant parasites (yellow) group, In vitro: transcriptional response to DHA treatment in the K1 rings; Artesunate treatment in the FCR3 strain; DHA treatment in the Dd2 R539T or WT stain; differential expression at the baseline level between the PfK13 MUT and WT stains as well as that between lab-derived ART-resistant and ART-sensitive 3D7 ring parasites. Stars mark intersections having > 3 genes with hypergeometric test p < 0.05. .
Fig. 4
Fig. 4. Functional assignment of resistance markers.
Functional assignments of transcriptional artemisinin resistance markers derived from TPAS analysis at baseline-level ((bl)0 h) and that of genes repressed/induced after 6 h of ACT treatment ((tr)6 h). Colours represent transcriptome directionality for each group. The association with previous independent in vitro studies is also shown.

References

    1. World malaria report 2019. Geneva: World Health Organization; 2019. Licence:CC BY-NC-SA 3.0 IGO.
    1. van der Pluijm, R. W. et al. Triple artemisinin-based combination therapies versus artemisinin-based combination therapies for uncomplicated Plasmodium falciparum malaria: a multicentre, open-label, randomised clinical trial. Lancet395, P1345–1360 (2020). - PMC - PubMed
    1. Phyo AP, et al. Declining efficacy of artemisinin combination therapy against P. Falciparum malaria on the Thai-Myanmar border (2003–2013): The role of parasite Genetic Factors. Clin. Infect. Dis. 2016;63:784–791. - PMC - PubMed
    1. Uwimana A, et al. Emergence and clonal expansion of in vitro artemisinin-resistant Plasmodium falciparum kelch13 R561H mutant parasites in Rwanda. Nat. Med. 2020;26:1602–1608. - PMC - PubMed
    1. Chotivanich K, et al. Laboratory detection of artemisinin-resistant Plasmodium falciparum. Antimicrob. Agents Chemother. 2014;58:3157–3161. - PMC - PubMed

Publication types