. 2022 May;6(5):555-564.
doi: 10.1038/s41559-022-01705-2. Epub 2022 Mar 28.

Intra- and interpopulation transposition of mobile genetic elements driven by antibiotic selection

Affiliations

Intra- and interpopulation transposition of mobile genetic elements driven by antibiotic selection

Yi Yao et al. Nat Ecol Evol. 2022 May.

Abstract

The spread of genes encoding antibiotic resistance is often mediated by horizontal gene transfer (HGT). Many of these genes are associated with transposons, a type of mobile genetic element that can translocate between the chromosome and plasmids. It is widely accepted that the translocation of antibiotic resistance genes onto plasmids potentiates their spread by HGT. However, it is unclear how this process is modulated by environmental factors, especially antibiotic treatment. To address this issue, we asked whether antibiotic exposure would select for the transposition of resistance genes from chromosomes onto plasmids and, if so, whether antibiotic concentration could tune the distribution of resistance genes between chromosomes and plasmids. We addressed these questions by analysing the transposition dynamics of synthetic and natural transposons that encode resistance to different antibiotics. We found that stronger antibiotic selection leads to a higher fraction of cells carrying the resistance on plasmids because the increased copy number of resistance genes on multicopy plasmids leads to higher expression of those genes and thus higher cell survival when facing antibiotic selection. Once they have transposed to plasmids, antibiotic resistance genes are primed for rapid spread by HGT. Our results provide quantitative evidence for a mechanism by which antibiotic selection accelerates the spread of antibiotic resistance in microbial communities.


Conflict of interest statement

Competing Interests statement

None of the authors have competing financial or non-financial interests.

Figures
Extended Data Fig. 1
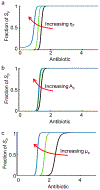
Extended Data Fig. 1. Transposition dynamics, in response to antibiotic selection, is robust to variation in transposition rates (ηT), half-maximal effective concentration (Ap) and growth rate (μp) of Sp.
All simulations here ensure that the core assumptions of our mechanism are satisfied: Sc grows faster than Sp in the absence of the antibiotic, but the latter grows faster at a sufficiently high antibiotic concentration. All parameters are kept the same as in Fig. 1, unless noted otherwise. a, Transposition dynamics for varying ηT: 0.01 (blue), 10−4 (green), and 10−6 (black). b, Transposition dynamics for varying Ap: 20 (blue), 10 (green), and 5 (black). c, Transposition dynamics for varying μ p: 0.5 (blue), 0.4 (green), and 0.3 (black).
Extended Data Fig. 2
Extended Data Fig. 2. Transposition dynamics depends on how Sc and Sp are individually affected by the antibiotic treatment.
In Fig. 1, we considered the case where (1) Sc grows faster than Sp in the absence of an antibiotic and (2) the growth rate of Sc decreases fasters than does the growth rate of Sp at increasing antibiotic concentrations. These antibiotic-dose responses are described by a set of Hill terms (Eq (3) in Methods section). The general trend described in Fig. 1 captured the dynamics for the experimental systems analyzed. In general, the responses of the two strains to antibiotics can be diverse. Here, numerical simulations are performed with 3 different sets of nc and np values, while keeping other parameters the same as in Fig. 1. a, The growth rates of the subpopulation with chromosomal transposons (Sc) and the subpopulation with plasmid-based transposons (Sp) under different antibiotic concentrations. b, The relative growth rates (Δμ) of the subpopulation with chromosomal transposons Sc) and the subpopulation with plasmid-based transposons (Sp) under different antibiotic concentrations. Here, different parameter sets generate three different trends of Δμ at increasing antibiotic concentrations: (Left) Δμ increases and then decreases, (Middle) Δμ increases, decreases and then increases; (Right) Δμ decreases, increases, and then decreases. c, Simulated dependence of the fraction of Sp on the antibiotic concentration. Overall, Sp is the dominant subpopulation in the culture above a threshold antibiotic concentration. Under some conditions (middle column), there may exist additional thresholds where the cost of carrying the transposon on the plasmid eventually outweighs its benefit.
Extended Data Fig. 3
Extended Data Fig. 3. Measurement of the transposon on plasmid fraction before and after antibiotic treatment by plasmid extraction and transformation.
Plasmids were extracted from the inoculation culture (a) and cultures after different antibiotic concentration treatment (b), and the fraction containing the resistance transposon was measured by qPCR (result shown in Fig. 2c) and then plasmids were transformed into E. coli DH5α. Next, qPCR was performed on the transformed culture to re-estimate the fraction of plasmids containing the resistant transposon. This result confirms the qPCR results shown in Fig. 2c. (mean ± S.D., n = 4). For the boxplot (a), the top whisker represents the maximum value, the top of the box represents the 75 percentile, the center line represents the median; the bottom of the box represents the 25th percentile, and the bottom whisker represents the minimum value.
Extended Data Fig. 4
Extended Data Fig. 4. Experiments with K-12 MG1655 confirmed the generality of the transposition to plasmid mechanism across E. coli strains.
(a) qPCR and (b) DNA electrophoresis demonstrate that the fraction of cells with the transposon on the plasmid, Sp , increases as antibiotic concentrations increase (data shown as mean ± S.D., n = 3). The MG1655 strain is used as the genetic background, and the same genetic constructs that were used in DH5α for previous experiments (See Fig. 2), were inserted into the homologous genomic region (strain S127). The top arrow in the panel (b) indicates the plasmid with the transposon insertion, and the bottom arrow indicates the empty plasmid. Two independent repeated experiments were performed for the DNA electrophoresis experiments (b).
Extended Data Fig. 5
Extended Data Fig. 5. Extended data demonstrating the increase of the copy number of resistance transposons by antibiotic selection, regardless of promoter, resistance gene, or plasmid origin.
The qPCR results in Fig. 3 show increasing Sp fractions with increasing antibiotic selection at different promoters, resistance genes, and plasmid origins. Here, we picked several samples from Fig. 3, and performed extended verification by DNA electrophoresis (a-c) or plasmid extraction and transformation (d) results (mean ± S.D., n = 4). The top arrow on the gel panels (a-c) represents the plasmid with transposon insertion, while the bottom arrow represents the empty plasmid. Two independent repeated experiments were performed for the DNA electrophoresis experiments (a-c).
Extended Data Fig. 6
Extended Data Fig. 6. Experiments with K-12 MG1655 demonstrated the generality of the transposition to plasmid mechanism, across E. coli strains, and under the control of different promoters.
qPCR showed transposon copy numbers increased at increasing antibiotic concentrations for synthetic transposons with different basal expression levels of the tetA resistance gene (mean ± S.D., n = 3). qPCR was performed on MG1655 strains containing the same high-copy-number plasmid, but with chromosomal-based transposons under the control of different promoters: a weak promoter in strain S128 (a) or a medium promoter in strain S129 (b).
Extended Data Fig. 7
Extended Data Fig. 7. Differences in growth rates between Sc and Sp strains with different plasmids.
Measurement of the growth rates of the strains with a stable tetA resistance gene on the chromosome or on different plasmids (strain S04, S05 S130-135) without antibiotic selection. In general, Sp grew slower than Sc without selection, indicating a higher burden caused by transposons on the plasmids. (n = 4 for PUC origin, n=6 for PBR322 origin, n=8 for other origins, p value calculated by two-tailed Student’s t-test). For each boxplot, the top whisker represents the maximum value, the top of the box represents the 75 percentile, the center line represents the median; the bottom of the box represents the 25th percentile, and the bottom whisker represents the minimum value.
Extended Data Fig. 8
Extended Data Fig. 8. The serial inoculation protocol in experiments with native transposons.
As native-derived transposons may not be as active as the synthetic miniTn5-derived transposons, we used serial inoculation experiments to select for higher transposon copy numbers. Cultures were inoculated into deep well plates with increasing tetracycline concentrations over time. The protocol enriched cells with plasmid-borne transposons, which were hard to detect using the protocol designed for miniTn5-transposons.
Extended Data Fig. 9
Extended Data Fig. 9. Tn10 carrying the resistance gene transposed from the F plasmid to high-copy number pUC plasmids in response to antibiotic treatment.
a, Schematic of experimental design. F plasmid has a copy number of ~1-2; pUC plasmid has a copy number of ~200. b, qPCR showed that distribution of native Tn10 transposons shifted from the F plasmid to a high-copy plasmid (mean ± S.D., n = 3) at high antibiotic concentrations (strain S136).
Extended Data Fig. 10
Extended Data Fig. 10. Schematic of the method used to determine the Sp fraction by plasmid extraction and transformation, and of the method used to determine the copy number of transposons and plasmids in qPCR.
a, We used the Tet+ transposon and Kan+ plasmid as an example (Extended Data Fig. 3b) to show how we calculate the fraction of transposons on the plasmids. Three kinds of plasmids were extracted from the culture: originally empty plasmids (Kan+), plasmids with transposon insertions outside the kanR gene region (Kan+Tet+), and plasmids with transposons insertion inside the kanR gene region (Tet+). After transformation, plates with different antibiotic combinations were used to determine the total number of different plasmids from the original mixture. The detailed calculation process is in the method section. b, We used the Tet+ transposon and Kan+ plasmid as an example (Fig. 2c) to show how we calculate the copy of transposons or plasmids. During the chromosome integration process, a cmR gene was inserted into the chromosome together with but outside the transposon, so the probes for cmR gene can be used to represent the copy of chromosome. The transposon and the plasmid were marked with tetA and kanR gene respectively. We also constructed a DNA fragment with all three markers at 1:1:1 ratio, so this ca be used as a control to calculate the relative copies of different genes. For details of these calculations, see the Methods section.
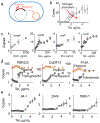
Fig. 1:
Fig. 1:. A kinetic model illustrates the increase of plasmid-based transposons as antibiotic concentrations increase.
a, Transposition of a transposon between the chromosome and a plasmid in response to antibiotic treatment. Sc carries the transposon on the chromosome only; Sp carries the transposon on the plasmid. The antibiotic suppresses the growth of both populations (the red inhibition symbols). Sc can turn into Sp (indicated by the purple arrow) through the transposition of the transposon with a rate constant ηT. Sc and Sp grow at rates μc and μp respectively (green arrows). Here the diagram illustrates the situation where the transposon stays with the chromosome after translocation. Depending on specific molecular mechanisms, it is possible for a transposon to be removed from the original locus upon translocation. The modeling and experimental framework described here remains the same. b, Simulations illustrates the increase in the fraction of Sp with increasing antibiotic concentrations. We chose parameters such that the growth rate of Sc starts higher but drops faster than that of Sp at increasing antibiotic concentrations. See Supplemental Information for further details on model formulation.
Fig. 2:
Fig. 2:. Antibiotic treatment promoted chromosome-to-plasmid transposition for a model transposon.
a, The Sc strain has a copy of miniTn5-derived transposon on the chromosome and internal plasmids with pUC origin (high copy number). The transposon contains a tetA (class C) gene driven by a constitutive promoter. The miniTn5 transposase is located on the chromosome but outside the transposon (strain S03). S03 was used for experiments described in (b) and (c). b, DNA electrophoresis demonstrated increasing Sp fractions at increasing antibiotic concentrations. The top arrow on the gel figure (b) represents the plasmid with transposon insertion, while the bottom arrow represents the empty plasmid. c, qPCR demonstrated increasing Sp fractions at increasing antibiotic concentrations (data show mean ± S.D., n = 3). d, Measurement of the growth rates of the strain with a stable tetA resistance gene on the chromosome (strain S04) or on the plasmids (strain S05) under different antibiotic concentrations. Sp grew slower than Sc at low antibiotic concentrations but faster than Sc at high antibiotic concentrations. (mean ± S.D., n = 4). Three independent repeated experiments were performed for the DNA electrophoresis experiments (b).
Fig. 3:
Fig. 3:. Antibiotic selection increased the copy number of resistance transposons, regardless of promoter, resistance gene, or plasmid origin.
a, Modular construction of library of synthetic transposons. We swapped the promoter, resistance gene, and plasmid origin (all marked in red) with other functional variants to test the generality of the transposition dynamics. b, qPCR demonstrated that transposon copy numbers increase as antibiotic concentrations increase for all tested synthetic transposons, each with a different expression level of the tetA resistance gene (mean ± S.D., n = 3). qPCR was performed on strains containing the same internal high-copy-number plasmid but with chromosomal-based transposons under the control of different promoters (strain S03 with a strong promoter, S06 with a medium promoter, S07 with a weak promoter). c, qPCR demonstrated transposon copy numbers increased at increasing antibiotic concentrations in strains with synthetic transposons and different resistance genes (mean ± S.D., n = 3, Carb represents the carbenicillin concentration, Kan represents the kanamycin concentration, Cm represents the chloramphenicol concentration, Sm represents the spectinomycin concentration). Each strain contains the same internal high-copy-number plasmid in the host cell but chromosomal-based transposons with different resistance genes (strain S08 - S11). d, qPCR demonstrated increasing transposon copy numbers at increasing antibiotic concentrations for different recipient plasmids (mean ± S.D., n = 3). Each strain contained the same chromosomal-based transposon but different plasmids with various copy numbers (strain S12 - S14). e, qPCR revealed similar dynamics when using plasmids isolated from clinical strains (strain S15 - S17) (mean ± S.D., n = 3).
Fig. 4:
Fig. 4:. Antibiotic selection promoted chromosome-to-plasmid transposition, regardless of transposon class.
a, Schematic for measuring the transposition dynamics of native Insertion Sequences (IS). A constitutive promoter and a copy of the tetA resistance gene (marked in red) were inserted into a native transposon (marked in light yellow) under the downstream control of a transposase (marked in dark yellow). These transposons were inserted into E. coli DH5α containing a high-copy plasmid (strain S18 - 57). b, Plating demonstrated transposon copy number increased at increasing antibiotic concentrations in low-transposition-rate transposons (mean ± S.D., n = 3). c, qPCR showed transposon copy numbers increased at increasing antibiotic concentrations in high-transposition rate transposons (mean ± S.D., n = 3).
Fig. 5:
Fig. 5:. Intra-population transposition enabled inter-population transfer of a transposon in a two-member mixed culture, in response to antibiotic treatment.
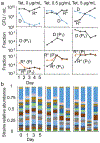
a, The mixed culture consisted of two strains of E. coli: a donor S17-1 strain (marked as D) with a chromosomal-based transposon and a mobilizable plasmid (strain S58) and a recipient DH5α strain (marked as R) with a chromosomal ampR resistance marker (Strain S59). P represents the empty plasmids and PT represents the plasmids with transposons insertions. b, Simulated strain and plasmid distributions in the mixed culture over time in response to varying antibiotic concentrations. The mixed culture started with the same initial population of two strains: a donor strain with a chromosomal-based transposon and a mobilizable plasmid, and a recipient strain with no plasmids. The donor vs. recipient strain distribution over time is shown in the top row; the transposon distribution over time in the donor strain is shown in the middle row; and the plasmid distribution in recipient strain is shown in the bottom row. See Supplemental Information for details on model construction and parameter values. c, Experimental measurements of strain and plasmid distributions over time by plating. The donor and recipient strains (strain S58 and S59) were inoculated at a 50:50 ratio and then cultured without antibiotics (no dose) or with tetracycline concentration 0.5 μg/mL (low dose) or 5 μg/mL (high dose). Plating was used to measure the donor strain and recipient strain distribution (top panel), the fraction of the donor S17-1 cells with the transposon on the plasmid (middle panel), and the fraction of the recipient DH5α cells with the mobilizable plasmids, with or without the resistance transposon (bottom panel) under different antibiotic concentrations (mean ± S.D., n = 3).
Fig. 6:
Fig. 6:. Intra-population transposition enabled inter-population transfer of a transposon in a 67-member mixed culture, in response to antibiotic treatment.
a, The mixed culture consisted of 67 strains of E. coli: one donor S17-1 strain (marked as D) with a chromosomal-based transposon (strain S60) and internal mobilizable plasmids and 66 strains from the Keio collections (marked as R*) (strain S61 - S126) as recipients. The Keio strains were barcoded to enable quantification of mixed culture dynamics. P and PT represent the plasmids without transposons and with transposons, respectively. The 66 recipient strains were inoculated at equal starting volumes, cultured for 24h, mixed 1:1 with the donor, and then cultured without antibiotic (no dose) or with tetracycline at 0.5 μg/mL (low dose) or 5 μg/mL (high dose). Plating was used to measure the donor strain and recipient strain distribution (top row), the transposition dynamic in the donor S17-1 cells (middle row), and the fraction of the recipient strains that received mobilizable plasmids with or without the transposon (bottom row) across the different antibiotic treatments (mean ± S.D., n = 3). b, Barcode sequencing was used to measure the relative abundance of the different Keio strains (without the donor strain) on each day of passage under different antibiotic conditions. Each color represents the relative abundance of individual strains in the mixed culture.

Comment in

  • The journey of bacterial genes.
    San Millan A. San Millan A. Nat Ecol Evol. 2022 May;6(5):498-499. doi: 10.1038/s41559-022-01713-2. Nat Ecol Evol. 2022. PMID: 35347260 No abstract available.

References

    1. Poirel L et al. Tn125-related acquisition of blaNDM-like genes in Acinetobacter baumannii. Antimicrobial agents and chemotherapy 56, 1087–1089 (2012). - PMC - PubMed
    1. Wang R et al. The global distribution and spread of the mobilized colistin resistance gene mcr-1. Nat Commun 9, 1179, doi: 10.1038/s41467-018-03205-z (2018). - DOI - PMC - PubMed
    1. Clark NC, Weigel LM, Patel JB & Tenover FC Comparison of Tn1546-like elements in vancomycin-resistant Staphylococcus aureus isolates from Michigan and Pennsylvania. Antimicrob Agents Chemother 49, 470–472, doi: 10.1128/AAC.49.1.470-472.2005 (2005). - DOI - PMC - PubMed
    1. Partridge SR, Kwong SM, Firth N & Jensen SO Mobile Genetic Elements Associated with Antimicrobial Resistance. Clin Microbiol Rev 31, doi: 10.1128/CMR.00088-17 (2018). - DOI - PMC - PubMed
    1. Stokes HW & Gillings MR Gene flow, mobile genetic elements and the recruitment of antibiotic resistance genes into Gram-negative pathogens. FEMS microbiology reviews 35, 790–819 (2011). - PubMed

Publication types

MeSH terms

Substances