. 2022 Apr;54(4):499-507.
doi: 10.1038/s41588-022-01033-y. Epub 2022 Mar 28.

Global landscape of SARS-CoV-2 genomic surveillance and data sharing

Affiliations

Global landscape of SARS-CoV-2 genomic surveillance and data sharing

Zhiyuan Chen et al. Nat Genet. 2022 Apr.

Abstract

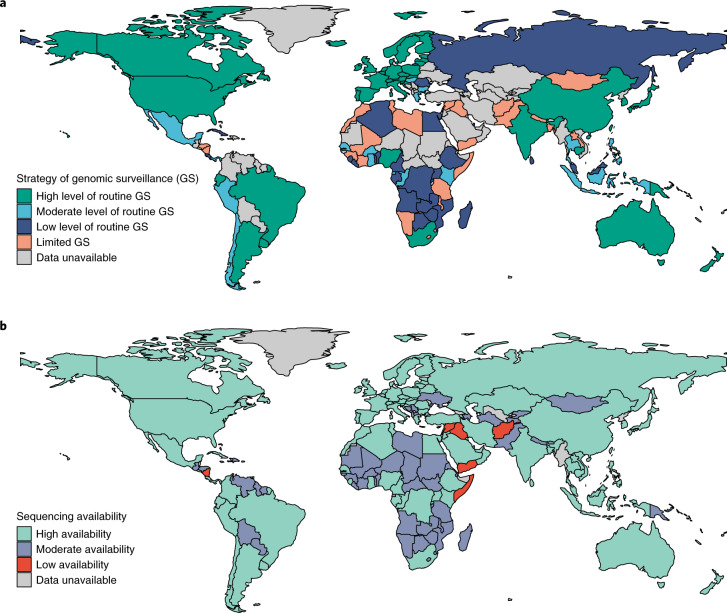
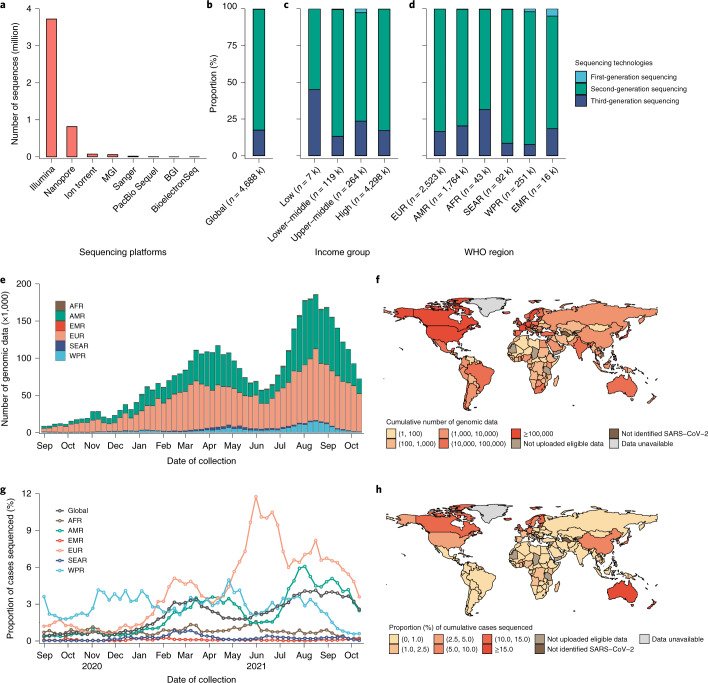
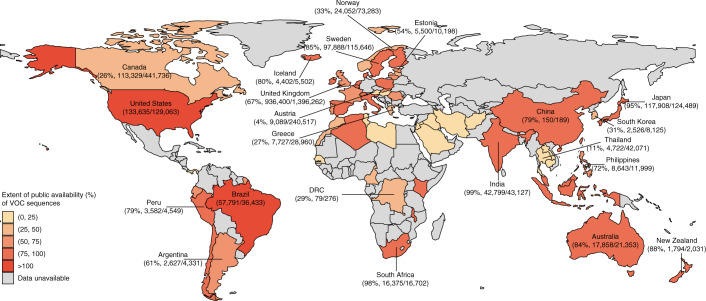
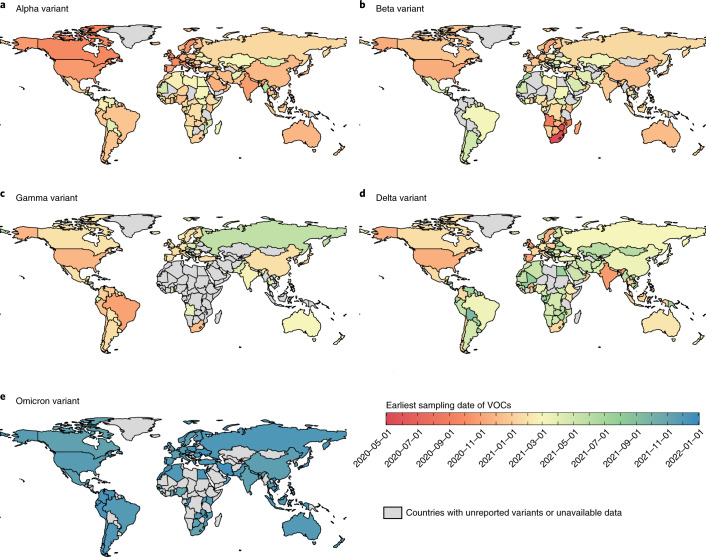
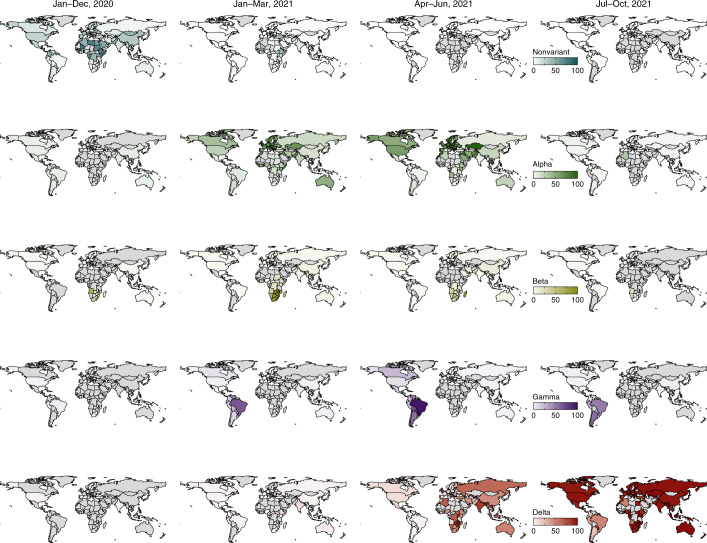
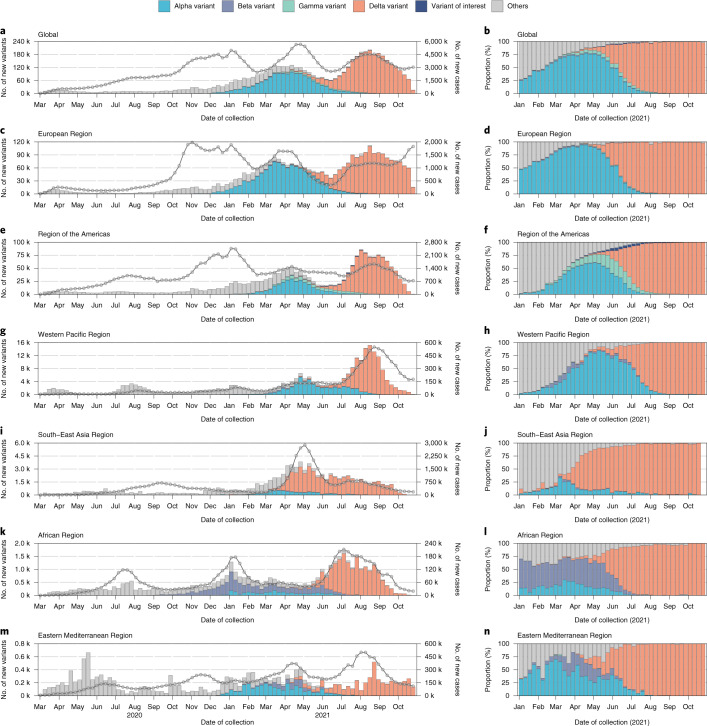
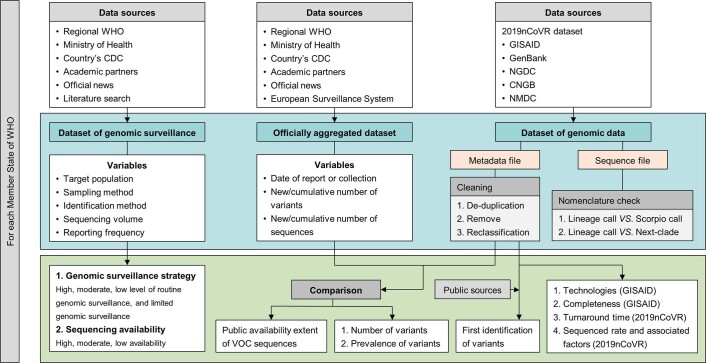
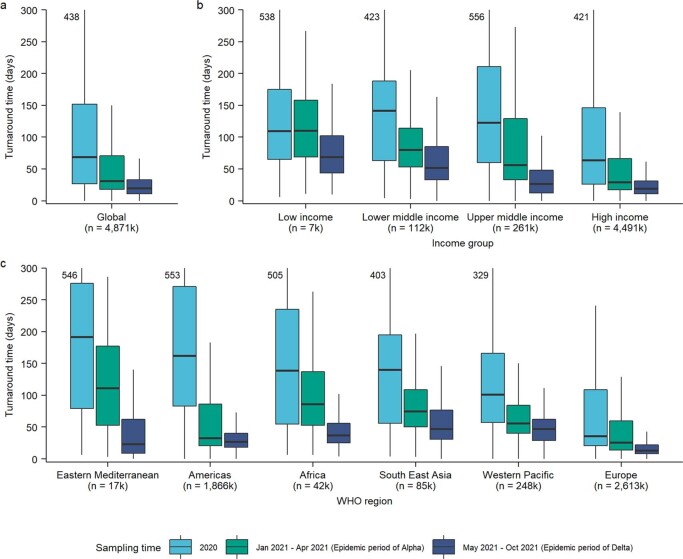
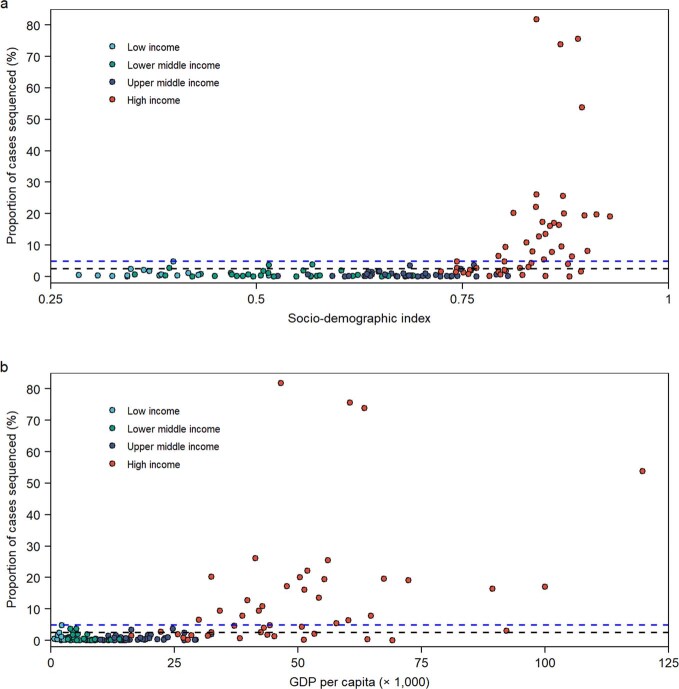
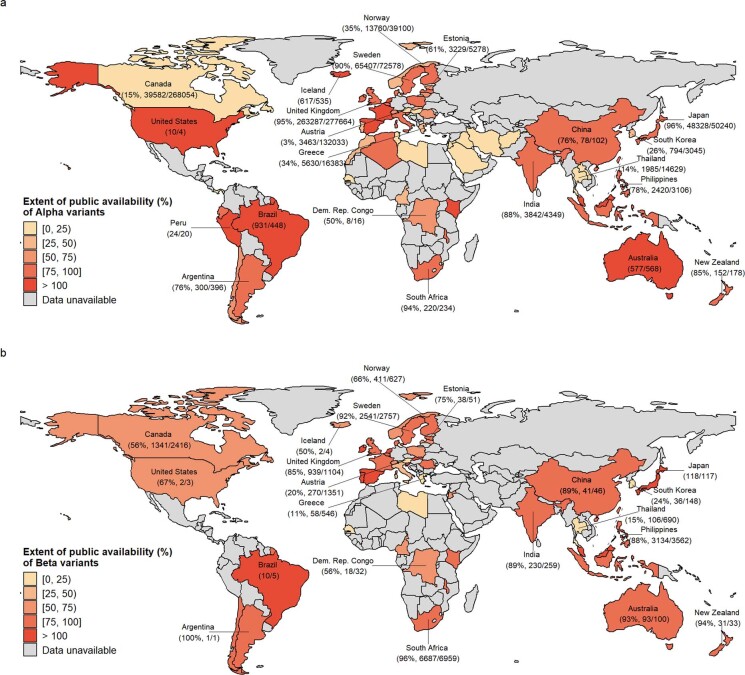
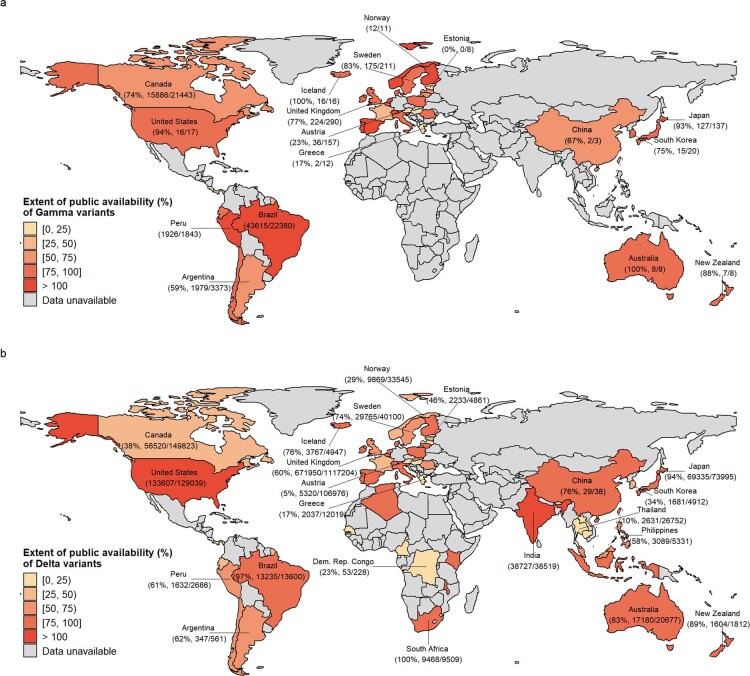
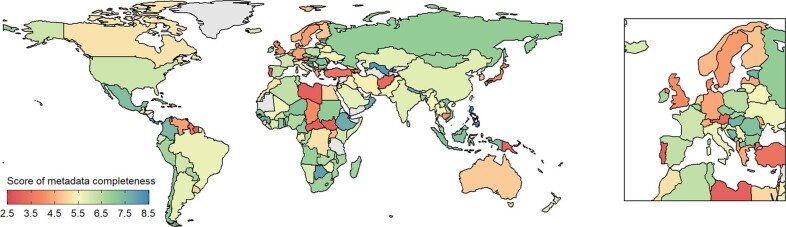
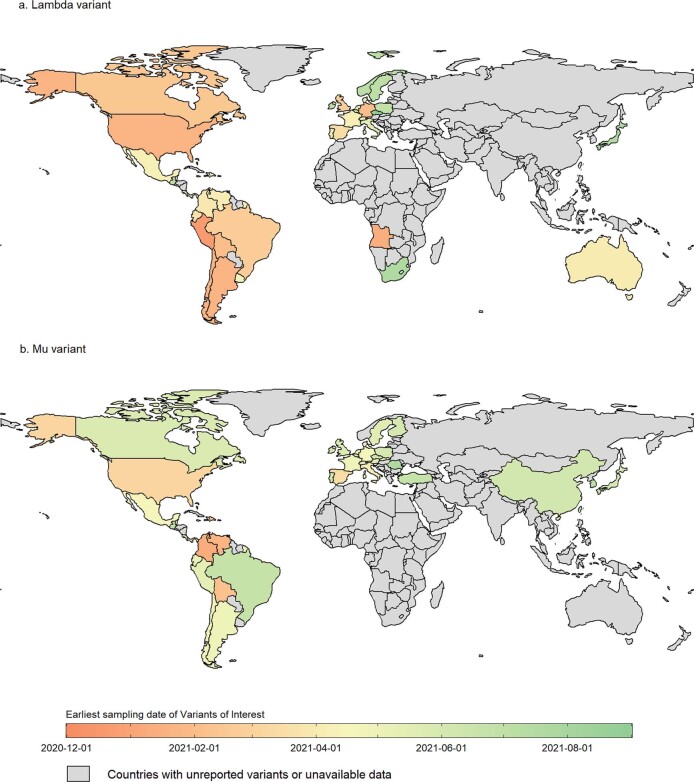
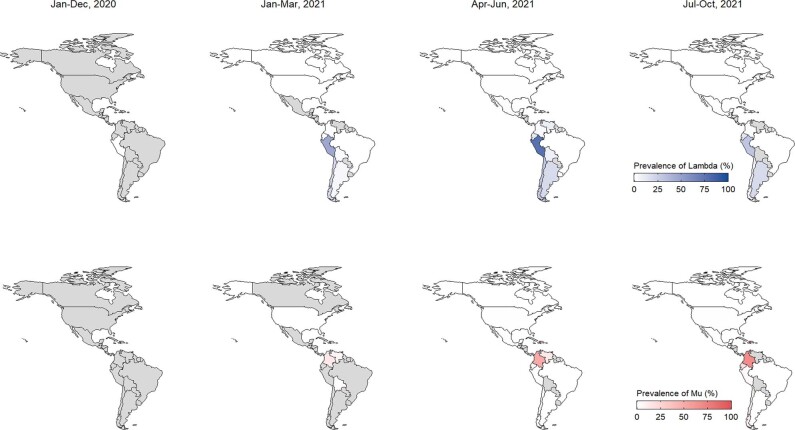
Genomic surveillance has shaped our understanding of severe acute respiratory syndrome coronavirus 2 (SARS-CoV-2) variants. We performed a global landscape analysis on SARS-CoV-2 genomic surveillance and genomic data using a collection of country-specific data. Here, we characterize increasing circulation of the Alpha variant in early 2021, subsequently replaced by the Delta variant around May 2021. SARS-CoV-2 genomic surveillance and sequencing availability varied markedly across countries, with 45 countries performing a high level of routine genomic surveillance and 96 countries with a high availability of SARS-CoV-2 sequencing. We also observed a marked heterogeneity of sequencing percentage, sequencing technologies, turnaround time and completeness of released metadata across regions and income groups. A total of 37% of countries with explicit reporting on variants shared less than half of their sequences of variants of concern (VOCs) in public repositories. Our findings indicate an urgent need to increase timely and full sharing of sequences, the standardization of metadata files and support for countries with limited sequencing and bioinformatics capacity.


Conflict of interest statement

H.Y. has received research funding from Sanofi Pasteur, Shanghai Roche Pharmaceutical Company, and SINOVAC Biotech Ltd. None of those research funding is related to this work. All other authors report no competing interests.

Figures

Fig. 1
Fig. 1. Global SARS-CoV-2 genomic surveillance and sequencing availability.
a, The global distribution of four strategies for SARS-CoV-2 genomic surveillance. b, The global availability of SARS-CoV-2 sequencing. ‘Data unavailable’ include locations that do not belong to the 194 Member States or do not have applicable data. Data shown here are as of 31 October 2021. Administrative boundaries were adapted from the database of Global Administrative Areas (GADM).
Fig. 2
Fig. 2. Sequencing technologies and distribution of global publicly deposited genomic data.
a, Sequencing counts per sequencing platform. Sanger sequencing technology is regarded as a type of sequencing platform in this study. bd, The proportions (%) of three types of sequencing technologies (e.g., first-generation sequencing, second-generation sequencing and third-generation sequencing) used globally, by income group and WHO region; we only present the data that were available with sequencing information (n = 4.69 million) in the GISAID. e, Weekly numbers of publicly deposited SARS-CoV-2 genomic data by region. f, Cumulative numbers of publicly deposited SARS-CoV-2 genomic data by country. g, Weekly proportions of cases sequenced by region. h, Cumulative proportions of cases sequenced by country. The numbers of sequences for the most recent weeks might be incomplete due to time delays between specimen collection and uploading of sequences. The genomic data shown above are eligible, which refer to those with information for the sampling date, sampling country, and lineage available. Data unavailable, include those locations that do not belong to 194 Member States or provide no applicable data. k, stands for 1,000. The range in parentheses in panel f and h includes the lower bound on the left. AFR, African Region; AMR, Region of the Americas; EMR, Eastern Mediterranean Region; EUR, European Region; SEAR, South-East Asia Region; WPR, Western Pacific Region. Data shown here are as of 31 October 2021. Administrative boundaries were adapted from the GADM database.
Fig. 3
Fig. 3. The extent of public availability of VOC sequences in public repositories.
In view of the availability of official data, the cumulative numbers of variants in different countries correspond to different time periods, with detailed information contained in Supplementary Table 10. The variant data for China include those that have only been reported for mainland China. The officially reported number of Alpha variants might contain cases that were screened by PCR assays. The extent of public availability over 100% was observed in some countries (United States and Brazil), which was likely due to 1) inconsistent timestamps between the deposited genomic data and aggregated data (we assumed a 3-week collection-to-report time delay for Brazil, but this delay could be longer), 2) incomplete data aggregated in official reporting systems or 3) the number of variants in genomic datasets that may be amplified by multiple sequences that were serially sampled from one patient at longitudinal time points. The sequences in public repositories with no collection dates for the specimens are not included. The Omicron variant was not included in this analysis, as most countries had not yet provided any officially reported data on the Omicron variant at the time of writing. The values beneath the country names indicate the number of cumulative variants during the same period (variants in public repositories/official reported variants). The range in parentheses in the legend includes the lower limit on the left, and includes the upper limit for (75, 100). Data shown here are as of October 31, 2021. Administrative boundaries were adapted from the GADM database. DRC, Democratic Republic of the Congo.
Fig. 4
Fig. 4. The earliest identification of the Alpha, Beta, Gamma, Delta and Omicron variants in each country.
The identification of (a) Alpha, (b) Beta, (c) Gamma, (d) Delta, and (e) Omicron variants is shown, respectively. If information regarding the earliest sampling dates was unavailable but that of the earliest reporting date was available, then we extrapolated the sampling dates using a fixed 3-week lag from sample collection to reporting. Countries with darker red colors indicate earlier samples, and those with darker blue colors refer to later samples. Data for the Omicron variant are as of 31 December 2021. Administrative boundaries were adapted from the GADM database.
Fig. 5
Fig. 5. The prevalence and temporal dynamics of nonvariant strains and four SARS-CoV-2 VOCs.
The dates shown at the top refer to the date ranges of specimen collection. The prevalence was defined as the proportion of the strain number (nonvariant strains or variants) to the total number of sequences that were generated in the same unit of time. The nonvariant strains include lineages A, A.1, B and B.1; the sublineages of four VOCs are aggregated with the parent lineages. The Omicron variant is not included in this analysis, as the most recent sequencing mainly targeted positive samples of S dropout at the time of writing. The gray areas represent those countries with no COVID-19 epidemic, or no sequencing or no uploads of more than ten eligible genomic data to public repositories in each period. Data shown here are as of 31 October 2021. Administrative boundaries were adapted from the GADM database.
Fig. 6
Fig. 6. The numbers and proportions of SARS-CoV-2 variants by region and time.
Weekly numbers and proportions of SARS-CoV-2 variants in global (ab), European Region (cd), Region of the Americas (ef), Western Pacific Region (gh), South-East Asia Region (ij), African Region (kl), Eastern Mediterranean Region (mn). The lines and points in the left panel correspond to the y axis on the right. The sublineages of four VOCs were aggregated with the parent lineages; the designated variants of interest include lineages C.37, B.1.621 and their sublineages; other lineages include nonvariant strains and other variants. The data used here were derived from public repositories and aggregated datasets, with priority given to the datasets with the highest number of sequences in a specific week. Data shown here are as of 31 October 2021. k, stands for 1,000.
Extended Data Fig. 1
Extended Data Fig. 1. Overall flowchart of data collection and data analysis.
GISAID, Global Initiative on Sharing All Influenza Data; NGDC, National Genomics Data Center; CNGB, China National GeneBank; NMDC, National Microbiology Data Center.
Extended Data Fig. 2
Extended Data Fig. 2. Distribution of turnaround time of SARS-CoV-2 sequences in different time periods.
The turnaround time is defined as the time delay between specimen collection and data upload. The lower and upper hinges refer to the 25th and 75th percentiles, respectively; the lower and upper whiskers refer to the smallest values that are greater than or equal to the 1.5 interquartile range from the lower hinge and to the largest values that are further than the 1.5 interquartile range from the upper hinge, respectively. The center line of each boxplot refers to the median value. Outlier points are not shown. We cut off the figure at a y-axis position of 300, and the values of the upper whisker that are beyond 300 are shown next to the bars.
Extended Data Fig. 3
Extended Data Fig. 3. Proportions of cases sequenced in each country plotted against socioeconomic factors.
a) Proportions of cases sequenced against the sociodemographic index (SDI). The SDI can be divided into five categories: high, high-middle, middle, low-middle, and low. b) Proportions of cases sequenced against GDP per capita (unit: international dollars) that are adjusted for purchasing power parity. This analysis is restricted to the time period from May 1, 2021 to September 30, 2021, during which the delta variant began to dominate worldwide. Those countries that deposited fewer than 10 eligible sequences in this period were excluded. The blue and black horizontal dotted lines represent 5.0% and 2.5% of the sequenced percentage, respectively. Note: the sequenced percentage is a rough proxy that is due to the potential non-sharing of some genomic data and underreporting of cases.
Extended Data Fig. 4
Extended Data Fig. 4. The extent of public availability of Alpha and Beta variant sequences to public repositories.
In view of the availability of official data, the cumulative numbers of variants in different countries correspond to different time periods, with the detailed information contained in Supplementary Table 10. The variant data for China include those that have only been reported for mainland China. The officially reported number of alpha variants might contain those that were screened by PCR assays. The extent of public availability over 100% was observed in some countries, which was likely due to 1) inconsistent timestamps between the deposited genomic data and aggregated data (although we assumed a three-week collection-to-report time delay, but this delay could be longer); 2) incomplete data aggregated in official reporting systems; or 3) the number of variants in genomic datasets that may be amplified by multiple sequences that were serially sampled from one patient at longitudinal time points. The sequences in public repositories with no collection dates for the specimens are not included. The values beneath the country names indicate the numbers of cumulative variants during the same period: variants in public repositories/official reported variants. Administrative boundaries were adapted from the GADM database.
Extended Data Fig. 5
Extended Data Fig. 5. The extent of public availability of Gamma and Delta variant sequences to public repositories.
In view of the availability of official data, the cumulative numbers of variants in different countries correspond to different time periods, with the detailed information contained in Supplementary Table 10. The variant data for China include those that have only been reported for mainland China. The extent of public availability over 100% was observed in some countries, which was likely due to 1) inconsistent timestamps between the deposited genomic data and aggregated data (although we assumed a three-week collection-to-report time delay, but this delay could be longer); 2) incomplete data aggregated in official reporting systems; or 3) the number of variants in genomic datasets that may be amplified by multiple sequences that were serially sampled from one patient at longitudinal time points. The sequences in public repositories with no collection dates for the specimens are not included. The values beneath the country names indicate the numbers of cumulative variants during the same period: variants in public repositories/official reported variants. Administrative boundaries were adapted from the GADM database.
Extended Data Fig. 6
Extended Data Fig. 6. Total scores of metadata completeness.
We developed a scoring system to assess the metadata quality of each country based on the metadata completeness of ten key variables, including subnational information, sample strategy, specimen source, sequencing technology, date of collection, sex, age, patient status, vaccinated status, and lineage (the weight of each variable is one point, and the total scores are 10 points). The right panel shows the expanded European region. Administrative boundaries were adapted from the GADM database.
Extended Data Fig. 7
Extended Data Fig. 7. The earliest identification of the Lambda and Mu variants in each country.
Administrative boundaries were adapted from the GADM database.
Extended Data Fig. 8
Extended Data Fig. 8. The prevalence and temporal dynamics of the Lambda and Mu variants in the Region of Americas.
The countries that deposited more than 10 eligible sequences in each period are included. Since the Lambda and Mu variants are circulating less widely in other regions, only the Region of Americas is presented in the map. Administrative boundaries were adapted from the GADM database.

Update of

Similar articles

Cited by

  • Detection of SARS-CoV-2 variants in hospital wastewater in Peru, 2022.
    Marcos-Carbajal P, Yareta-Yareta J, Otiniano-Trujillo M, Galarza-Pérez M, Espinoza-Culupu A, Ramirez-Melgar JL, Chambi-Quispe M, Luque-Chipana NA, Gutiérrez Ajalcriña R, Sucñer Cruz V, López Chegne SN, Santillán Ruiz D, Segura Chavez LF, Sias Garay CE, Salazar Granara A, Tsukayama Cisneros P, Tapia Paniagua ST, González-Domenech CM. Marcos-Carbajal P, et al. Rev Peru Med Exp Salud Publica. 2024 Aug 19;41(2):140-145. doi: 10.17843/rpmesp.2024.412.13484. Rev Peru Med Exp Salud Publica. 2024. PMID: 39166636 Free PMC article.
  • Molecular characterization of a new SARS-CoV-2 recombinant cluster XAG identified in Brazil.
    Silva TS, Salvato RS, Gregianini TS, Gomes IA, Pereira EC, de Oliveira E, de Menezes AL, Barcellos RB, Godinho FM, Riediger I, Debur MDC, de Oliveira CM, Ribeiro-Rodrigues R, Miyajima F, Dias FS, Abbud A, do Monte-Neto R, Calzavara-Silva CE, Siqueira MM, Wallau GL, Resende PC, Fernandes GDR, Alves P. Silva TS, et al. Front Med (Lausanne). 2022 Sep 28;9:1008600. doi: 10.3389/fmed.2022.1008600. eCollection 2022. Front Med (Lausanne). 2022. PMID: 36250091 Free PMC article.
  • Accurate Detection of SARS-CoV-2 by Next-Generation Sequencing in Low Viral Load Specimens.
    Ilié M, Benzaquen J, Hofman V, Long-Mira E, Lassalle S, Boutros J, Bontoux C, Lespinet-Fabre V, Bordone O, Tanga V, Allegra M, Salah M, Fayada J, Leroy S, Vassallo M, Touitou I, Courjon J, Contenti J, Carles M, Marquette CH, Hofman P. Ilié M, et al. Int J Mol Sci. 2023 Feb 9;24(4):3478. doi: 10.3390/ijms24043478. Int J Mol Sci. 2023. PMID: 36834888 Free PMC article.
  • INSaFLU-TELEVIR: an open web-based bioinformatics suite for viral metagenomic detection and routine genomic surveillance.
    Santos JD, Sobral D, Pinheiro M, Isidro J, Bogaardt C, Pinto M, Eusébio R, Santos A, Mamede R, Horton DL, Gomes JP; TELEVIR Consortium; Borges V. Santos JD, et al. Genome Med. 2024 Apr 25;16(1):61. doi: 10.1186/s13073-024-01334-3. Genome Med. 2024. PMID: 38659008 Free PMC article.
  • Motifs in SARS-CoV-2 evolution.
    Barrett C, Bura AC, He Q, Huang FW, Li TJX, Reidys CM. Barrett C, et al. RNA. 2023 Dec 18;30(1):1-15. doi: 10.1261/rna.079557.122. RNA. 2023. PMID: 37903545 Free PMC article.

References

    1. Galloway SE, et al. Emergence of SARS-CoV-2 B.1.1.7 lineage: United States, December 29, 2020-January 12, 2021. MMWR Morb. Mortal. Wkly Rep. 2021;70:95–99. doi: 10.15585/mmwr.mm7003e2. - DOI - PMC - PubMed
    1. Davies NG, et al. Estimated transmissibility and impact of SARS-CoV-2 lineage B.1.1.7 in England. Science. 2021;372:eabg3055. doi: 10.1126/science.abg3055. - DOI - PMC - PubMed
    1. Volz E, et al. Assessing transmissibility of SARS-CoV-2 lineage B.1.1.7 in England. Nature. 2021;593:266–269. doi: 10.1038/s41586-021-03470-x. - DOI - PubMed
    1. Wall EC, et al. AZD1222-induced neutralising antibody activity against SARS-CoV-2 Delta VOC. Lancet. 2021;398:207–209. doi: 10.1016/S0140-6736(21)01462-8. - DOI - PMC - PubMed
    1. World Health Organization. Tracking SARS-CoV-2 variants. https://www.who.int/en/activities/tracking-SARS-CoV-2-variants/ (2021).

Publication types

Supplementary concepts