. 2022 Mar;4(3):310-319.
doi: 10.1038/s42255-022-00552-6. Epub 2022 Mar 28.

Molecular consequences of SARS-CoV-2 liver tropism

Affiliations

Molecular consequences of SARS-CoV-2 liver tropism

Nicola Wanner et al. Nat Metab. 2022 Mar.

Abstract

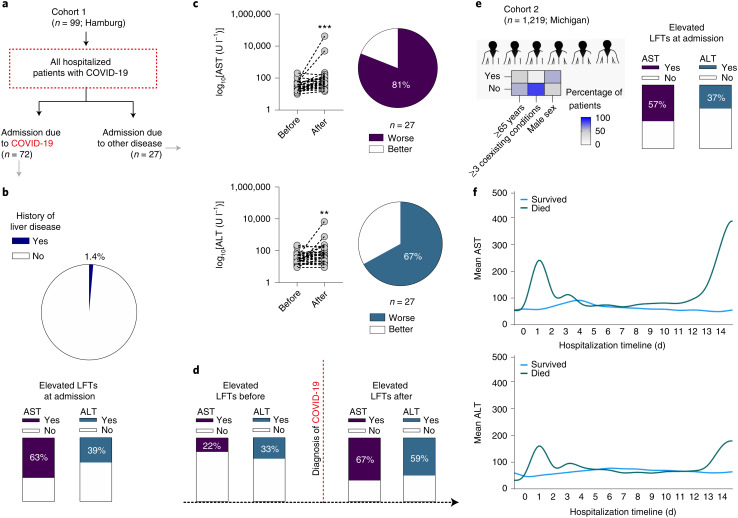
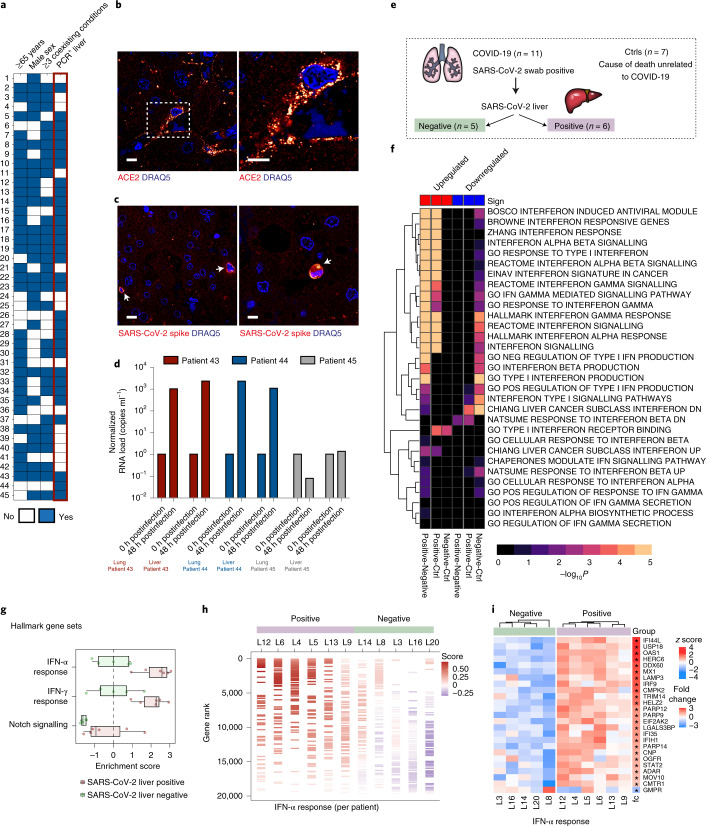
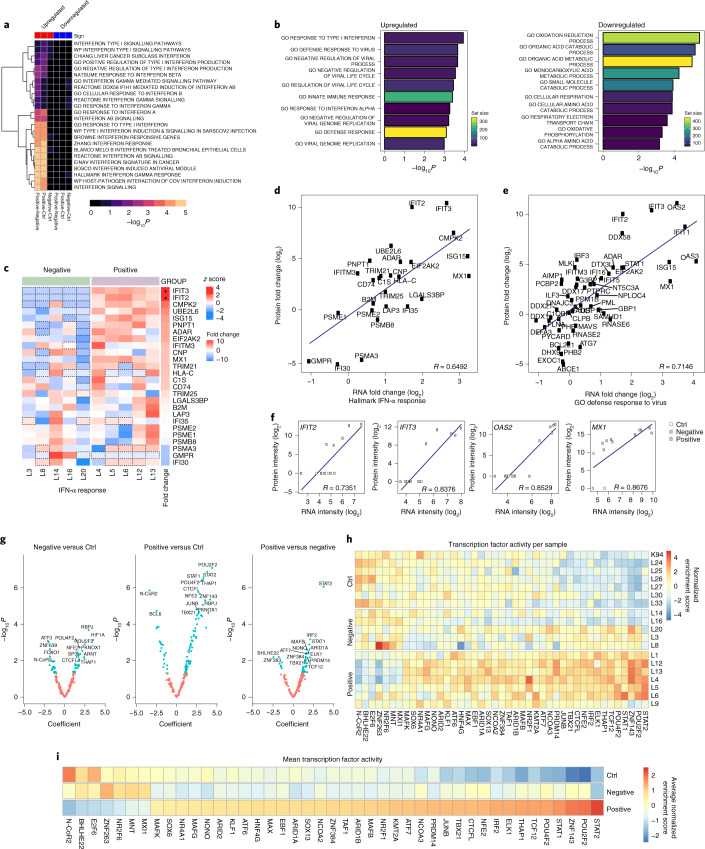
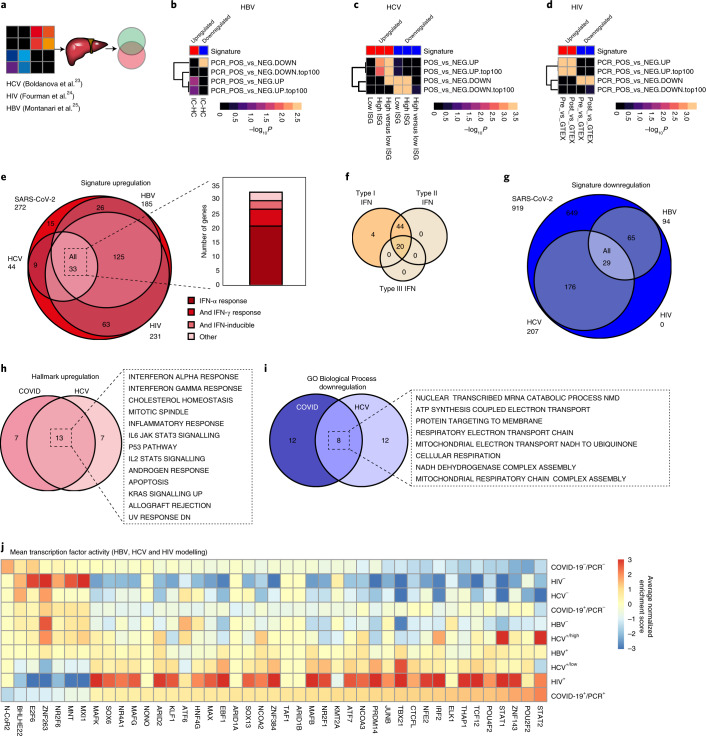
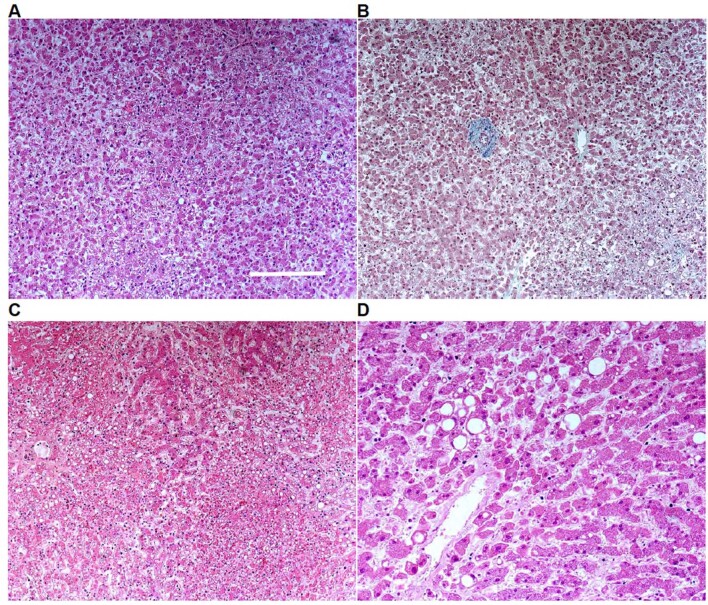
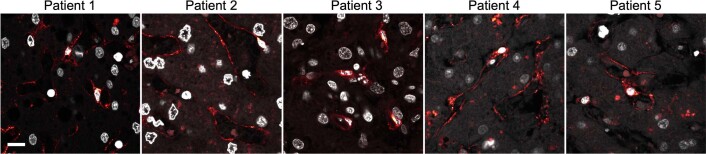
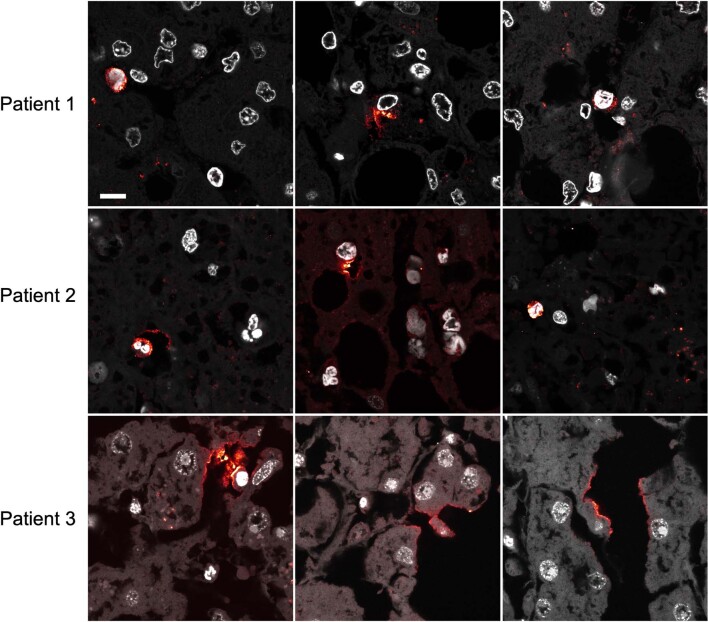
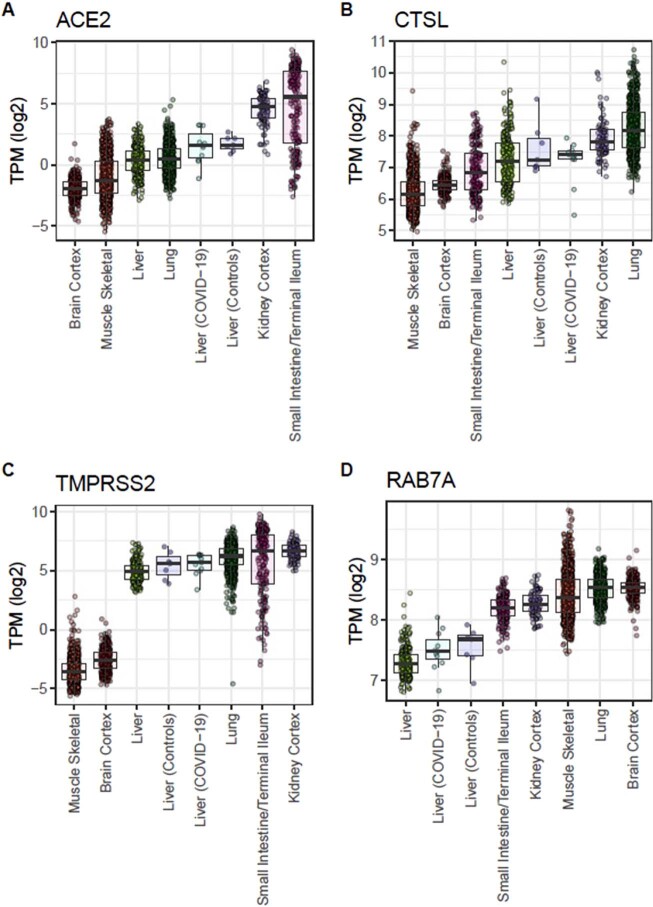
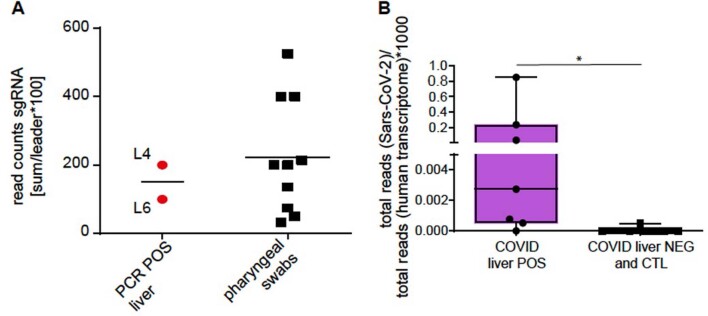
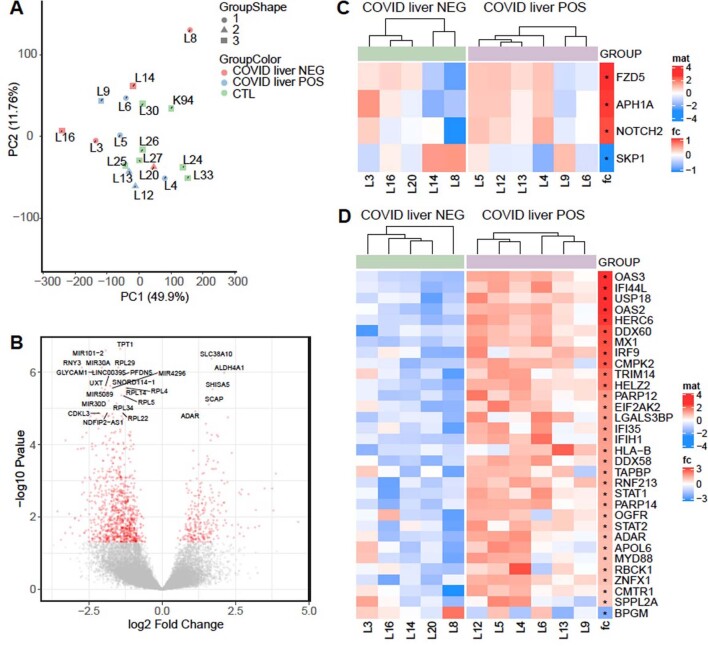
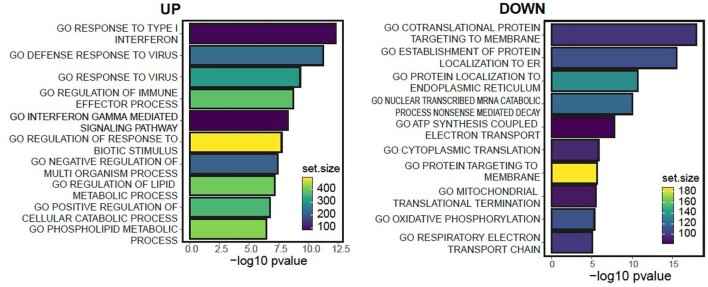
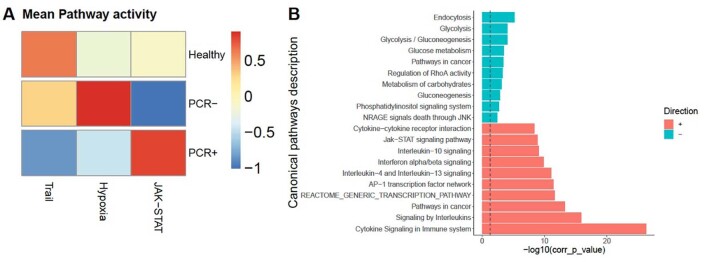
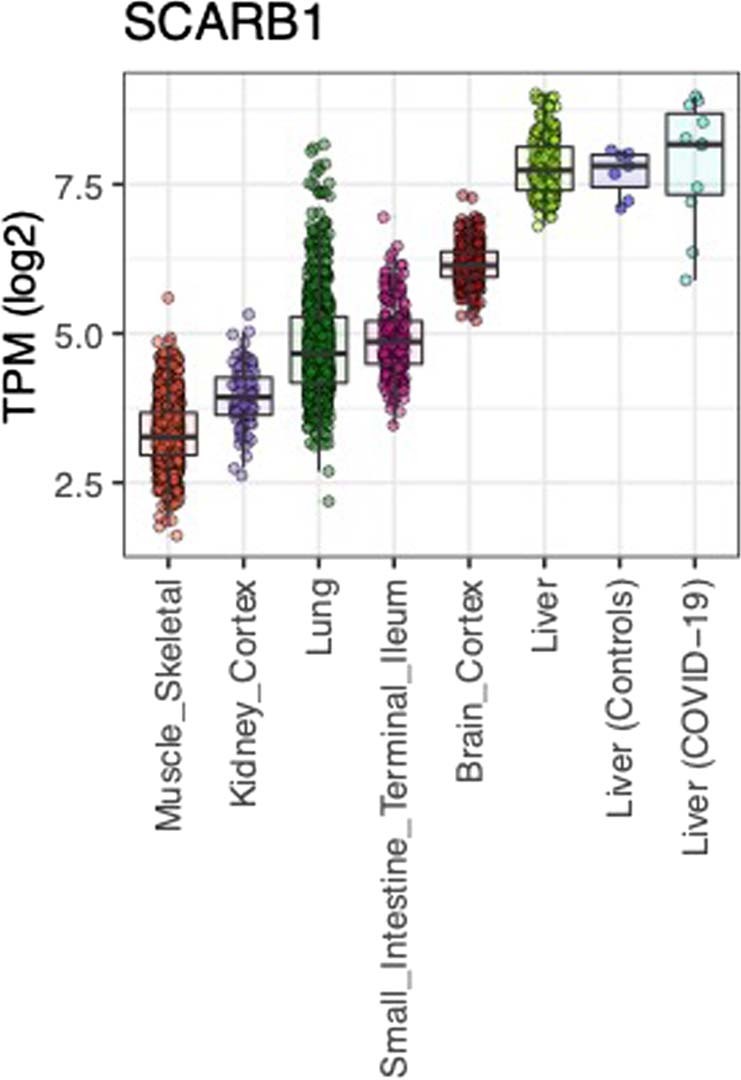
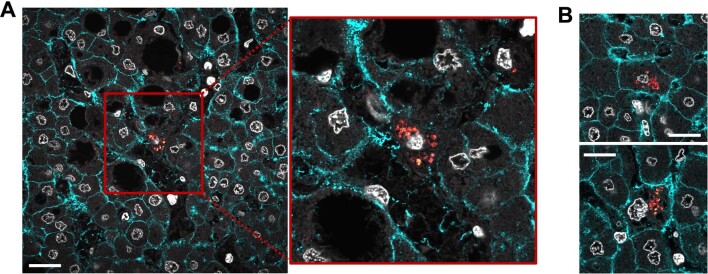
Extrapulmonary manifestations of COVID-19 have gained attention due to their links to clinical outcomes and their potential long-term sequelae1. Severe acute respiratory syndrome coronavirus 2 (SARS-CoV-2) displays tropism towards several organs, including the heart and kidney. Whether it also directly affects the liver has been debated2,3. Here we provide clinical, histopathological, molecular and bioinformatic evidence for the hepatic tropism of SARS-CoV-2. We find that liver injury, indicated by a high frequency of abnormal liver function tests, is a common clinical feature of COVID-19 in two independent cohorts of patients with COVID-19 requiring hospitalization. Using autopsy samples obtained from a third patient cohort, we provide multiple levels of evidence for SARS-CoV-2 liver tropism, including viral RNA detection in 69% of autopsy liver specimens, and successful isolation of infectious SARS-CoV-2 from liver tissue postmortem. Furthermore, we identify transcription-, proteomic- and transcription factor-based activity profiles in hepatic autopsy samples, revealing similarities to the signatures associated with multiple other viral infections of the human liver. Together, we provide a comprehensive multimodal analysis of SARS-CoV-2 liver tropism, which increases our understanding of the molecular consequences of severe COVID-19 and could be useful for the identification of organ-specific pharmacological targets.


Conflict of interest statement

The authors declare no competing interests.

Figures

Fig. 1
Fig. 1. Elevated LFTs among patients with COVID-19.
a, Overview of cohort 1. n = 99 patients required hospitalization due to COVID-19 (Germany). n = 72 were admitted due to moderate/severe COVID-19 and n = 27 acquired COVID-19 during their hospital stay. b, Only 1.4% of patients admitted due to COVID-19 from cohort 1 had a history of liver disease, yet LFTs at admission showed elevated AST in 63% and ALT in 39% of patients. c,d, AST and ALT levels in patients with COVID-19 acquired during hospitalization worsened after COVID-19 diagnosis in 81% and 67% of patients, respectively. e, Demographic overview of cohort 2. n = 1,219 patients required hospitalization due to COVID-19 (Michigan). Only 2.4% of admitted patients from cohort 2 had a history of liver disease, yet LFTs at admission show elevated AST in 57% and ALT in 37% of patients with COVID-19. f, Variation of mean AST and ALT over time in patients with COVID-19, showing elevations in LFTs associated with mortality. Source data
Fig. 2
Fig. 2. SARS-CoV-2 liver tropism is associated with transcriptional regulation of IFN responses.
a, Clinical heatmap of 45 patients indicating age ≥65 years, sex, 3 or more coexisting conditions and SARS-CoV-2 liver tropism (PCR + liver). b, Immunofluorescence images show the presence of the SARS-CoV-2 receptor ACE2 in hepatic cells (that is, Kupffer cells). Staining was performed in samples from five different patients (data shown in Extended Data Fig. 2). c, SARS-CoV-2 spike protein detection in autopsy liver tissues (that is, Kupffer cells and hepatocytes). d, Successful SARS-CoV-2 isolation in postmortem livers and respective lungs from two of three autopsy cases, showing increases in SARS-CoV-2 RNA levels in the supernatants of infected cells (43–45 refers to the number sequence in a). e, Schematic of autopsy tissue selection for molecular profiling. f, Generally applicable gene set enrichment (GAGE) analysis of gene sets significantly regulated between liver PCR-positive, PCR-negative and Ctrl conditions. g, Single-sample jitter plot for gene sets significant (Padj < 0.05) in at least 1 sample and significant difference between the PCR-positive and PCR-negative groups (Wilcoxon signed-rank test, P < 0.05). Box plot (box extending from the 25th to the 75th percentile with the median shown as a line in the middle and the whiskers indicating the smallest and largest values) showing the most relevant pathways from Consensus PathDB. Pathways were ranked according to the average difference between PCR-positive and PCR-negative. Each dot represents the enrichment score from the single-sample analysis. Two-sided Wilcoxon signed-rank tests were performed for statistical significance, including IFN-α response (P = 0.004329004), interferon-γ (IFN-γ) response (P = 0.017316017) and Notch signalling (P = 0.017316017). h, Single-sample enrichment barcode illustrating the distribution of the hallmark gene set ‘IFN-α response’ in every single sample. Genes were ranked according to their normalized TPM value. The colour coding represents the enrichment score of the gene set during a random walk over the ranked list of genes. Samples were divided into PCR-positive and PCR-negative and then ordered from left to right based on their enrichment score, from high to low. i, Row-wise scaled intensity (z-score) heatmap showing genes from the IFN-α response gene set. Genes were ranked according to the log2 fold change, which is indicated on the right. *Padj < 0.05. Within each group, samples were clustered based on Euclidean distance. Scale bars, 10 μm. Source data
Fig. 3
Fig. 3. SARS-CoV-2 liver tropism is associated with proteomic and transcription factor activity regulation of IFN responses.
a, GAGE analysis of gene sets significantly regulated between liver PCR-positive (n = 5), PCR-negative (n= 5) and Ctrl (n = 5) conditions. b, Bar plots showing the top 10 up- and downregulated gene sets from GO Biological Processes between positive and negative. The colour coding represents the number of genes within each gene set. c, Row-wise scaled intensity (z-score) heatmap showing genes from the ‘IFN-α response’ gene set. Genes were ranked according to the log2 fold change, which is indicated on the right. *Padj < 0.05. Within each group, samples were clustered based on Euclidean distance. d,e, mRNA versus protein-positive versus negative fold change scatter plot of gene sets ‘hallmark IFN-α response’ (d) and ‘GO defense response to virus’ (e). Each dot represents a gene that belongs to the gene set. The blue line represents the linear regression between mRNA and protein fold changes. f, mRNA versus protein intensity scatter plot of the genes IFIT2, IFIT3, OAS2 and MX1. Each dot represents a single sample, colour-coded based on the groups: white, green and purple for Ctrl, negative and positive, respectively. The blue line represents the linear regression between mRNA and protein-normalized intensities. g, Transcription factor analysis revealed differential transcription factor usage in Ctrl, COVID-19 liver negative and liver positive samples. h, Heatmap of differentially regulated transcription factors per sample (positive: n = 7; negative: n = 6; Ctrl: n = 6). i, Summary of the mean transcription factor analysis. Source data
Fig. 4
Fig. 4. SARS-CoV-2 shares molecular signatures with viruses associated with liver injury.
a, Publicly available datasets from HBV, HCV and HIV infections were compared with our COVID-19 up- and downregulated gene signatures via GSEA. b, HBV infection showed overlapping gene signatures with our data (upregulated genes/top 100 upregulated genes). c, Liver biopsies from HCV-positive patients showed overlapping gene signatures with our data in high IFN-stimulated genes (ISG) patients and high versus low ISG patients (upregulated genes/top 100 upregulated genes) or high and low ISG (downregulated genes/top 100 downregulated genes). d, HIV infection combined with liver steatosis showed a larger overlap with our COVID-19 signature. e, Overlapping genes with the leading edge of the GSEA of the HBV, HCV and HIV datasets with our upregulated gene signatures showing most genes overlapping all four datasets belonging to the gene sets, IFN-α and IFN-γ responses or having been described as IFN-inducible. f, Overlapping genes from e were classified using www.interferome.org (v2.01) as type I or type II IFN-specific. g, Overlapping genes with the leading edge of the GSEA of the HBV, HCV and HIV datasets with our downregulated gene signatures showing a small overlap with no significant gene signature. h, Hallmark pathways upregulated for COVID-19 liver positive versus negative samples and HCV ISG high versus Ctrl showing overlap in 13 out of 20 pathways. i, GO Biological Process downregulated for COVID-19 liver positive versus negative samples and HCV ISG high versus Ctrl showing overlap in 8 out of 20 pathways. j, Mean transcription factor activity showed similar transcription factor use in COVID-19 liver positive samples, HIV-positive and HCV low ISG, followed by HBV-positive and HCV high ISG samples.
Extended Data Fig. 1
Extended Data Fig. 1. Histopathology in autopsy samples.
a, b, Histological sections from COVID-19 autopsy tissue without signs of overt cytopathic changes. Examples of other pathological alterations. c, Overview of a case with focal fatty changes and centrilobular necrosis, likely as a consequence of shock. d, Zoom in of a case with moderate fatty liver and marked centrilobular necrosis, also likely due to shock. These images represent the main findings after careful examination of 18 cases. Scale bar represents 350um.
Extended Data Fig. 2
Extended Data Fig. 2. ACE2 expression.
ACE expression (orange) and DNA (grey) in the human liver. Based on anatomical location, the staining pattern suggests expression by Kupffer cells. All images were taken at the same magnification. Scale bar represents 10um. This experiment was repeated 3 times in 3 samples with identical results. Source data
Extended Data Fig. 3
Extended Data Fig. 3. SARS-CoV-2 spike protein in autopsy samples.
a, Expression of SARS-CoV-2 spike protein (orange) and DNA (grey) in autopsy tissue from 3 patients with confirmed RT-qPCR+ for SARS-CoV-2 in the respiratory tract (during clinical course) and in the liver (at autopsy). Based on anatomical locations, these findings suggest expression of SARS-CoV-2 spike protein in Kupffer cells, immune cells, and hepatocytes. Scale bar represents 10um. Source data
Extended Data Fig. 4
Extended Data Fig. 4. Expression of known SARS-CoV-2 entry receptors and facilitators in liver autopsy samples.
a, Gene expression of ACE2 in different GTEX tissues shows log2 transcript per million (TPM) expression levels in the liver after intestine, kidney and lung. ACE2 expression levels in the liver samples of COVID-19 patients and controls are comparable with liver and lung expression in GTEX data set. b, Gene expression of CTSL and c, TMPRSS2 and d, RAB7A in different GTEX tissues shows log2 TPM expression levels in the liver after intestine, kidney and lung. Box plots showing boxes from the 25th to the 75th percentile with the median shown as a line in the middle and whiskers indicating 1.5 times the interquartile range.
Extended Data Fig. 5
Extended Data Fig. 5. Detection of SARS-CoV-2 subgenomic RNA.
a, Relative fraction of sgRNA in SARS-CoV-2-positive liver samples is comparable to pharyngeal swab sample data (medRxiv 2020.06.11.20127332; doi: 10.1101/2020.06.11.20127332). b, Total number of SARS-CoV-2-positive reads divided by total number of human reads (*1000) shows a higher number of reads aligning to the SARS-CoV-2 genome in SARS-CoV-2 liver POS samples than in SARS-CoV-2 liver NEG samples and controls. *, p-value = 0.0122 (Mann-Whitney test, two-tailed). Box plot: box extending from the 25th to the 75th percentile with the median shown as a line in the middle and whiskers indicating smallest and largest values.
Extended Data Fig. 6
Extended Data Fig. 6. Transcriptional changes associated with SARS-CoV-2 hepatic tropism.
a, Principal Component Analysis performed on the normalized intensity showing PCR positive (blue), PCR negative (red) Covid-19 liver samples and Control liver (green) samples. PCR- samples are well embedded with healthy liver tissue. b, Volcano plot shows the differentially regulated genes (red dots, adjusted p-value < 0.05) in SARS-CoV-2 PCR positive vs. negative liver samples. Top 25 regulated genes, based on p-value, are labeled. c, Row-wise scaled intensity (mat, z-score) heatmap showing genes from Notch signaling pathway and d, Interferon gamma response gene-set. Genes are ranked according to the log2 fold change, indicated on the right side. Adjusted p-value < 0.05 is indicated with ‘*’. Within each group, samples are clustered based on Euclidean distance. Source data
Extended Data Fig. 7
Extended Data Fig. 7. Gene ontology analysis.
Barplots showing the top 10 UP- and DOWN-regulated gene-sets from Gene Ontology Biological processes between PCR positive and negative samples. Color code represent the number of genes within each gene set.
Extended Data Fig. 8
Extended Data Fig. 8. Canonical pathway analysis.
a, Transcription factor analysis reveals differential transcription factor usage in CTL, COVID-19 liver NEG and liver POS samples. Summary of mean pathway activity in each infection status. b, Canonical pathways up (+) or down (-) regulated.
Extended Data Fig. 9
Extended Data Fig. 9. Gene expression of SCARB1.
Gene expression of SCARB1 in different GTEX tissues shows log2 transcript per million (TPM). Our own datasets are also used to provide context, including Liver (Controls) and Liver (COVID-19). Box plots showing boxes from the 25th to the 75th percentile with the median shown as a line in the middle and whiskers indicating 1.5 times the interquartile range.
Extended Data Fig. 10
Extended Data Fig. 10. Protein expression of SR-B1 and SARs-CoV-2 spike in autopsy tissue.
Protein expression of SR-B1 (cyan) in one post-mortem liver sample – and co-expression with SARS-CoV-2 spike protein (orange) within the same cell. In A, we show an overview of a large liver region, showcasing widespread expression of SR-B1 among hepatocytes with a zoom-in to a cell expressing also SARS-CoV-2 spike. In B, we show two additional regions with hepatocytes showing co-expression of SR-B1 and SARS-CoV-2 spike in the same cell. All images were performed in one specimen as proof-of-principle. Scale bars represent 20um. Source data

Comment in

References

    1. Gupta A, et al. Extrapulmonary manifestations of COVID-19. Nat. Med. 2020;26:1017–1032. - PMC - PubMed
    1. Puelles VG, et al. Multiorgan and renal tropism of SARS-CoV-2. N. Engl. J. Med. 2020;383:590–592. - PMC - PubMed
    1. Nardo AD, et al. Pathophysiological mechanisms of liver injury in COVID-19. Liver Int. 2021;41:20–32. - PMC - PubMed
    1. Mao R, et al. Manifestations and prognosis of gastrointestinal and liver involvement in patients with COVID-19: a systematic review and meta-analysis. Lancet Gastroenterol. Hepatol. 2020;5:667–678. - PMC - PubMed
    1. Chen N, et al. Epidemiological and clinical characteristics of 99 cases of 2019 novel coronavirus pneumonia in Wuhan, China: a descriptive study. Lancet. 2020;395:507–513. - PMC - PubMed

Publication types

Grants and funding