An official website of the United States government
The .gov means it’s official.
Federal government websites often end in .gov or .mil. Before
sharing sensitive information, make sure you’re on a federal
government site.
The site is secure.
The https:// ensures that you are connecting to the
official website and that any information you provide is encrypted
and transmitted securely.
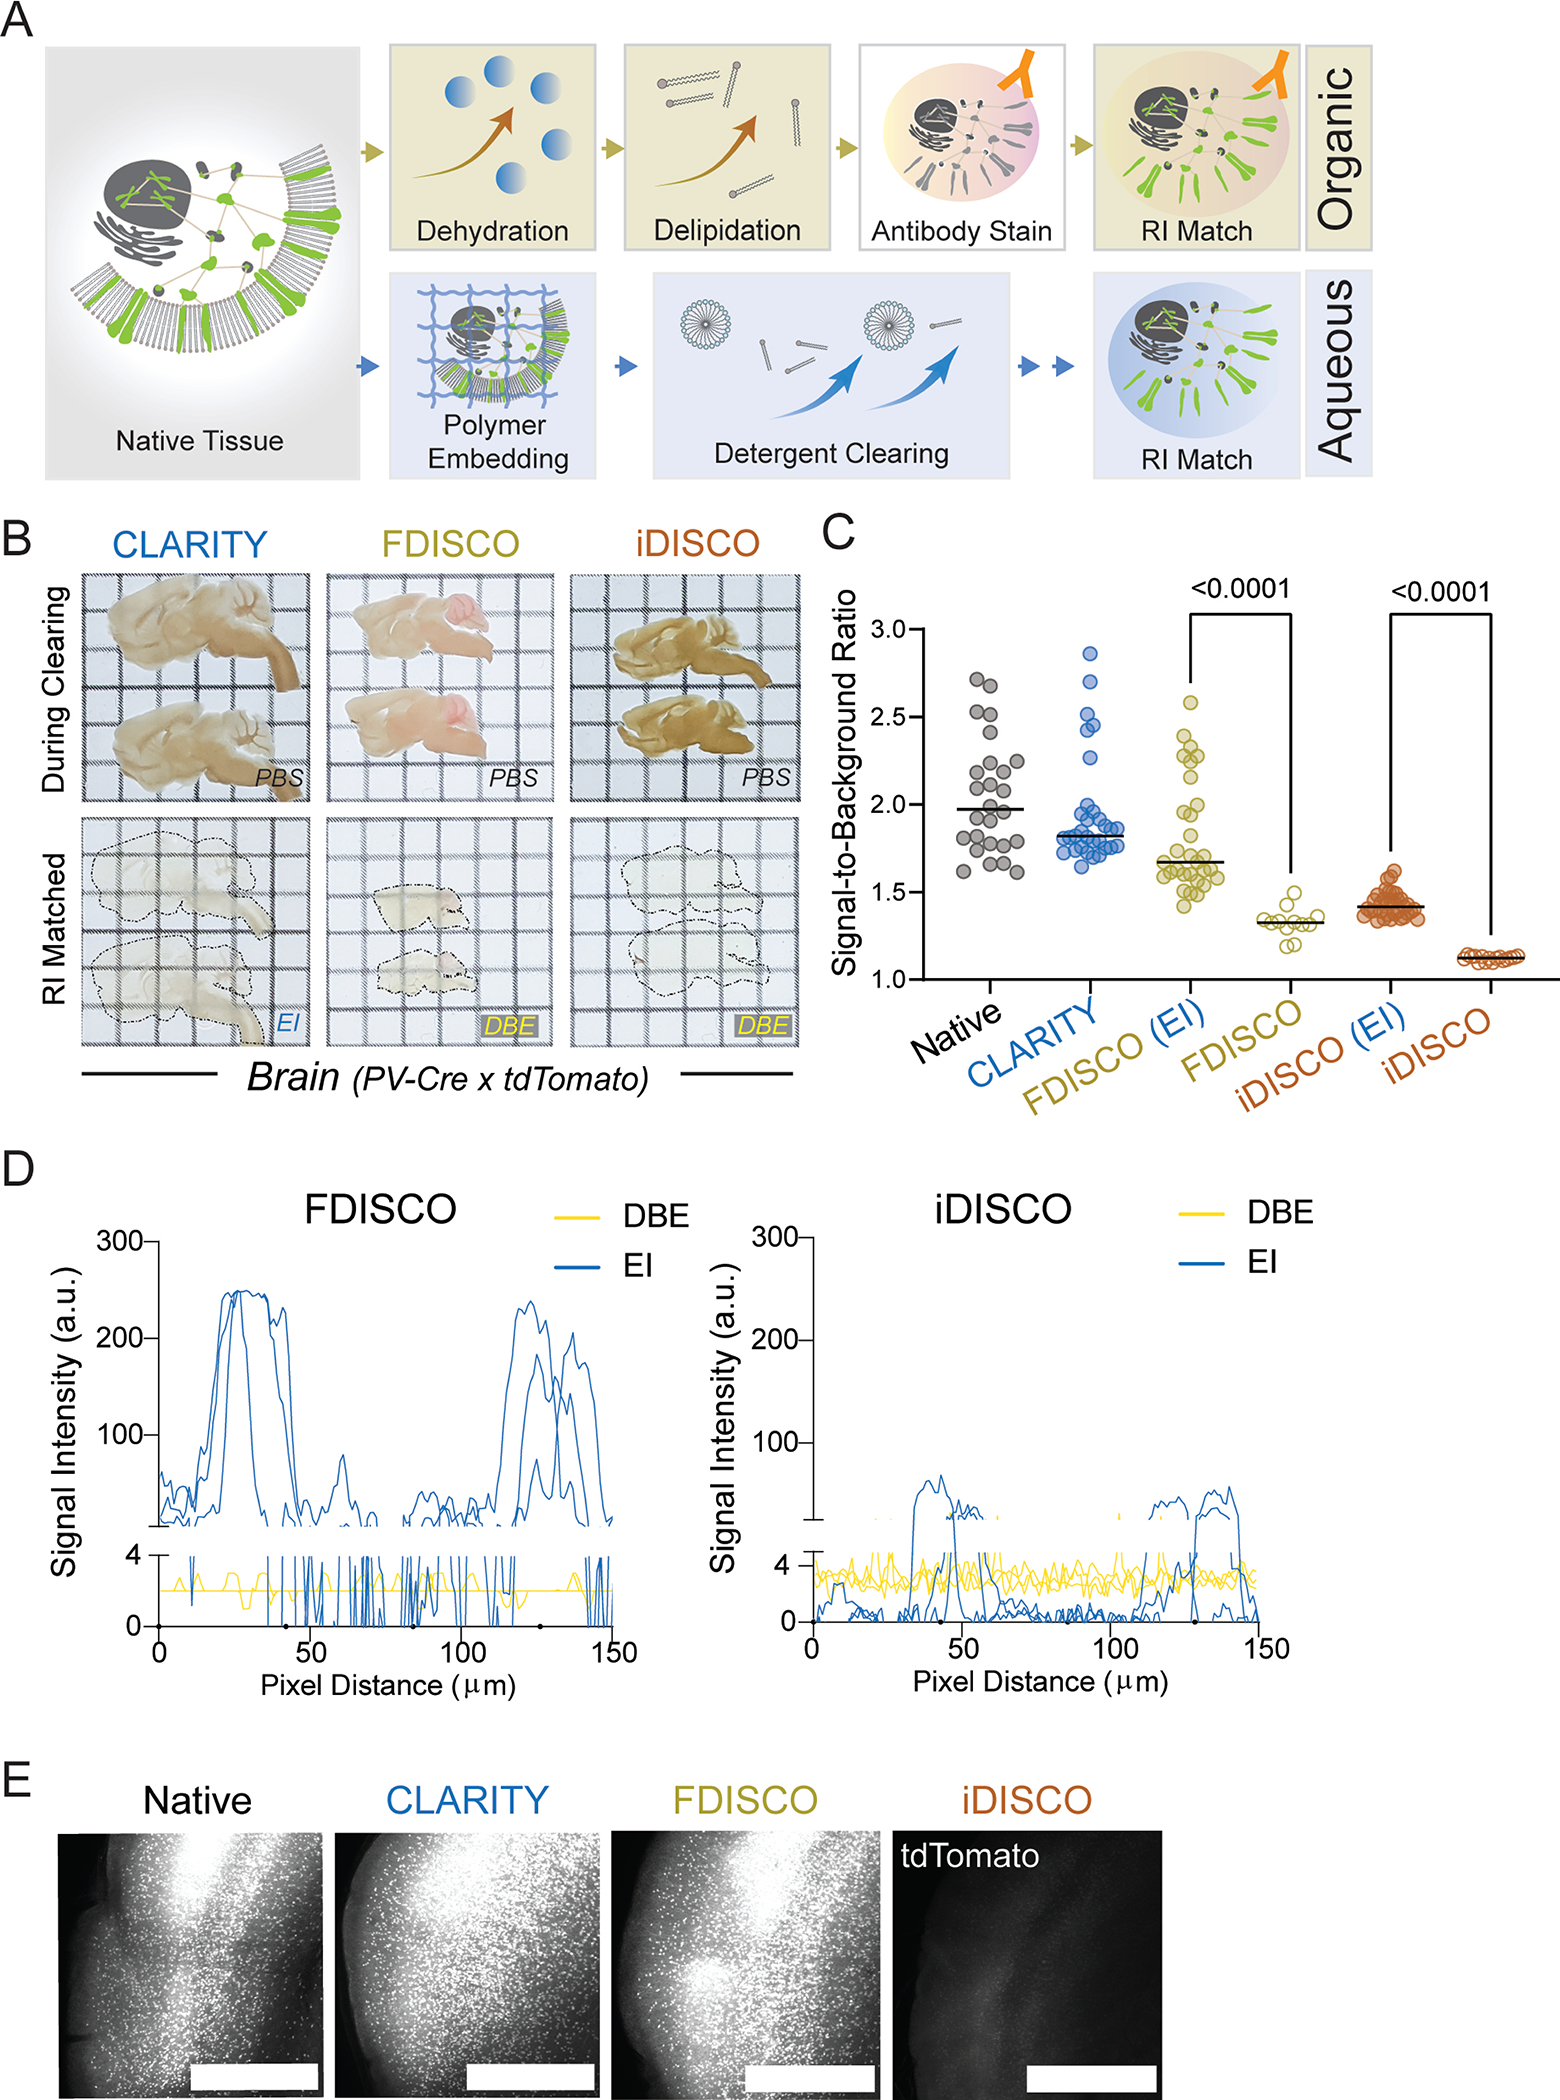
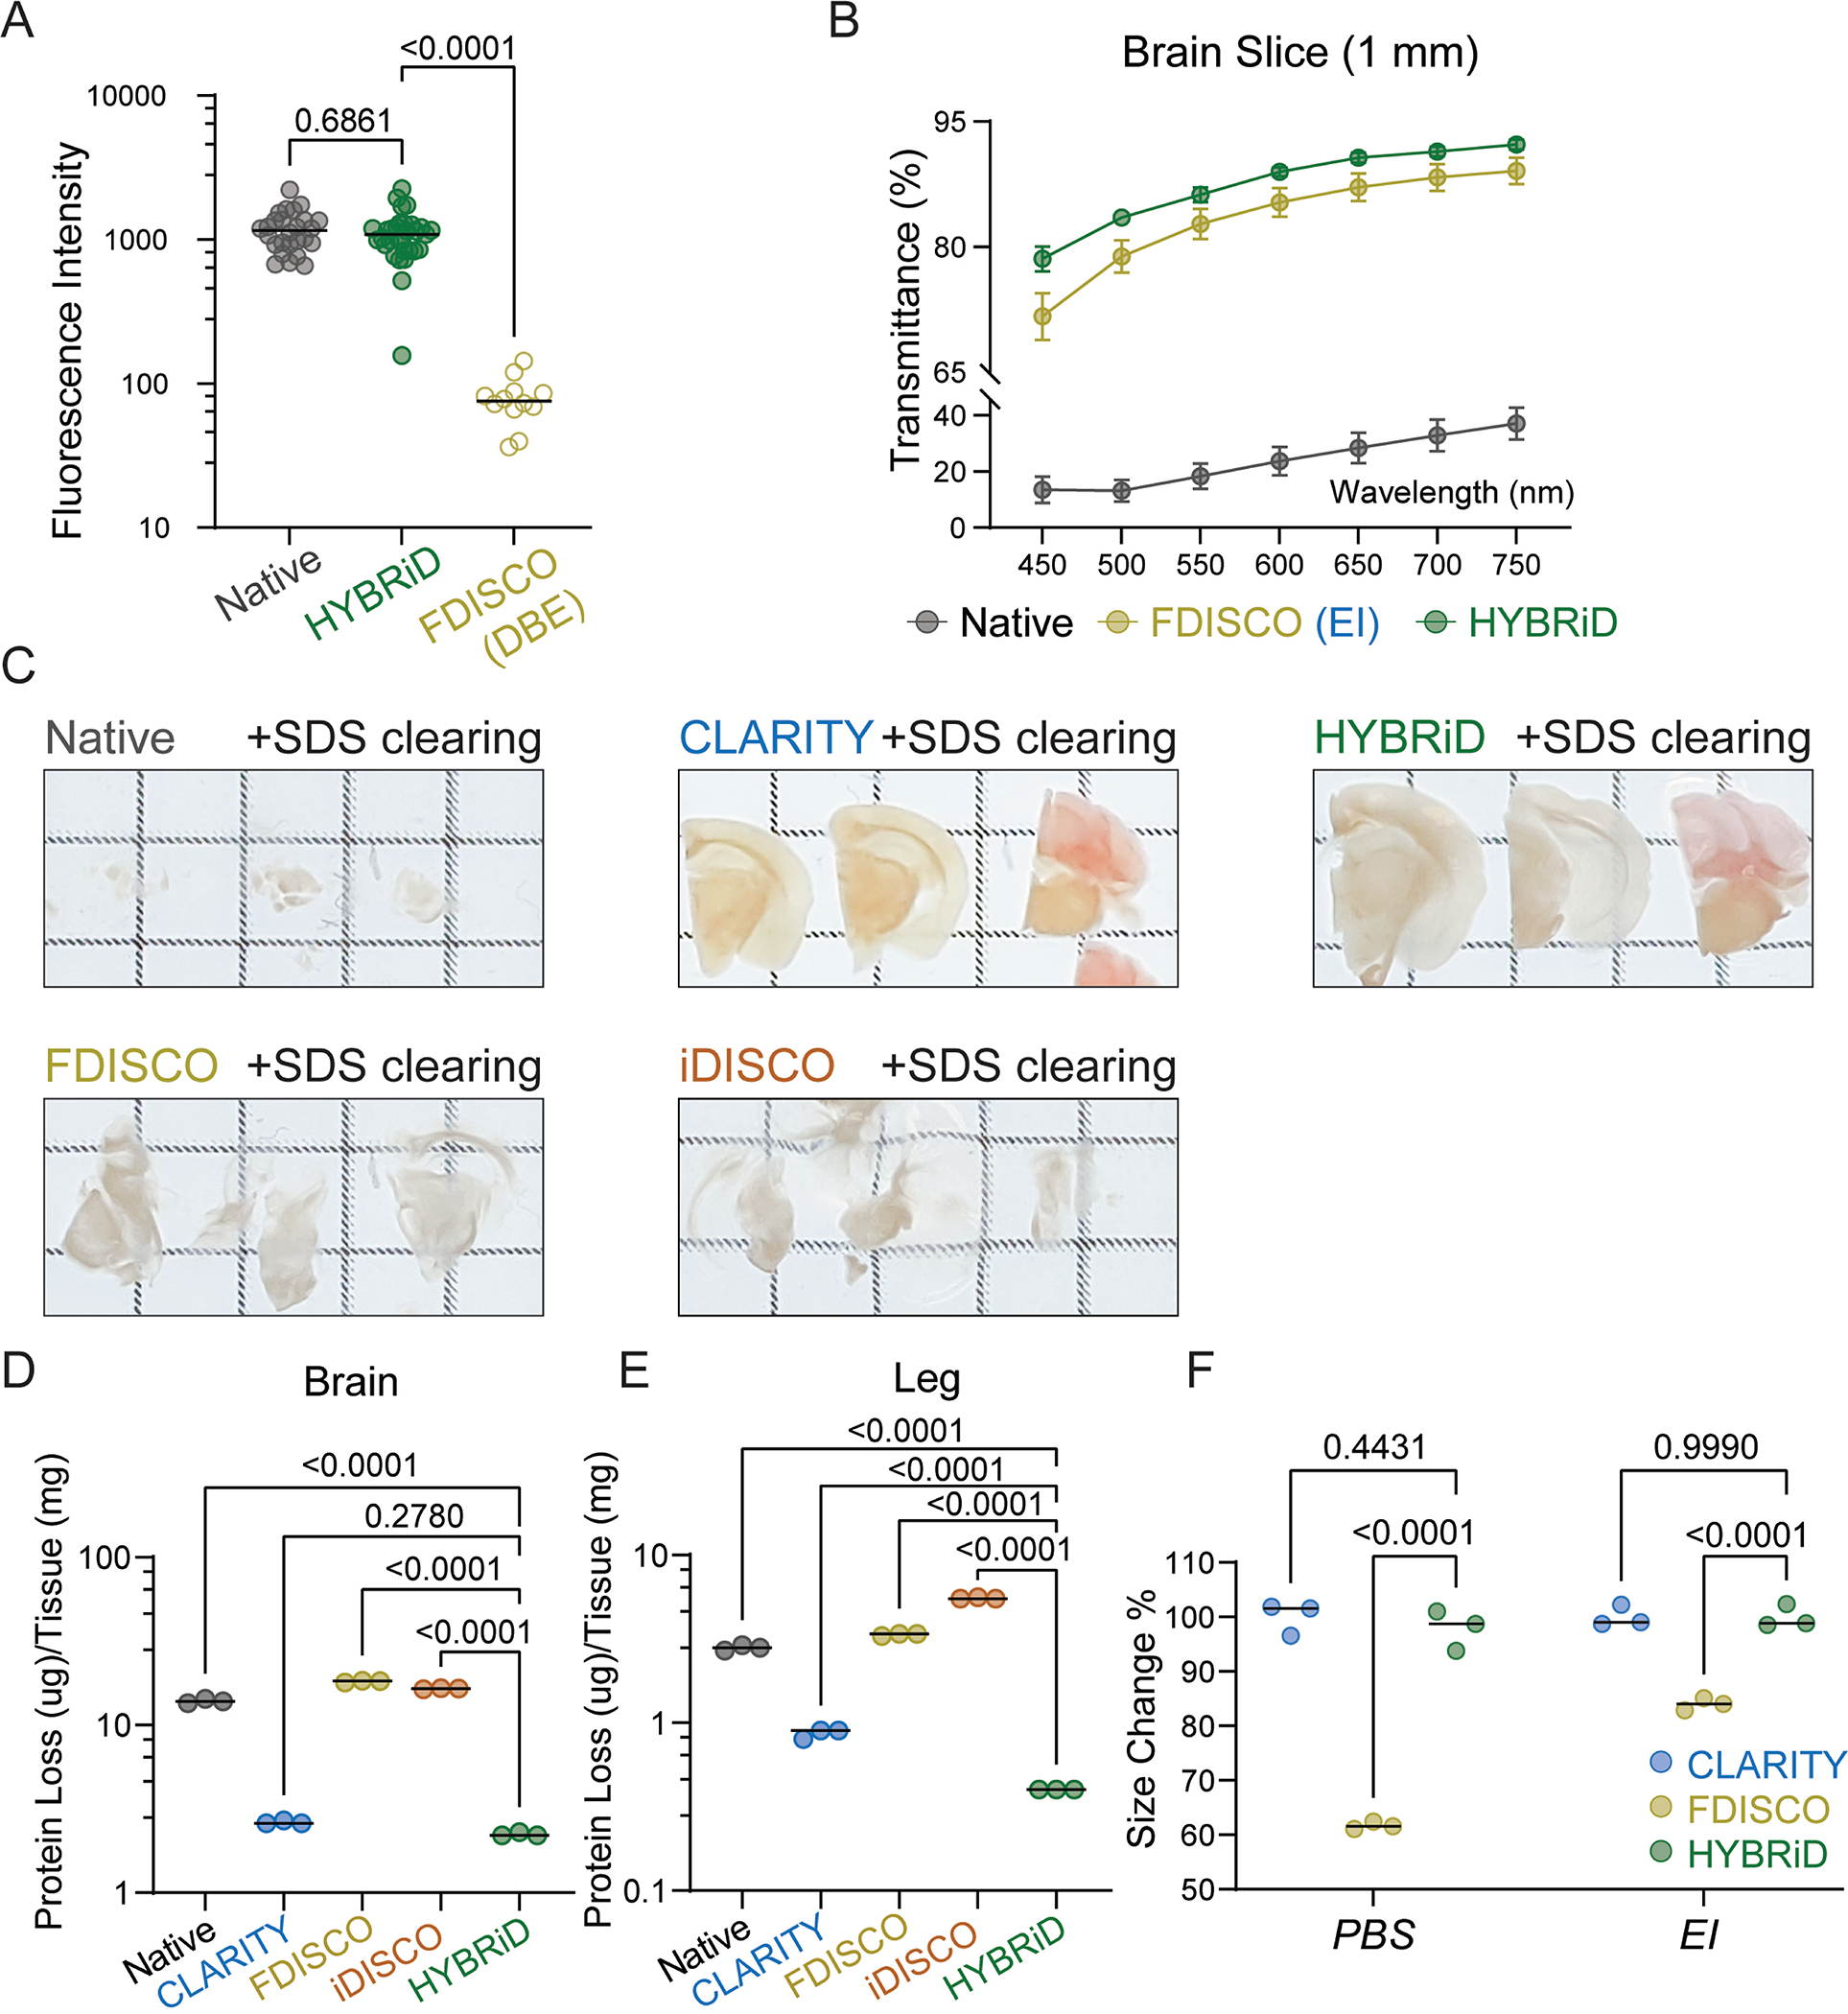
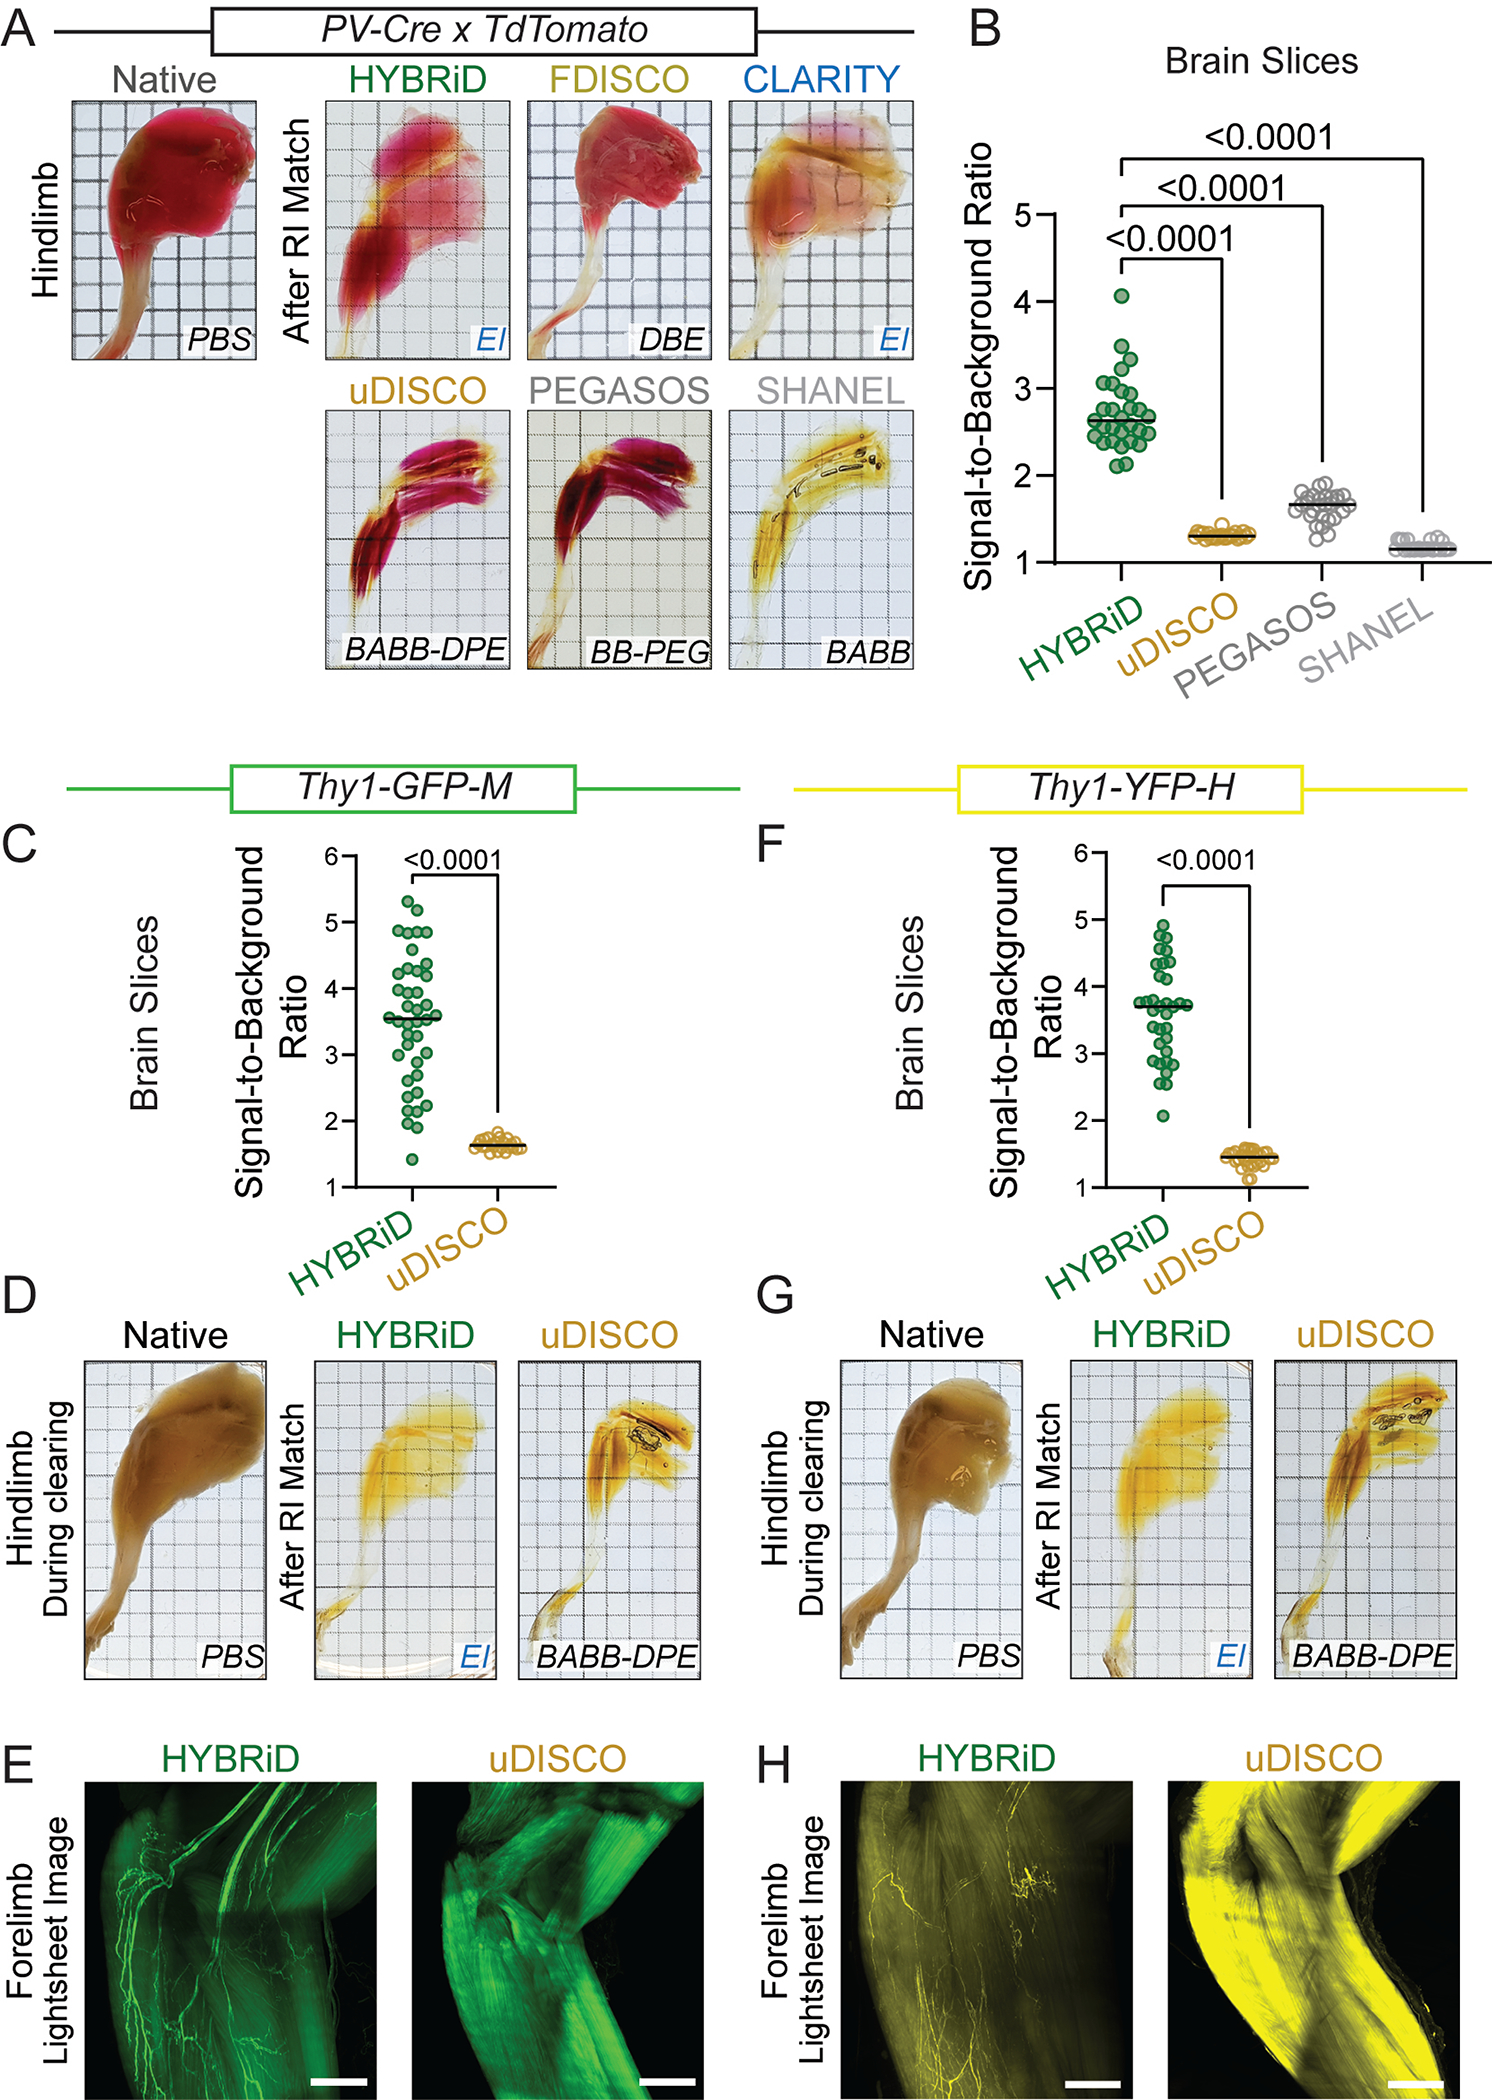
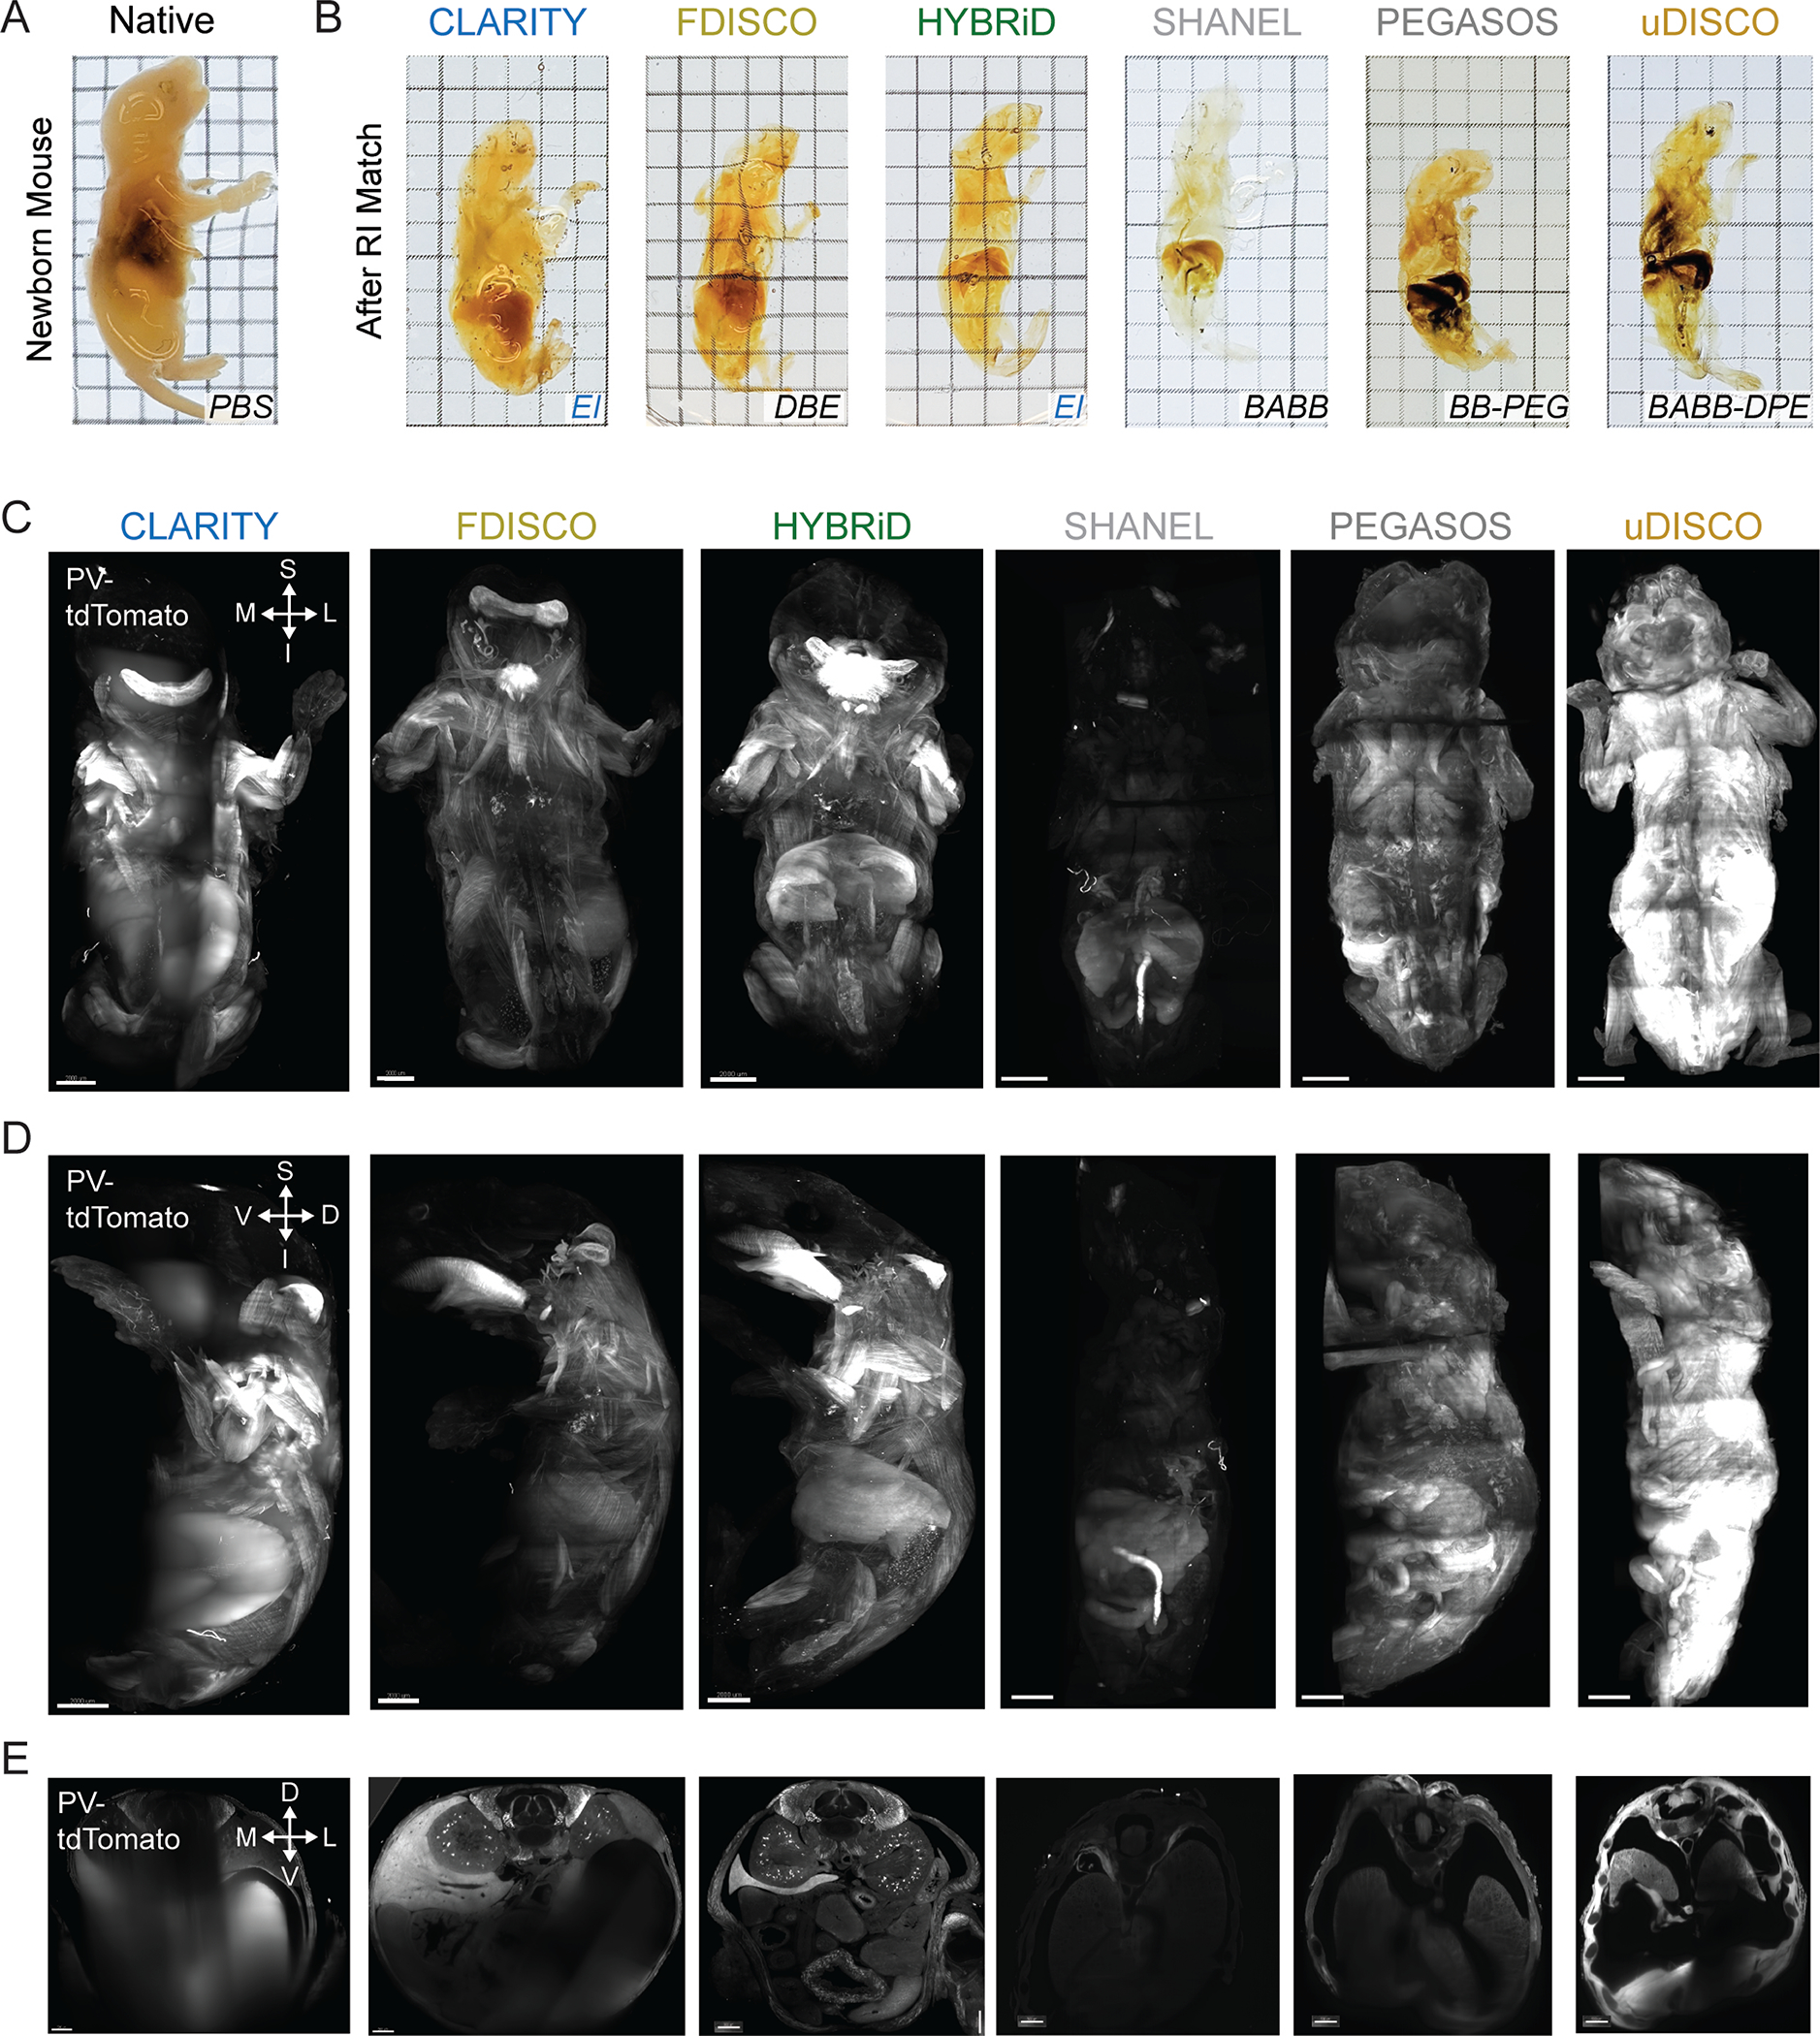
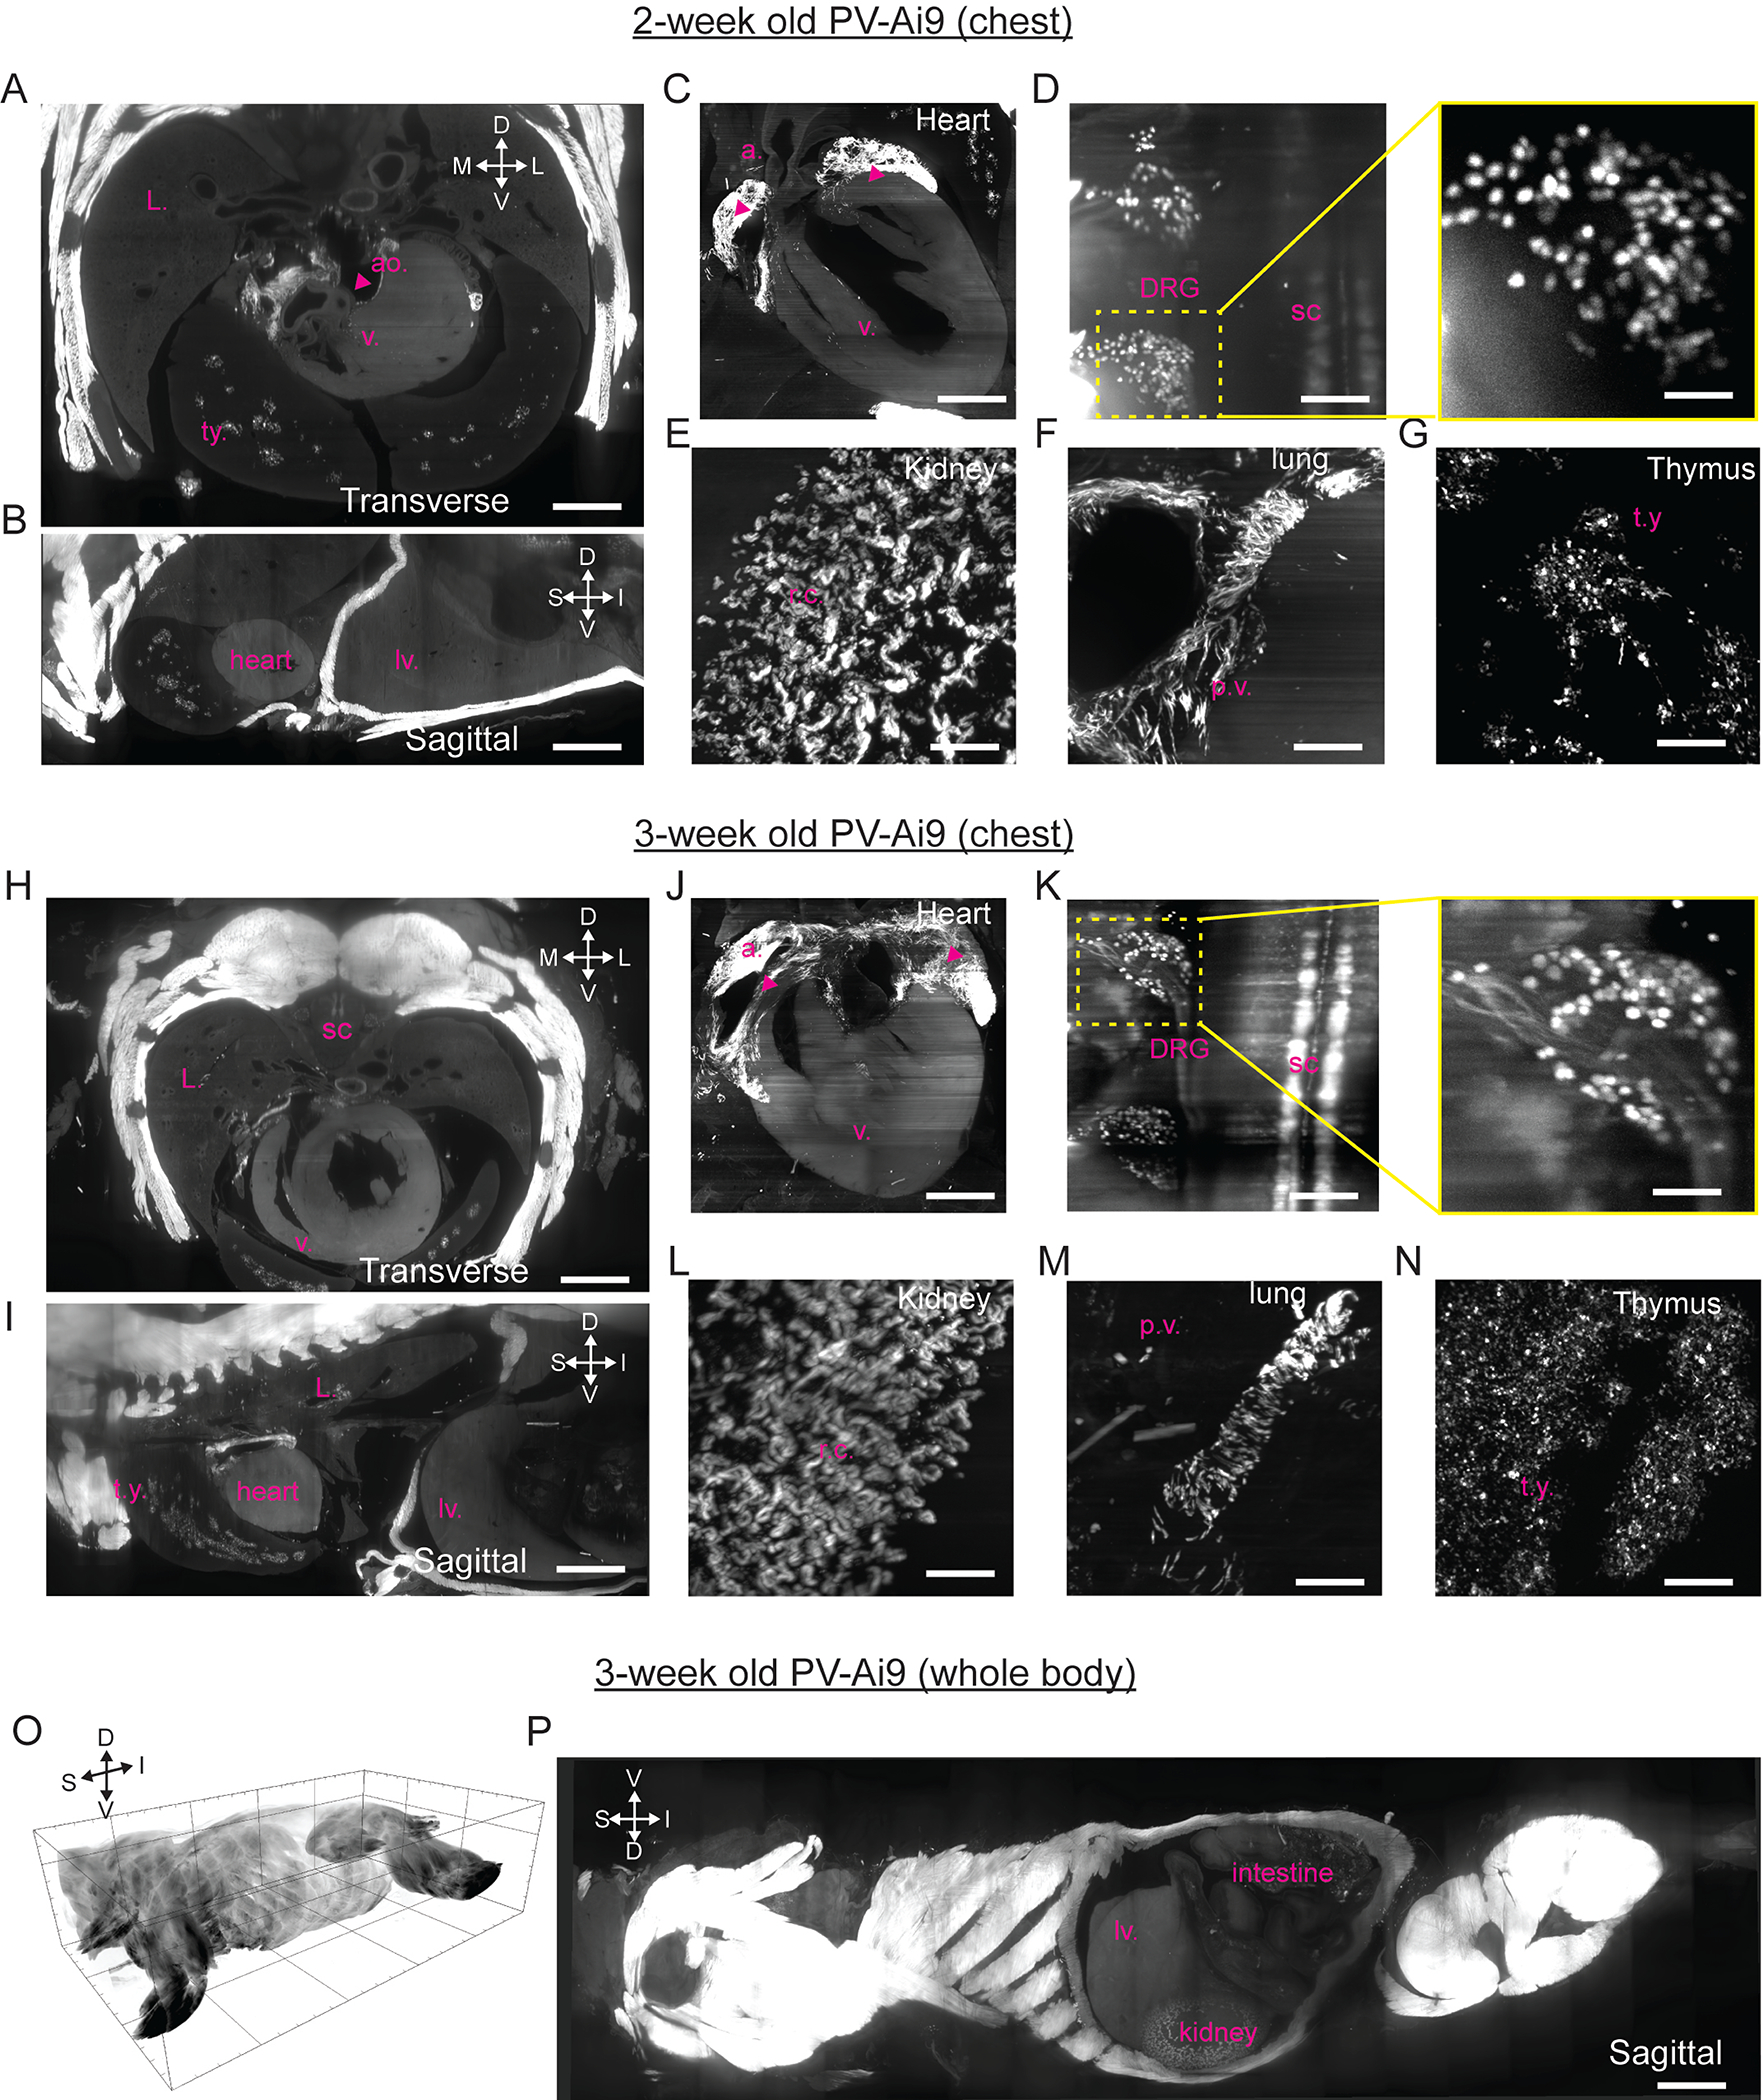
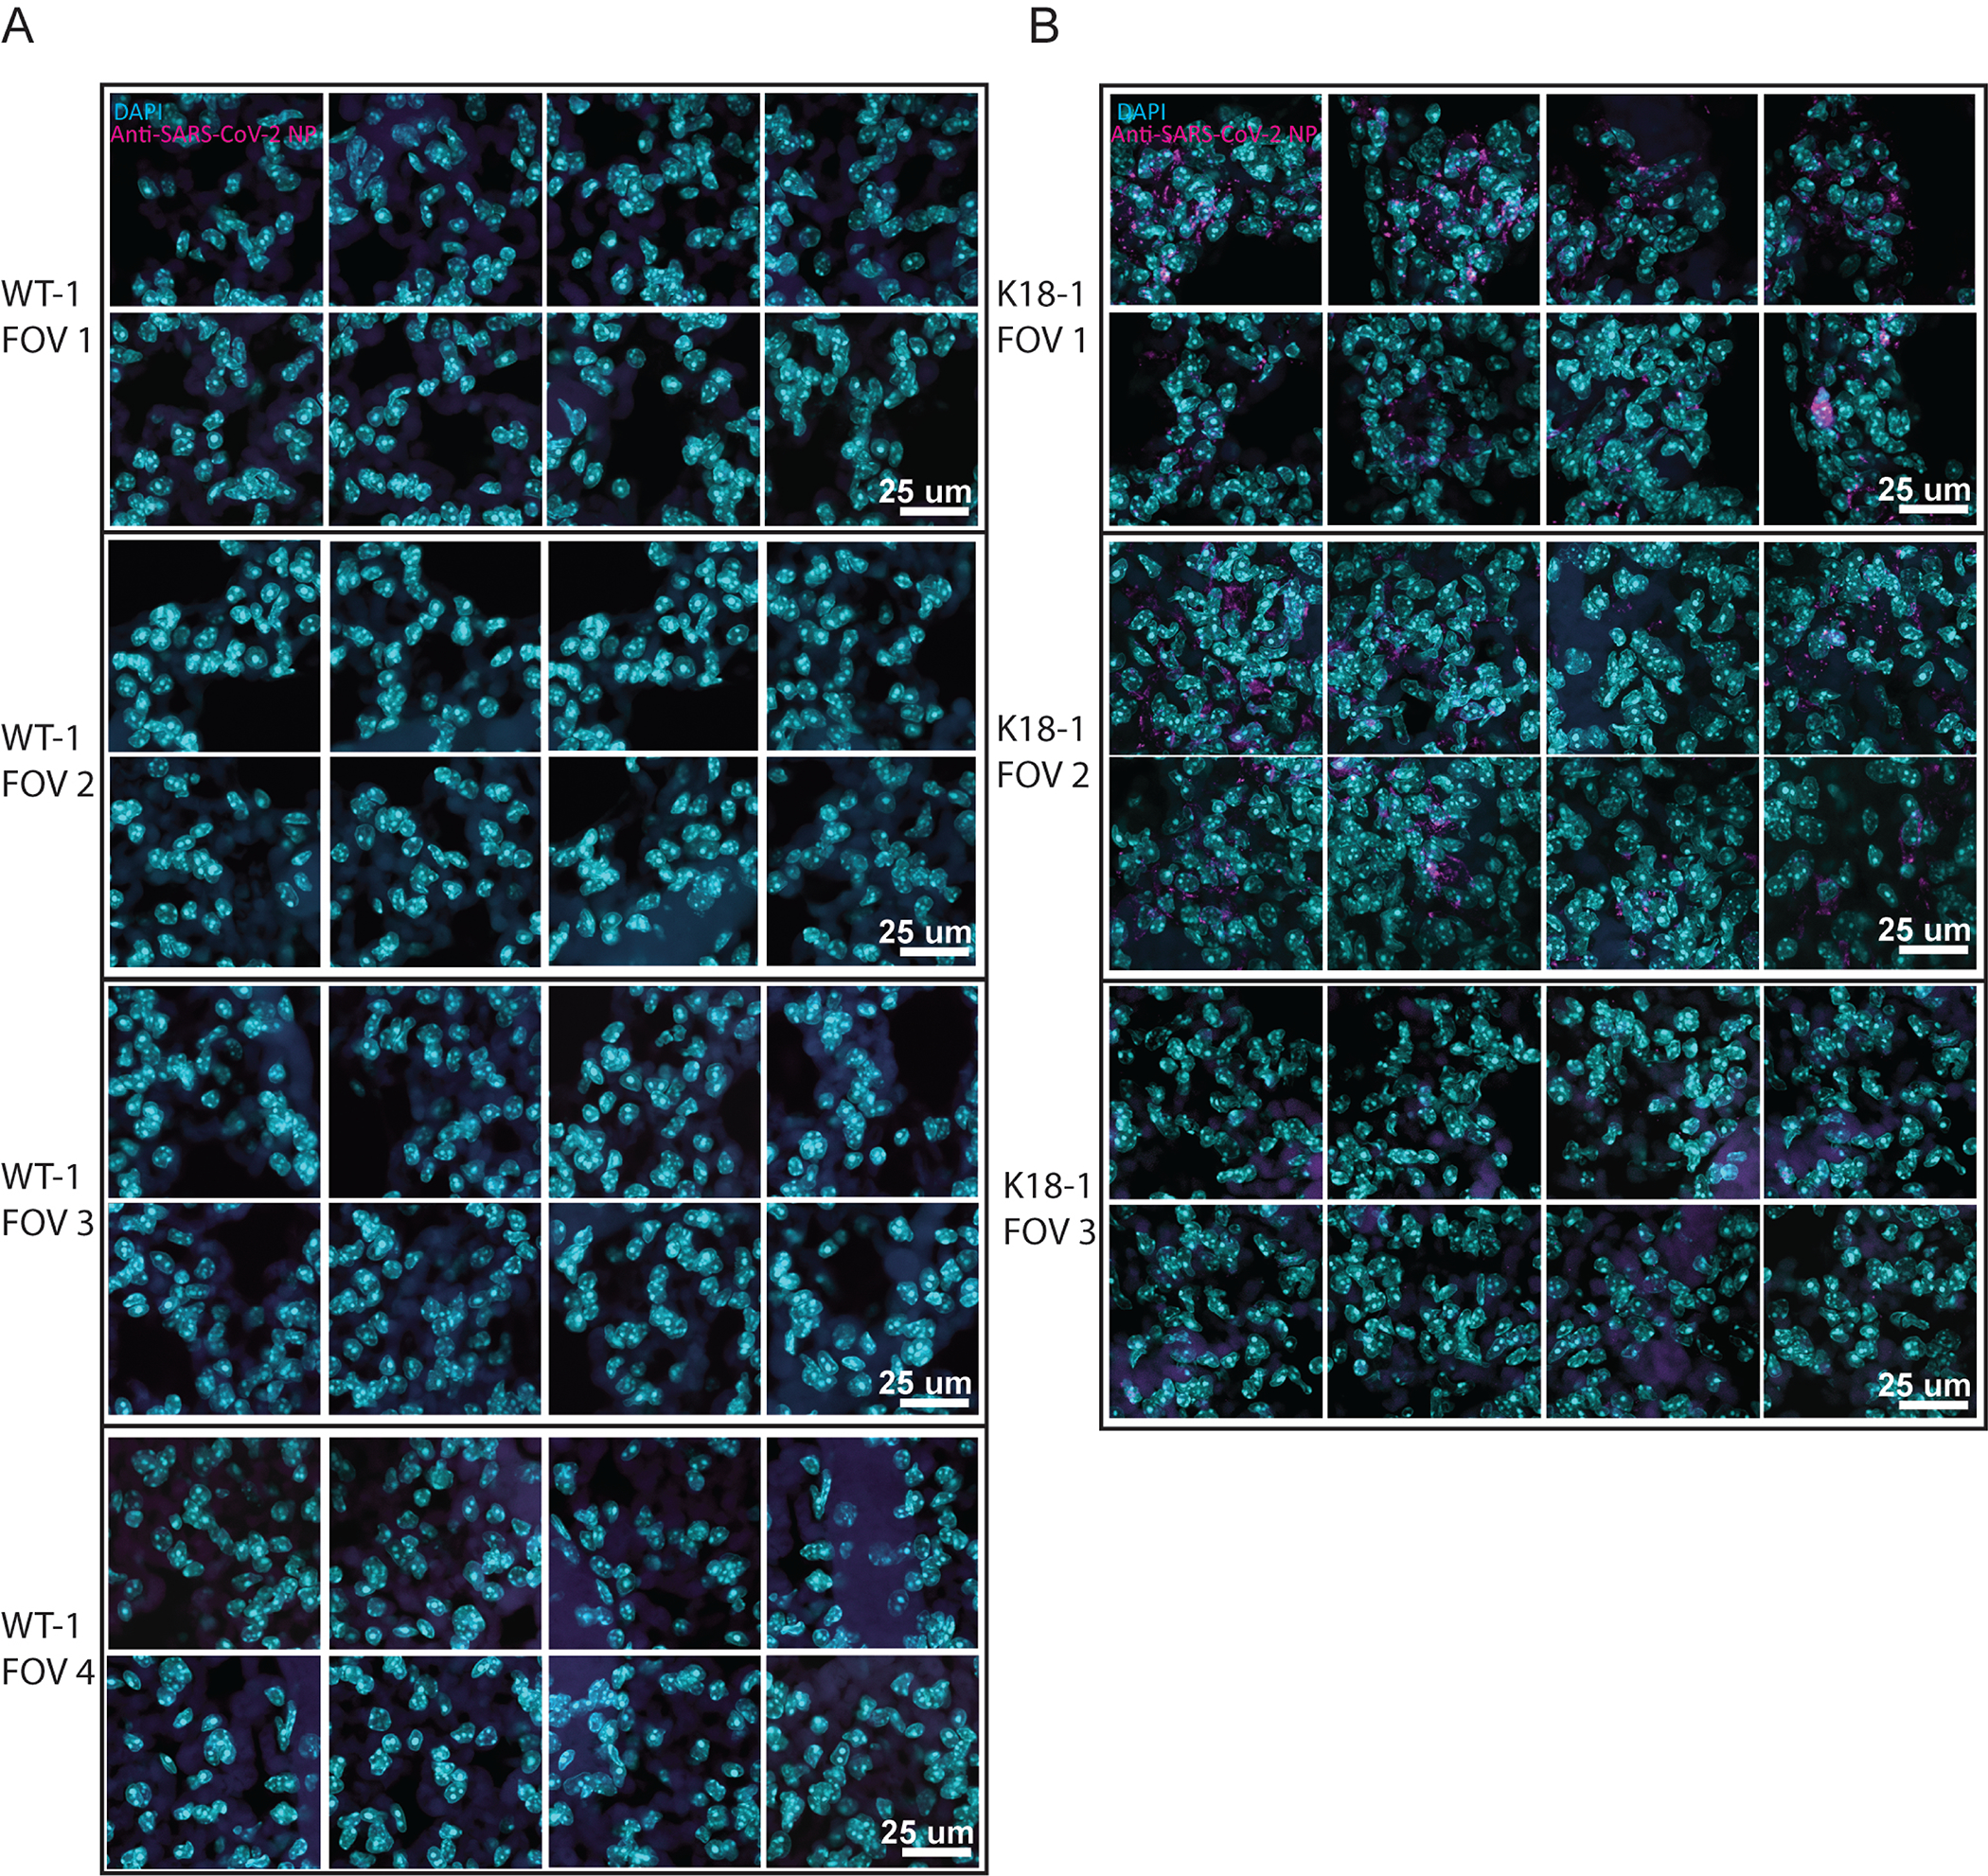
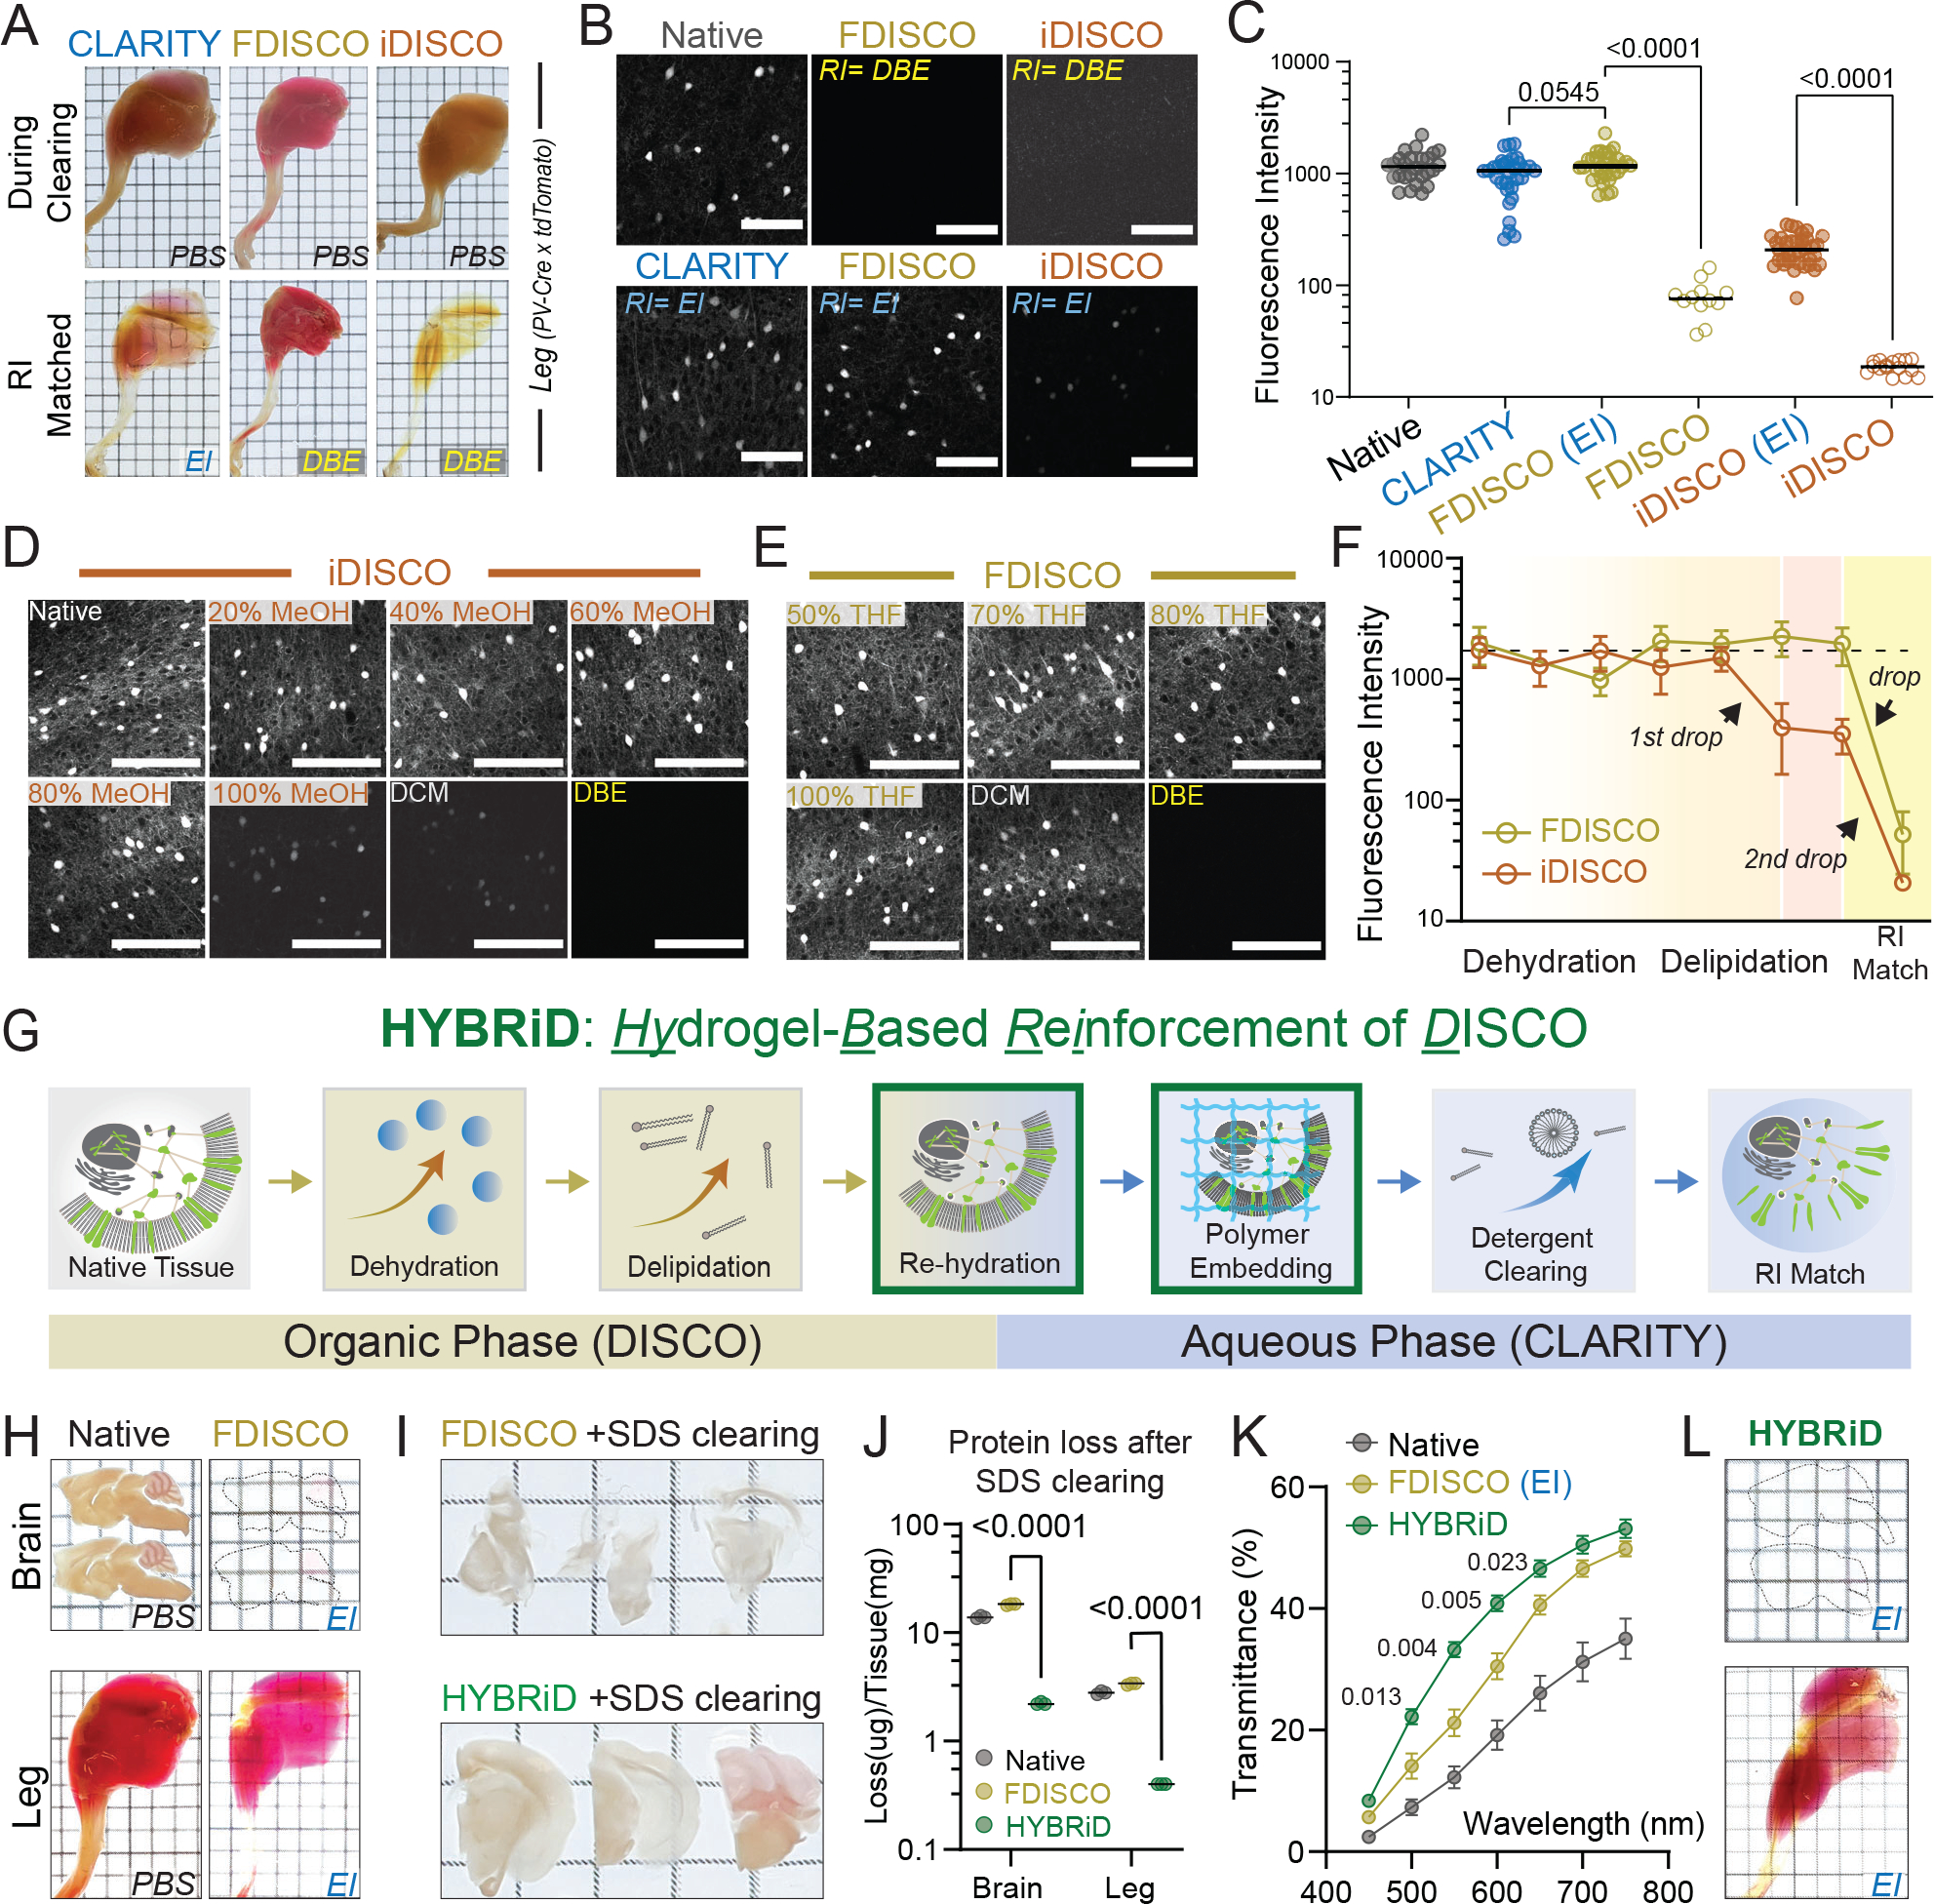
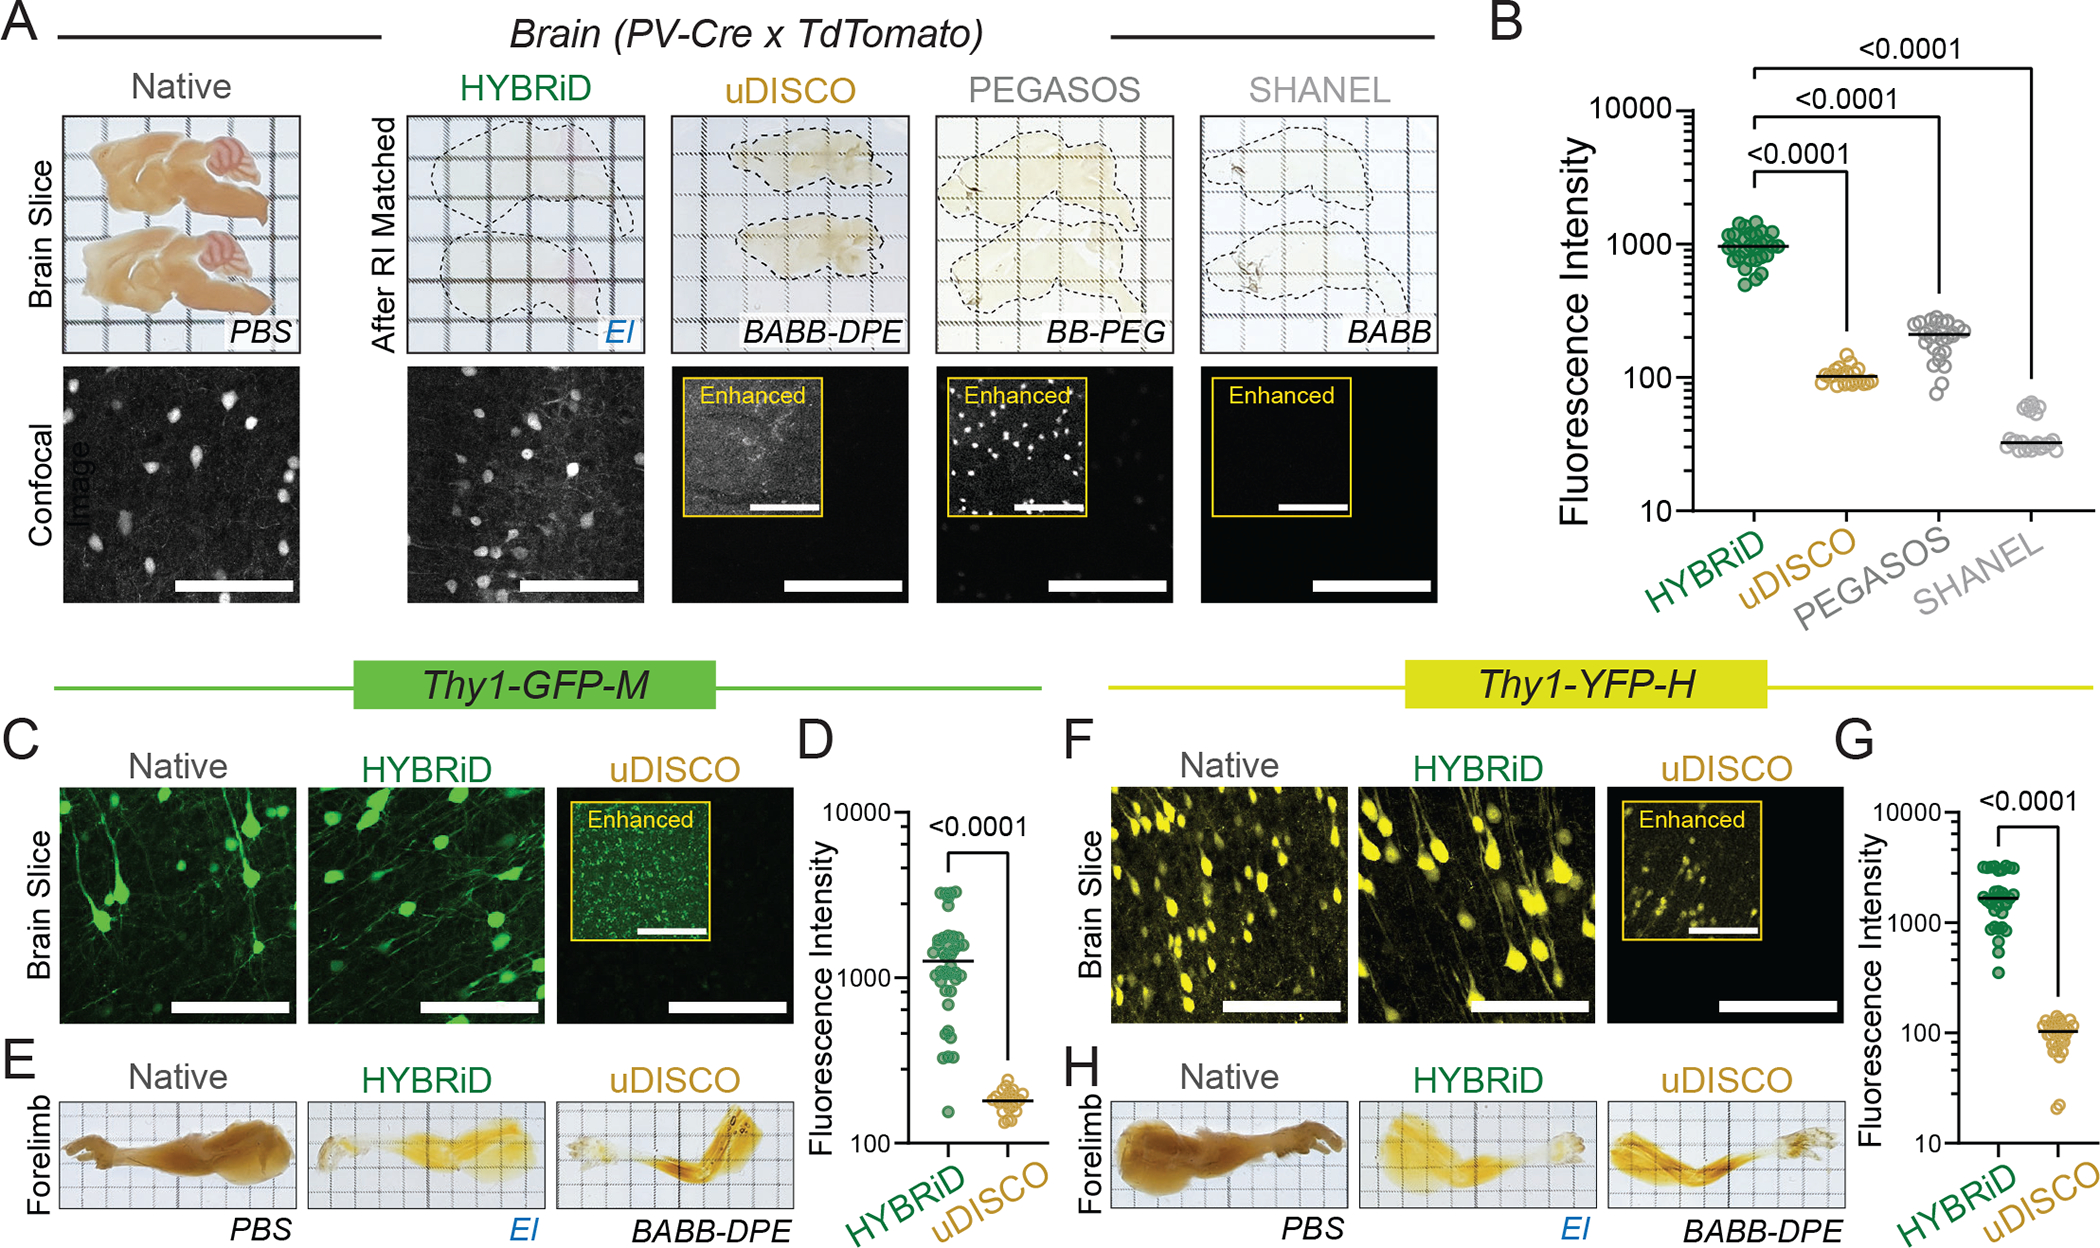
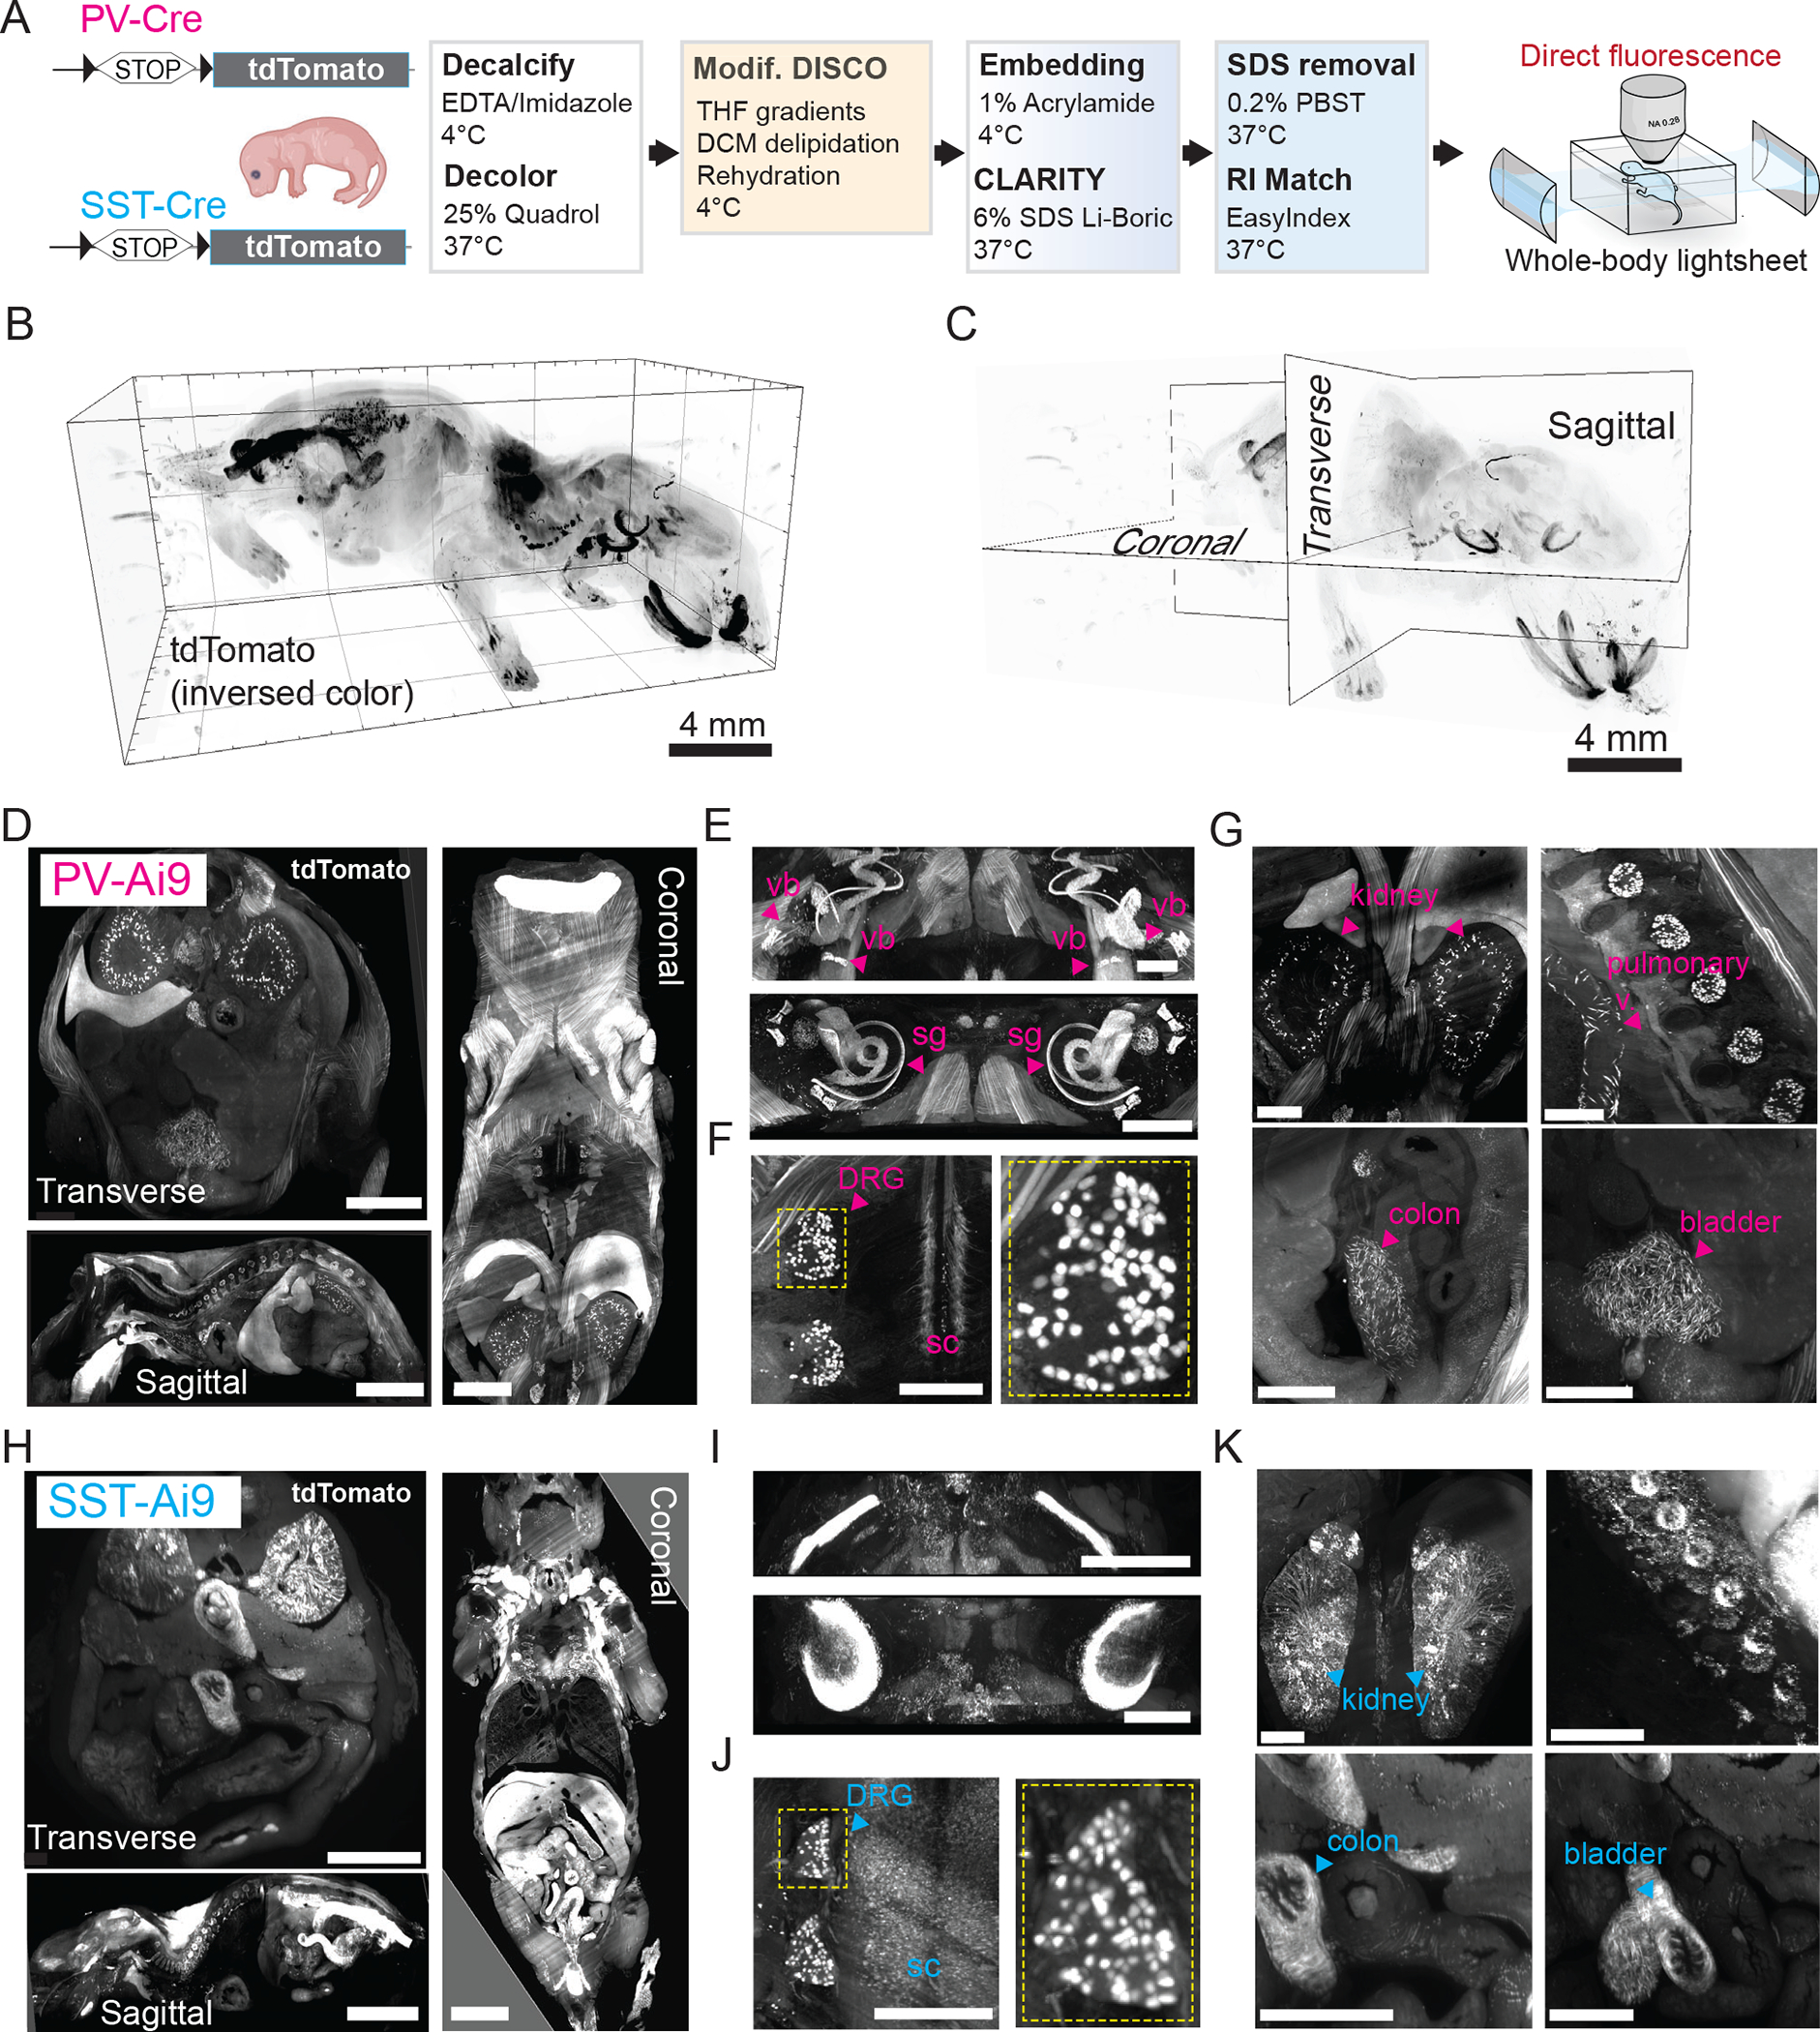
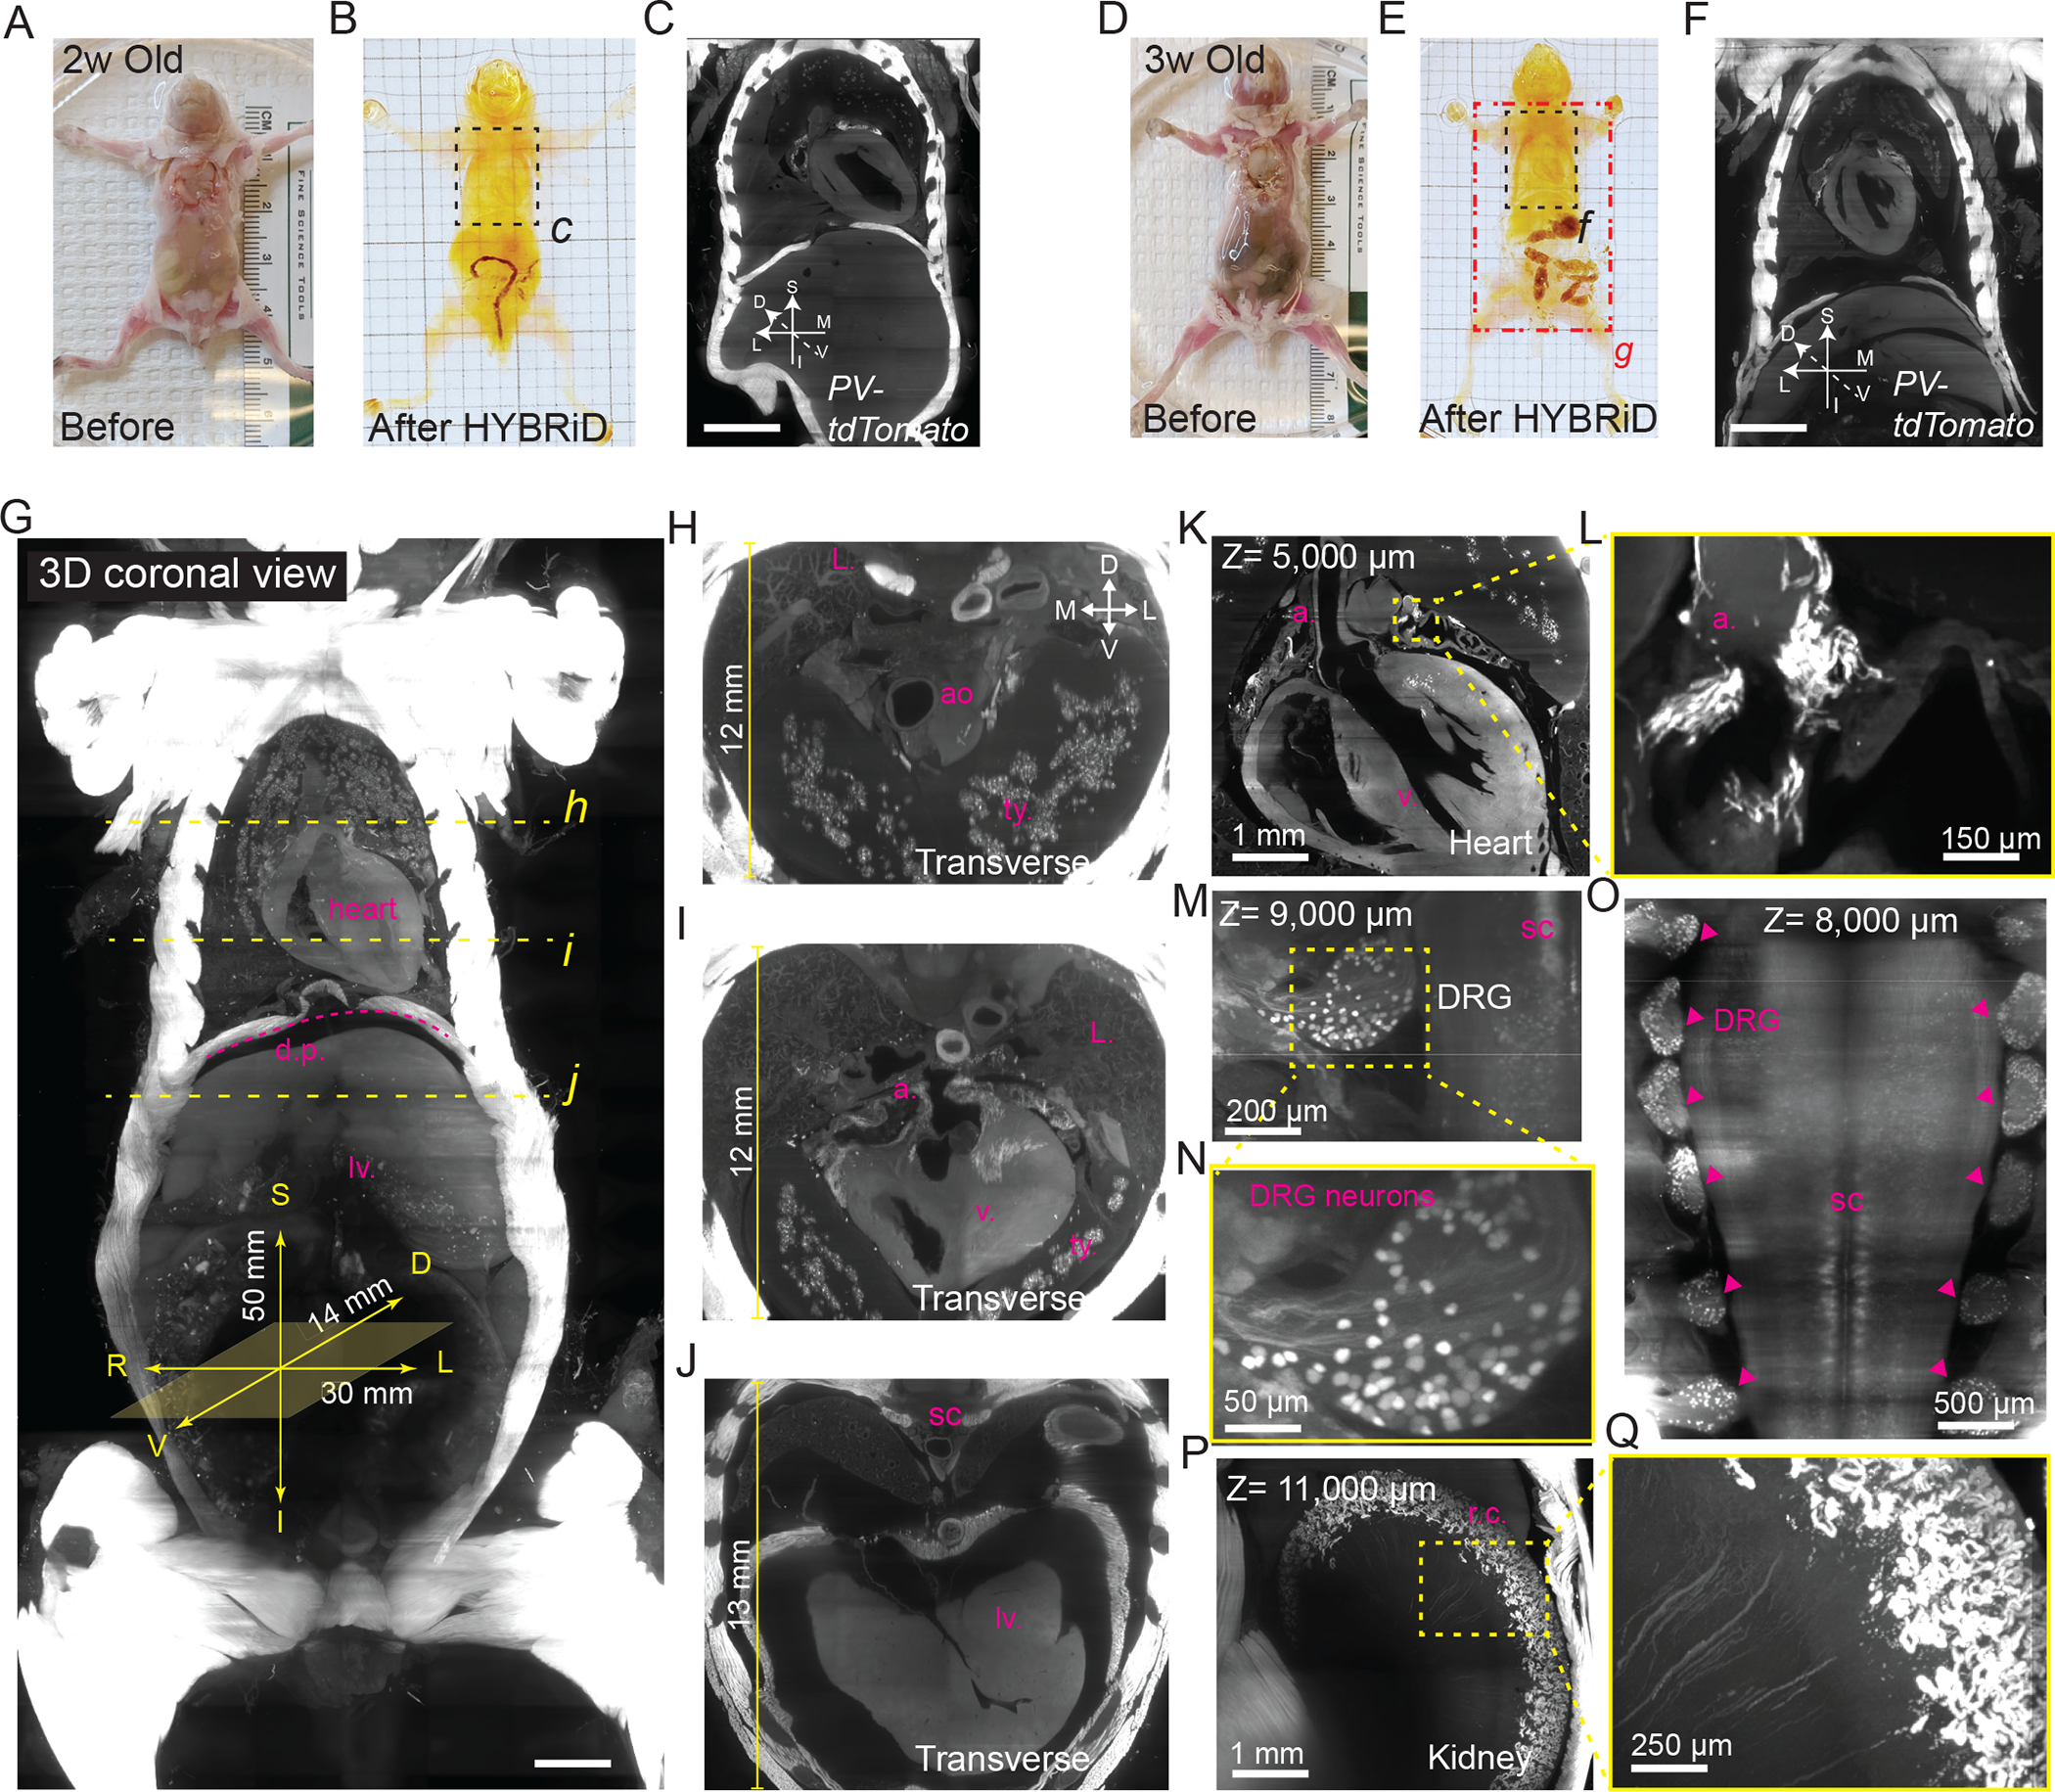
The recent development of solvent- and polymer-based brain-clearing techniques has advanced our ability to visualize the mammalian nervous system in three dimensions. However, it remains challenging to image the mammalian body en bloc. Here we developed HYBRiD (hydrogel-based reinforcement of three-dimensional imaging solvent-cleared organs (DISCO)), by recombining components of organic- and polymer-based clearing pipelines. We achieved high transparency and protein retention, as well as compatibility with direct fluorescent imaging and immunostaining in cleared mammalian bodies. Using parvalbumin- and somatostatin-Cre models, we demonstrated the utility of HYBRiD for whole-body imaging of genetically encoded fluorescent reporters without antibody enhancement of signals in newborn and juvenile mice. Using K18-hACE2 transgenic mice, HYBRiD enabled perfusion-free clearing and visualization of SARS-CoV-2 infection in a whole mouse chest, revealing macroscopic and microscopic features of viral pathology in the same sample. HYBRiD offers a simple and universal solution to visualize large heterogeneous body parts or entire animals for basic and translational research.
COMPETING INTERESTS: The authors declare that they have no competing interests.
Figures
Extended Data Fig. 1. Development of HYBRiD.
A . Schematic of aqueous versus organic clearing…
Extended Data Fig. 1. Development of HYBRiD.
A. Schematic of aqueous versus organic clearing protocols. Yellow: organic phase. Blue: aqueous phase. B. Representative images of 1 mm sagittal PV-Ai9 brain slices processed by indicated clearing protocols from 6 samples per group. EI: EasyIndex; DBE: dibenzyl ether. Grid size: 3 mm. C. Quantification of signal-to-background ratio of TdTomato fluorescence signal in PV-Ai9 brain slices processed by indicated clearing protocols. Native (n = 26), CLARITY (n = 31), FDISCO (EI) (n = 30), FDISCO (n = 12), iDISCO (EI) (n = 35), iDISCO (n = 15). (n indicates numbers of measurements from 6 samples per condition). Statistical significance was determined by two-tailed t-tests. D. Representative signal intensity profiles of FDISCO (left) and iDISCO (right) processed PV-Ai9 brain slices in either organic (DBE) or aqueous (EI) RI matching solution. N = 3 for each condition. E. Representative MIP confocal images of 1 mm PV-Ai9 brain slices processed by the indicated clearing methods from 6 samples per condition. Scale bar: 3 mm.
Extended Data Fig. 2. Comparison of HYBRiD…
Extended Data Fig. 2. Comparison of HYBRiD and parental methods.
A . Quantification of fluorescence…
Extended Data Fig. 2. Comparison of HYBRiD and parental methods.
A. Quantification of fluorescence intensity of 1 mm PV-Ai9 brain slices of Native (n = 26), cleared by HYBRiD (n = 30) or FDISCO (n = 12). (n indicates numbers of measurements from 6 samples per condition). Statistical significance of indicated comparison was determined by one-way ANOVA. B. Quantification of transparency of brain slices. All values are mean ± SEM, N = 4 for each group. No significance between HYBRiD and FDISCO, determined by multiple unpaired t-tests. C. Representative images of brain slices processed by the indicated clearing method from 3 samples per condition after 7 days of SDS treatment. D - E. Quantification of protein loss in brain slices (D) and hindlimb (E) during passive SDS clearing. N = 3 per group. Statistical significance was determined by one-way ANOVA. F. Size changes of brain slices after CLARITY, FDISCO and HYBRiD. No significant size changes were detected between CLARITY and HYBRiD. N = 3 per group. Statistical significance was determined by one-way ANOVA.
Extended Data Fig. 3. Comparison of HYBRiD…
Extended Data Fig. 3. Comparison of HYBRiD and organic clearing methods.
A . Representative images…
Extended Data Fig. 3. Comparison of HYBRiD and organic clearing methods.
A. Representative images of hindlimb from PV-Ai9 adult mice processed by the indicated clearing protocols from 6 samples per condition. RI matching media is labeled. B. Quantification of signal-to-background ratio of TdTomato fluorescence signal in PV-Ai9 brain slices processed by HYBRiD (n = 29), uDISCO (n = 22), PEGASOS (n = 28), SHANEL (n = 24). (n indicates numbers of measurements from 4 samples per condition). Statistical significance was determined by one-way ANOVA. C. Quantification of signal-to-background ratio of GFP fluorescence signal in Thy1-GFP-M brain slices processed by HYBRiD (n = 40) or uDISCO (n = 24) (n indicates numbers of measurements from 5 samples per condition). Statistical significance was determined by two-tailed t-test. D. Representative images of hindlimb from Thy1-GFP-M adult mice cleared by HYBRiD or uDISCO (4 samples per group). E. Representative lightsheet images (3D MIP) of forelimb from Thy1-GFP-M adult mice cleared by HYBRiD or uDISCO. F. Quantification of signal to background ratio of YFP fluorescence signal in Thy1-YFP-H brain slices processed by HYBRiD (n = 34) or uDISCO (n = 32) (n indicates numbers of measurements from 5 samples per condition). Statistical significance was determined by two-tailed t-test. G. Representative images of hindlimb from Thy1-YFP-H adult mice cleared by HYBRiD or uDISCO (4 samples per group). H. Representative lightsheet images (3D MIP) of forelimb from Thy1-YFP-H adult mice cleared by HYBRiD or uDISCO from 4 samples per group. Grid size: 3 mm. Scale bar: 1 mm.
Extended Data Fig. 4. Comparison of HYBRiD…
Extended Data Fig. 4. Comparison of HYBRiD and other methods on clearing of newborn mice.
A,B. Representative brightfield images of PV-Ai9 newborn mice processed by indicated clearing methods and RI matched in the indicated media (3 samples per condition). Grid size: 3 mm. C - E. Overview of lightsheet imaging of PV-Ai9 newborn mice cleared by the indicated clearing protocols. 3D volume of cleared PV-Ai9 mice from each clearing protocol is shown in coronal view (C), sagittal view (D), and transverse view (E). Note HYBRiD, SHANEL, and uDISCO sample were imaged fully through the D-V axis. D, dorsal; V, ventral; S, superior; I, inferior; L, lateral; M, medial. Scale bar: 2 mm.
Extended Data Fig. 5. HYBRiD clearing of…
Extended Data Fig. 5. HYBRiD clearing of juvenile mice.
A – G . Overview of…
Extended Data Fig. 5. HYBRiD clearing of juvenile mice.
A – G. Overview of lightsheet imaging of 2-week-old PV-Ai9 mice cleared by HYBRiD from 4 samples. Transverse (A) and sagittal (B) views showing the chest and heart. Zoom-in views of multiple tissues including heart (C), DRG (D), kidney (E), lung (F) and thymus (G). Labels: atrium(a.), thymus (t.y.), aorta (ao), ventricle (v.), lung (L.), spinal cord (sc), pulmonary vasculature (p.v.), renal cortex (r.c.), and liver (lv.) H – N. Overview of lightsheet imaging of 3-week-old PV-Ai9 mice cleared by HYBRiD from 3 samples. Transverse (H) and sagittal (I) views showing the chest and heart. Zoom-in views of multiple tissues including heart (J), DRG (K), kidney (L), lung (M) and thymus (N). O – P. 3D volume of lightsheet imaging of 3-week-old PV-Ai9 mice cleared by HYBRiD. D, dorsal; V, ventral; S, superior; I, inferior; L, lateral; M, medial. Scale bar: O: 5,000 μm; P: 3,000 μm; A, B, H, I: 1,500 μm; C, J: 1,000 μm; D, F, G, K, M, N: 200 μm; E, L: 150 μm. Inserts in D and K: 50 μm.
Extended Data Fig. 6. SARS-CoV nucleoprotein in…
Extended Data Fig. 6. SARS-CoV nucleoprotein in WT and K18-hACE2 lung.
MIP of 40x confocal…
Extended Data Fig. 6. SARS-CoV nucleoprotein in WT and K18-hACE2 lung.
MIP of 40x confocal imaging of anti-SARS-CoV nucleoprotein stained lung from WT (A) or K18-hACE2 (B) (3 samples per group). FOV 3 in (B) shows a region with low viral infection as an internal negative control.
Fig. 1:. Development and characterization of HYBRiD…
Fig. 1:. Development and characterization of HYBRiD method.
A. Representative images of whole-mount adult PV-Ai9…
Fig. 1:. Development and characterization of HYBRiD method.
A. Representative images of whole-mount adult PV-Ai9 hindlimbs processed by indicated protocols. EI: EasyIndex; DBE: dibenzyl ether. B. Representative confocal images of 1mm PV-Ai9 brain slices processed by indicated protocols. Native samples were fixed in PFA without clearing. Showing tdTomato+ neurons in neocortex. C. Quantification of fluorescence intensity of each condition in (B): Native (26), CLARITY (31), FDISCO (EI) (30), FDISCO (12), iDISCO (EI) (35), iDISCO (15). Data are presented as raw values and mean values. Statistical significance was determined by two-tailed t-tests. D-E. Representative images and (F) quantification of time-course analysis of fluorescence quenching. 1mm brain slices were processed and stopped at individual timepoints. N = 10–16 for each step in each method. Data are presented as mean values ± SD. G. Schematic of the HYBRiD protocol. h. Representative images of PV-Ai9 brain slice and hindlimb before and after FDISCO. I. Representative images of FDISCO (top) or HYBRiD (bottom) brain slices after 7 days of SDS treatment. J. Quantification of protein loss during passive SDS clearing. Data are presented as raw values and mean values. Statistical significance was determined by two-tailed t-tests. N = 3 for each group. K. Quantification of transparency of hindlimbs. All values are mean ± SEM, N =6 for each group. Statistical significance (false discovery rate) between HYBRiD and FDISCO was determined by multiple unpaired t-tests with two-stage step-up. L. Representative images of PV-Ai9 brain slice and hindlimb processed by HYBRiD. Grid size: 3mm; scale bar: 100 μm.
Fig. 2:. Comparing HYBRiD with other clearing…
Fig. 2:. Comparing HYBRiD with other clearing methods.
A. Representative backlit (top) and confocal (bottom)…
Fig. 2:. Comparing HYBRiD with other clearing methods.
A. Representative backlit (top) and confocal (bottom) images of 1mm PV-Ai9 brain slices processed by indicated protocols. Showing tdTomato+ neurons in neocortex. Contrast enhanced (8-fold) images are shown in insets. HYBRiD samples were imaged with 1/4 laser power relative to other methods to avoid oversaturation. B. Quantification of tdTomato fluorescence intensity for HYBRiD (29), uDISCO (22), PEGASOS (28), SHANEL (24) (N=4 samples per condition). Statistical significance was determined by one-way analysis of variance (ANOVA). C – D. Comparison of HYBRiD, uDISCO on GFP fluorescence preservation. Representative images (C) and quantification (D) of GFP fluorescence intensity in Thy1-GFP-M brain slices cleared by HYBRiD (40) or uDISCO (24) (N=5 samples per condition). Statistical significance was determined by two-tailed t-test. E. Representative images of forelimb from Thy1-GFP-M mice cleared by HYBRiD or uDISCO. F – G. Comparison of HYBRiD, uDISCO on YFP fluorescence preservation. Representative images (F) and quantification (G) of YFP fluorescence intensity in brain slices cleared by HYBRiD (34) or uDISCO (32) (N=5 samples per condition). Statistical significance was determined by two-tailed t-test. H. Representative images of forelimb from Thy1-YFP-H mice cleared by HYBRiD or uDISCO. Grid size: 3mm; scale bar: 100 μm.
Fig. 3:. HYBRiD Profiling of PV- and…
Fig. 3:. HYBRiD Profiling of PV- and SST-tdTomato expression in newborn mice.
A. Workflow of…
Fig. 3:. HYBRiD Profiling of PV- and SST-tdTomato expression in newborn mice.
A. Workflow of HYBRiD clearing of whole-body newborn mice. B. 3D lightsheet image volume of newborn mouse after HYBRiD (12 × 12 × 10mm), in-plane resolution=1.75μm, z step=4μm. C. Schematic showing digital slicing planes on 3D volume image to collect images in (D) and (H). D. 500μm digital slice views of PV-Ai9 cleared newborn mouse in planes shown in (C). Clear structures throughout dorsal to ventral regions. Scale: Transverse – 1mm, Sagittal – 4mm, Coronal – 2mm. E. 3D block of inner ear of PV-Ai9 mouse showing detailed structures of the cochlea (vb-vestibular bodies; sg-spiral ganglia). F. Slice view of PV-Ai9 mouse showing expression in the dorsal root ganglia (DRG) neurons and intermediate spinal cord pathways (sc-spinal cord). G. PV expression in multiple abdominal organs and pulmonary vasculature. H-K. The equivalent structures in SST-Ai9 newborn mice as in D-G. Scale bar: 1 mm unless specified.
Fig. 4:. HYBRiD Profiling of PV-tdTomato expression…
Fig. 4:. HYBRiD Profiling of PV-tdTomato expression in juvenile mice.
A-F. Representative images of 2-week-old…
Fig. 4:. HYBRiD Profiling of PV-tdTomato expression in juvenile mice.
A-F. Representative images of 2-week-old (A-C) and 3-week-old (D-F) PV-Ai9 mice before (A and D) and after HYBRiD clearing (B and E). 3D lightsheet image volumes (as maximum intensity projection, MIP) of the outlined chest areas were shown in C and D. G. MIP of 3D lightsheet image volume of the 3-week PV-Ai9 mouse as indicated in the red rectangle area in (E). Yellow dashed line indicated where digital transverse sections (H, I, and J) were taken, showing detailed structures of the thymus (t.y.), aorta (ao), atrium (a.), ventricle (v.), lung (L.), diaphragm (d.p.), spinal cord (s.c), and liver (lv.). D, dorsal; V, ventral; S, superior; I, inferior; L: left; R: right. K – Q. Representative 3D views of 3-week PV-Ai9 mice showing PV-tdTomato expression in the heart (K), DRG (M), intermediate spinal cord spinal cord (O), and kidney (P-Q). L. Zoom-in view of the yellow square in K, showing PV-tdTomato expression restricted in the atrium. M. Zoom-in view of the yellow square in M, showing single cell resolution DRG neurons. P. Zoom-in view of the yellow square in P, showing PV-tdTomato expression restricted in renal cortex (r.c.). Scale bar: G: 2,500 μm; C,F: 2,000 μm.
Fig. 5:. Visualization of a SARS-CoV-2 infected…
Fig. 5:. Visualization of a SARS-CoV-2 infected whole mouse chest by HYBRiD.
A. Workflow of…
Fig. 5:. Visualization of a SARS-CoV-2 infected whole mouse chest by HYBRiD.
A. Workflow of HYBRiD clearing and immunostaining of WT or K18-hACE2 transgenic mice 5 days post infection (DPI) with SARS-CoV-2 B – D. Representative image of the chest at different stages of HYBRiD clearing. E – F. MIP of 3D lightsheet image volume of immunostained WT (E) or K18-hACE2 (F) chest (19mm × 19mm × 13mm). G. 100μm slice view from (F). White arrows indicate absence of nucleoprotein, yellow arrows indicate clusters of viral signal. H - J. Transverse (H), coronal (I) and sagittal (J) view of the chest of SARS-CoV-2 infected mouse. b, bronchi; cw, chest wall; pc, pleural cavity; pa, pulmonary artery; pv, pulmonary vein; sc, spinal cord; tao, thoracic aorta. ao, aorta; be, bronchiole; es, esophagus; il, inferior lobe; sl, superior lobe; th, thymus; icm, intercostal muscles; ll, left lung; ri, ribs. K. MIP of 3D lightsheet image volume of a half chest sample from another K18-hACE2 mouse. L. 10X confocal imaging of the white square region in K, indicating high levels of nucleoprotein indicating rampant infection. M. 40X confocal imaging of the white square region in L further stained with DAPI. Yellow arrows show multinucleated cells in K18-hACE2 but not WT lungs (N). Grid size: 3mm in all images
Erturk A et al. Three-dimensional imaging of solvent-cleared organs using 3DISCO. Nat Protoc 7, 1983–1995, doi:10.1038/nprot.2012.119 (2012).
-
DOI
-
PubMed
Renier N et al. iDISCO: a simple, rapid method to immunolabel large tissue samples for volume imaging. Cell 159, 896–910, doi:10.1016/j.cell.2014.10.010 (2014).
-
DOI
-
PubMed
Chi J, Crane A, Wu Z & Cohen P Adipo-Clear: A Tissue Clearing Method for Three-Dimensional Imaging of Adipose Tissue. J Vis Exp, doi:10.3791/58271 (2018).
-
DOI
-
PMC
-
PubMed
Perin P, Voigt FF, Bethge P, Helmchen F & Pizzala R iDISCO+ for the Study of Neuroimmune Architecture of the Rat Auditory Brainstem. Front Neuroanat 13, 15, doi:10.3389/fnana.2019.00015 (2019).
-
DOI
-
PMC
-
PubMed
Pan C et al. Shrinkage-mediated imaging of entire organs and organisms using uDISCO. Nat Methods 13, 859–867, doi:10.1038/nmeth.3964 (2016).
-
DOI
-
PubMed
METHOD REFERENCES
Tainaka K et al. Chemical Landscape for Tissue Clearing Based on Hydrophilic Reagents. Cell Rep 24, 2196–2210 e2199, doi:10.1016/j.celrep.2018.07.056 (2018).
-
DOI
-
PubMed
Ye L et al. Wiring and Molecular Features of Prefrontal Ensembles Representing Distinct Experiences. Cell 165, 1776–1788, doi:10.1016/j.cell.2016.05.010 (2016).
-
DOI
-
PMC
-
PubMed
Park YG et al. Protection of tissue physicochemical properties using polyfunctional crosslinkers. Nat Biotechnol, doi:10.1038/nbt.4281 (2018).
-
DOI
-
PMC
-
PubMed
Chi J, Crane A, Wu Z & Cohen P Adipo-Clear: A Tissue Clearing Method for Three-Dimensional Imaging of Adipose Tissue. J Vis Exp, doi:10.3791/58271 (2018).
-
DOI
-
PMC
-
PubMed
Qi Y FDISCO: Advanced solvent-based clearing method for imaging whole organs. Science Advances (2019).
-
PMC
-
PubMed