. 2022 Jul;63(4):478-489.
doi: 10.1111/vru.13085. Epub 2022 Mar 29.

Validation of ultrasonography for measurement of cartilage thickness in the equine carpus

Affiliations

Validation of ultrasonography for measurement of cartilage thickness in the equine carpus

Camilla Andersen et al. Vet Radiol Ultrasound. 2022 Jul.

Abstract

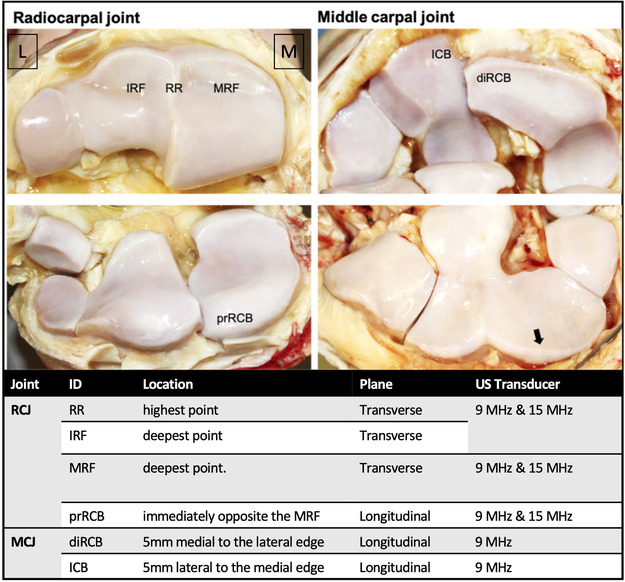
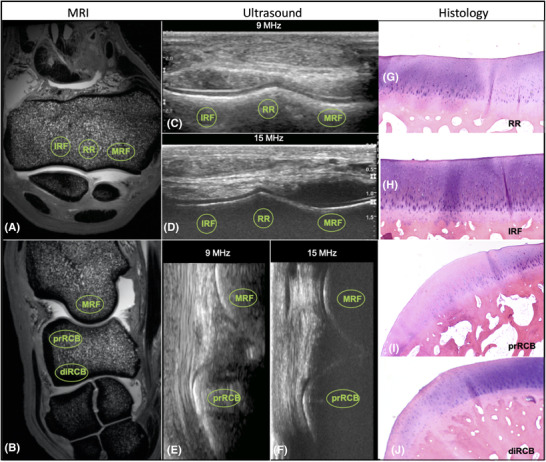
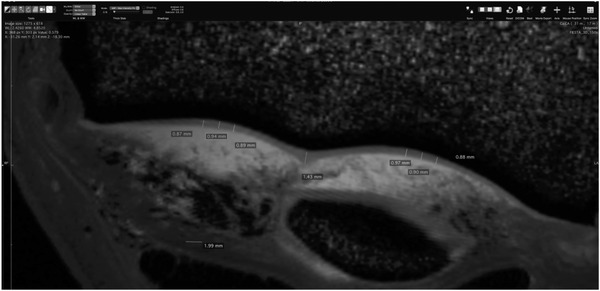
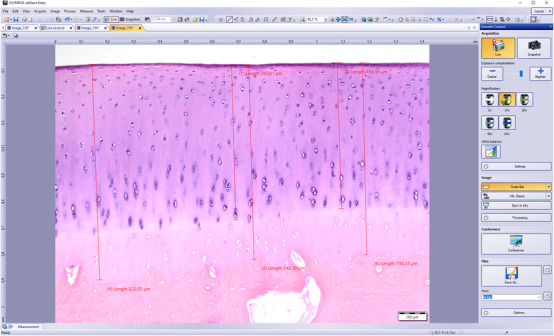
Articular cartilage thinning is an important hallmark of osteoarthritis (OA), and ultrasonography (US) is a clinically accessible tool potentially suitable for repeated evaluation. The aim of the present prospective methods comparison study was to validate US as a tool for measuring cartilage thickness in the carpus of the horse. Eight Standardbred trotters underwent US examination with 9 and 15 MHz linear transducers. Six anatomical locations in the radiocarpal joint (RCJ) and middle carpal joint (MCJ) were examined. The same joints were assessed by ultrahigh field (9.4 Tesla) magnetic resonance imaging (MRI) and histology. Associations between measurements obtained by the different modalities were assessed by ANOVA, Deming regression, Pearson correlation and Bland-Altman plots. Histologically assessed total cartilage thickness (the noncalcified cartilage (NCC) plus the calcified cartilage zone (CCZ)) overestimated thickness compared to MRI (P < 0.01) and US (P < 0.01). US 15 MHz had substantial agreement with MRI and NCC histology, and repeatability was acceptable (coefficient of variation = 8.6-17.9%) when used for assessment of cartilage thickness in the RCJ. In contrast, 9 MHz US showed poorer agreement with MRI and NCC histology, as it overestimated the thickness of thin cartilage and underestimated the thickness of thicker cartilage in the RCJ and MCJ. Moreover, repeatability was suboptimal (coefficient of variation = 10.4-26.3%). A 15 MHz transducer US is recommended for detecting changes in RCJ cartilage thickness or monitoring development over time, and it has the potential for noninvasive assessment of cartilage health in horses.

Keywords: front knee; histopathology; horse; orthopedic; ultrasound.


Conflict of interest statement

The authors have declared no conflict of interest.

Figures

FIGURE 1
FIGURE 1
Anatomical locations for cartilage thickness measurement. Abbreviations: RCJ, radiocarpal joint; MCJ, middle carpal joint; RR, radial ridge; IRF, intermediate radial facet; MRF, medial radial facet; prRCB, proximal radiocarpal bone; diRCB, distal radiocarpal bone; ICB, intermediate carpal bone. The cartilage of the third carpal bone could not be adequately visualized (arrow). Lateral is to the left
FIGURE 2
FIGURE 2
Representative images of the measured anatomical locations by dorsal (A) and sagittal (B) MRI, 9 MHz transverse (C) and 15 MHz transverse (D) ultrasound, 9 MHz longitudinal (E) and 15 MHz longitudinal ultrasound and histology (G–J). Thickness was measured at the most distal point for the location RR (G) and at the most proximal point for MRF and IRF (H), whereas the thickness was measured on the dorsal rim of the bone for all remaining locations (I,J). All locations are not shown with all modalities. RR, radial ridge; IRF, intermediate radial facet; MRF, medial radial facet; prRCB, proximal radiocarpal bone; diRCB, distal radiocarpal bone; MRI, magnetic resonance imaging
FIGURE 3
FIGURE 3
Representative ultrasound image transverse view showing measurement of the cartilage thickness at the medial radial facet with a 9 MHz linear transducer. Cartilage thickness is measured between the two hyperechoic lines representing the cartilage‐fluid interface and the cartilage‐bone interface. All measurements were repeated three times, and an average was used for analysis. Medial is to the left
FIGURE 4
FIGURE 4
Representative ultrasound image transverse view showing measurement of the cartilage thickness at the medial radial facet with a 15 MHz linear transducer. Medial is to the left
FIGURE 5
FIGURE 5
Representative magnetic resonance image dorsal view showing measurements of the cartilage thickness of the three anatomical locations of the radius. Cartilage thickness is measured between the low‐intensity subchondral bone and the high‐intensity synovial fluid
FIGURE 6
FIGURE 6
Representative histologic image showing hematoxylin and eosin‐stained cartilage at the medial radial facet sagittal view. The noncalcified cartilage is measured between the surface and the sharply delineated tidemark line. Total cartilage thickness was measured between the surface and the interface between the calcified cartilage zone and the subchondral bone. All measurements were repeated three times, and an average was used for analysis
FIGURE 7
FIGURE 7
All cartilage thickness measurements presented as boxplots with medians, interquartile range, and outliers. Measurements are divided by anatomical location and by measurement method. diRCB and ICB were not measured by 15 MHz ultrasound. Abbreviations: US, ultrasound; MRI, magnetic resonance imaging; NCC, noncalcified cartilage, RR, radial ridge; IRF, intermediate radial facet; MRF, medial radial facet; prRCB, proximal radiocarpal bone; diRCB, distal radiocarpal bone; ICB, intermediate carpal bone
FIGURE 8
FIGURE 8
Deming regression (A–D) with regression line, slope and intercept. Pearson's correlation coefficient (r) for each comparison is shown. Bland–Altman plots (E–H) visualizing the association between cartilage thicknesses measured by histology NCC, MRI, US 9 MHz, and US 15 MHz. There is a better association between modalities between US 15 MHz and both histology NCC (A) and MRI (B) than with the 9 MHz transducer (C) and (D). For the Bland–Altman plots, the mean difference is shown in red, and 2× SD is shown in blue. There is a tendency to a proportional bias when US 9 MHz is compared to both histological NCC and MRI (G) and (H). Abbreviations: US, ultrasound; MRI, magnetic resonance imaging; NCC, noncalcified cartilage [Colour figure can be viewed at wileyonlinelibrary.com]

Similar articles

Cited by

References

    1. Dyson PK, Jackson BF, Pfeiffer DU, Price JS. Days lost from training by two‐ and three‐year‐old Thoroughbred horses: a survey of seven UK training yards. Equine Vet J. 2008; 40(7):650‐657. - PubMed
    1. Schlueter AE, Orth MW. Equine osteoarthritis: a brief review of the disease and its causes. Equine Comp Exerc Physiol. 2004; 1(4):221‐231.
    1. Murray RC, Dyson SJ. EquineCarpus. 3th ed. Elsevier Inc; 2018;
    1. Ross MW. The Carpus. 2nd ed. Elsevier Inc; 2010;
    1. Goldring SR, Goldring MB. Changes in the osteochondral unit during osteoarthritis: structure, function and cartilage bone crosstalk. Nat Rev Rheumatol. 2016; 12(11):632‐644. - PubMed