. 2022 Dec 31;14(1):114-127.
doi: 10.1080/19382014.2022.2051991.

Modeling type 2 diabetes in rats by administering tacrolimus

Affiliations

Modeling type 2 diabetes in rats by administering tacrolimus

J C Quintana-Pérez et al. Islets. .

Abstract

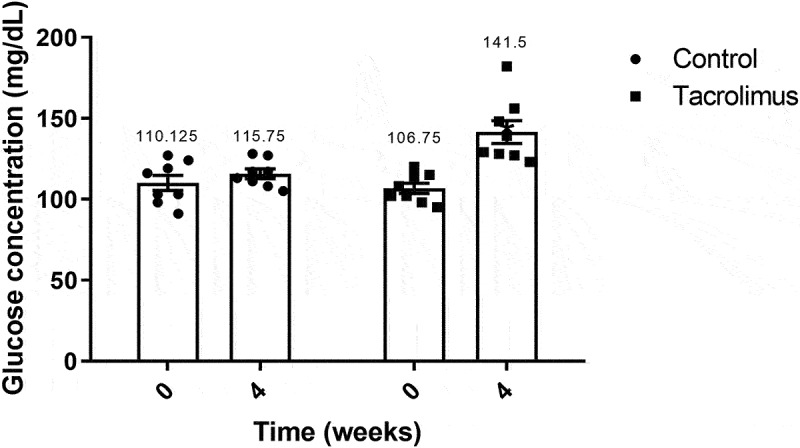
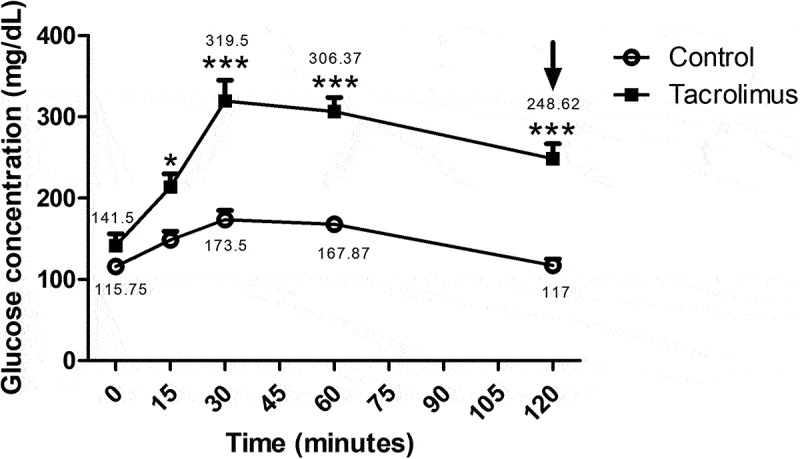
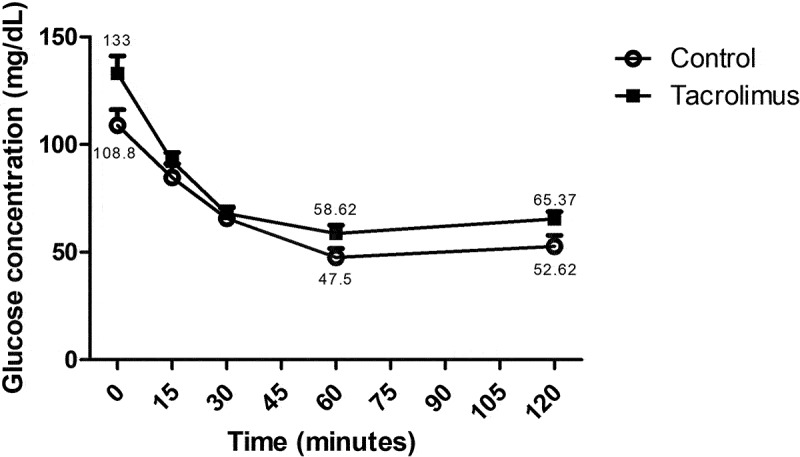
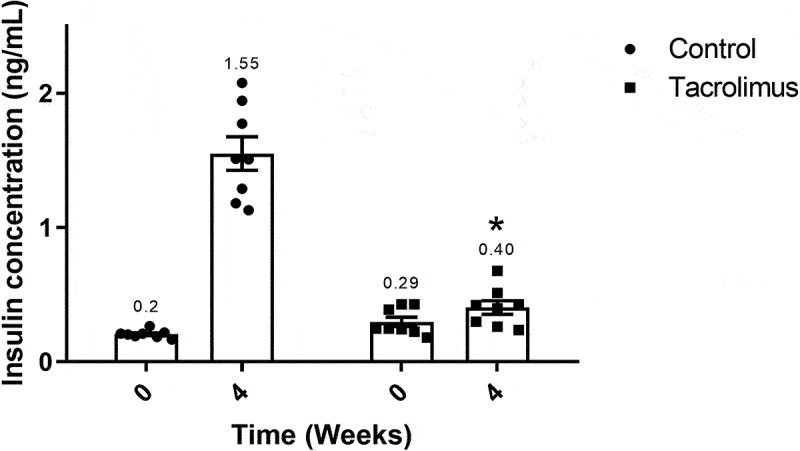
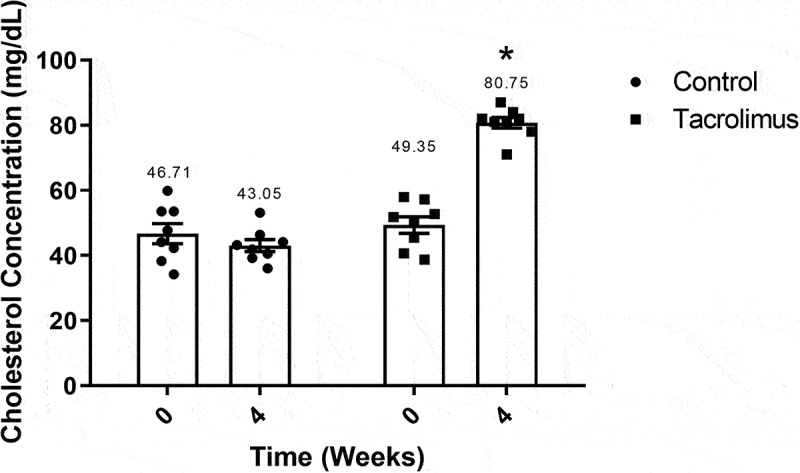
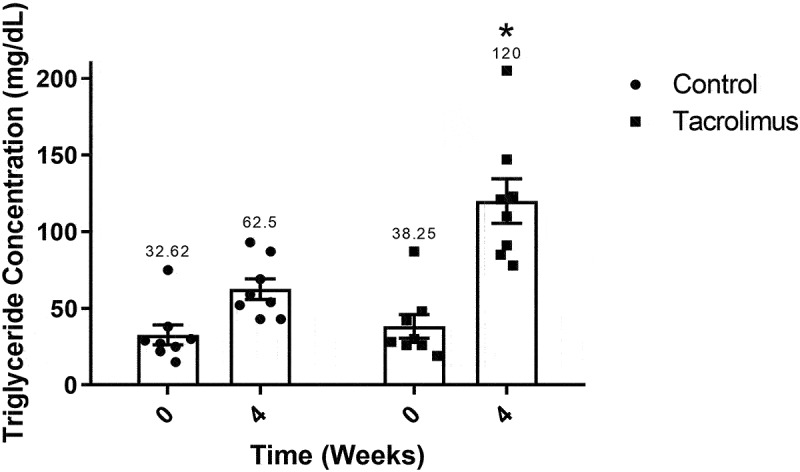
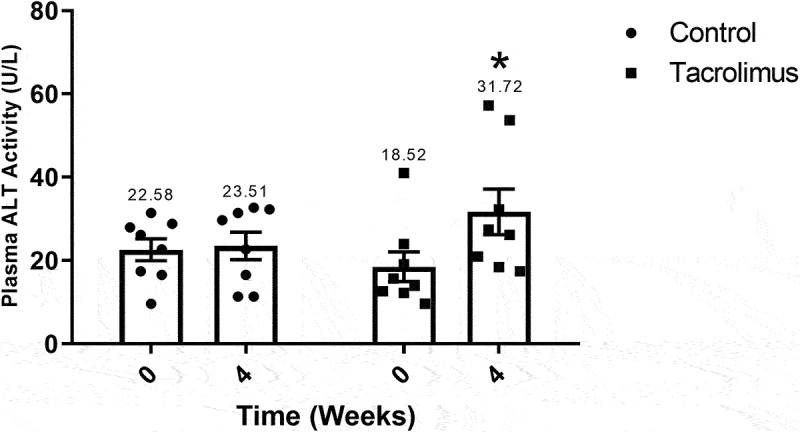
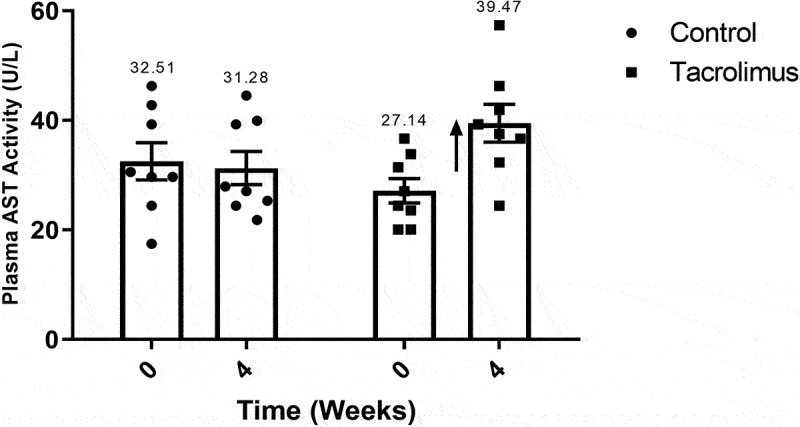
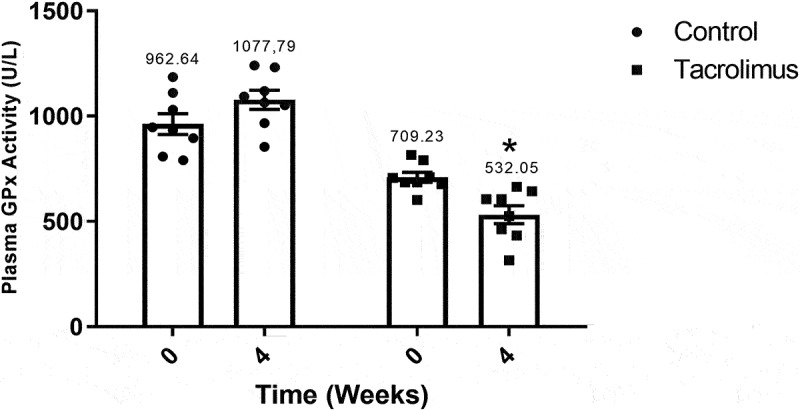
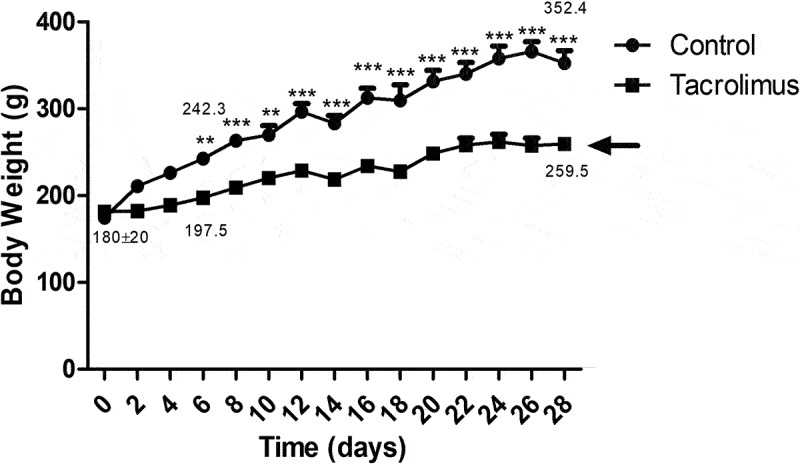
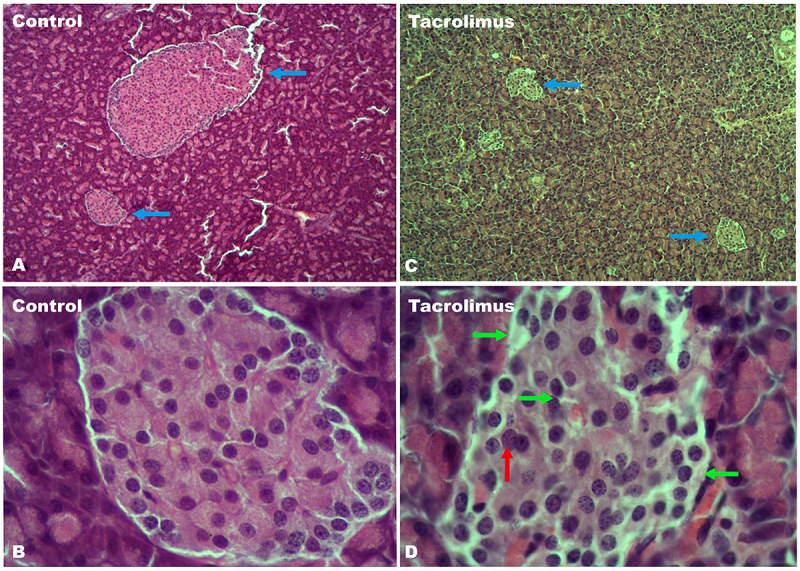
The prevalence of diabetes is rapidly increasing. The current number of diagnosed cases is ~422 million, expected to reach ~640 million by 2040. Type 2 diabetes, which constitutes ~95% of the cases, is characterized by insulin resistance and a progressive loss of β-cell function. Despite intense research efforts, no treatments are yet able to cure the disease or halt its progression. Since all existing animal models of type 2 diabetes have serious drawbacks, one is needed that represents the complete pathogenesis, is low cost and non-obese, and can be developed relatively quickly. The aim of this study was to evaluate a low-cost, non-obese model of type 2 diabetes engendered by administering a daily high dose of tacrolimus (an immunosuppressant) to Wistar rats for 4 weeks. The biochemical and antioxidant markers were measured at basal and after the 4-week tacrolimus treatment. At week 4, the values of these parameters closely resembled those observed in human type 2 diabetes, including fasting blood glucose at 141.5 mg/dL, blood glucose greater than 200 mg/dL at 120 min of the glucose tolerance test, blood glucose at varied levels in the insulin tolerance test, and elevated levels of cholesterol and triglyceride. The tacrolimus treatment produced hypoinsulinemia and sustained hyperglycemia, probably explained by the alteration found in pancreatic β-cell function and morphology. This model should certainly be instrumental for evaluating possible type 2 diabetes treatments, and for designing new immunosuppressants that do not cause pancreatic damage, type 2 diabetes, or new-onset diabetes after transplantation (NODAT).

Keywords: Wistar rat; hyperglycemia; modeling type 2 diabetes; pancreatic damage; tacrolimus.


Conflict of interest statement

No potential conflict of interest was reported by the author(s).

Figures

Figure 1.
Figure 1.
Fasting blood glucose concentration values at weeks 0 and 4. The graph of bars and points portrays a higher blood glucose concentration for the tacrolimus group at week 4 versus week 0, and higher at week 4 for the tacrolimus versus control group. There are two bars on the left and another two on the right, corresponding to the control and tacrolimus groups, respectively, in each case at weeks 0 and 4. Each bar represents the mean plus or minus the standard error, and each point expresses the average of three measurements made on each animal. The asterisk above the bar that corresponds to the tacrolimus group at week 4 indicates a significant difference compared to the tacrolimus group at week 0 and compared to the control group at week 4, with significance considered at 0.05 for the Student’s t-test. The control and tacrolimus groups each consisted of 8 animals, for a total of 16.
Figure 2.
Figure 2.
The glucose tolerance test, the animals were orally administered a dose of 1.5 grams of glucose per kilogram of body weight at week 4. The blood glucose concentration was measured at 0, 15, 30, 60 and 120 minutes, with three measurements taken at each time. The mean plus or minus the standard error of each measurement is represented as a point on the curve for each group. The asterisk located above the points of the upper curve indicates a significant difference between groups, with significance considered at 0.05 for the two-way repeated measures ANOVA test. The control and tacrolimus groups each consisted of 8 animals, for a total of 16.
Figure 3.
Figure 3.
The insulin tolerance test, 0.5 international units of rapid-acting insulin per kilogram of body weight were administered intraperitoneally to each animal in the two groups at week 4. The blood glucose concentration was determined at 0, 15, 30, 60 and 120 minutes. Each point on the curve represents the mean plus or minus the standard error of three measurements. Significant differences, considered at 0.05, were analyzed with the two-way repeated measures ANOVA test. The curve of the tacrolimus group is slightly above that of the control group, indicating decreased insulin sensitivity. Each group consisted of 8 animals, for a total of 16.
Figure 4.
Figure 4.
Plasma insulin concentration values at weeks 0 and 4. The graph of bars and points shows significantly greater values for the tacrolimus group at week 4 versus week 0, and greater values at week 4 for the tacrolimus versus control group. There are two bars on the left and two on the right, corresponding to the control and tacrolimus groups, respectively, in each case at weeks 0 and 4. Each bar represents the mean plus or minus the standard error, and each point expresses the average of three measurements made on each animal. The asterisk above the bar that corresponds to the tacrolimus group at week 4 indicates a significant difference with the control group, with significance considered at 0.05 for student’s t-test. Each group consisted of 8 animals, for a total of 16.
Figure 5.
Figure 5.
Total cholesterol concentration values are illustrated for weeks 0 and 4. The graph of bars and points portrays the higher level of cholesterol found in the tacrolimus group at week 4 versus week 0, and the higher level at week 4 for the tacrolimus versus control group. There are two bars on the left and two on the right, corresponding to the values for the control and tacrolimus groups, respectively, in each case at weeks 0 and 4. Each bar represents the mean plus or minus the standard error, and each point expresses the average of three measurements made on each animal. The asterisk above the bar that corresponds to the tacrolimus group at week 4 indicates a significant difference with the control group, with significance considered at 0.05 for the student’s t-test. Each group consisted of 8 animals, for a total of 16.
Figure 6.
Figure 6.
Triglyceride concentration values at weeks 0 and 4. The graph of bars and points displays a higher value for the tacrolimus group at week 4 versus week 0, and a higher value at week 4 for the tacrolimus versus control group. There are two bars on the left and two on the right, corresponding to the values for the control and tacrolimus groups, respectively, in each case at weeks 0 and 4. Each bar represents the mean plus or minus the standard error, and each point expresses the average of three measurements made on each animal. The asterisk above the bar that corresponds to the tacrolimus group at week 4 indicates a significant difference with the control group, with significance considered at 0.05 for the student’s t-test. Each group consisted of 8 animals, for a total of 16.
Figure 7.
Figure 7.
Alanine aminotransferase activity values at weeks 0 and 4. The graph of bars and points exhibits a higher value of ALT activity for the tacrolimus group at week 4 versus week 0, and a higher value at week 4 for the tacrolimus versus control group. There are two bars on the left and two on the right, corresponding to the control and tacrolimus groups, respectively, in each case at weeks 0 and 4. Each bar represents the mean plus or minus the standard error, and each point expresses the average of three measurements made on each animal. The asterisk above the bar that corresponds to the tacrolimus group at week 4 indicates a significant difference with the control group, with significance considered at 0.05 for the student’s t-test. Each group consisted of 8 animals, for a total of 16.
Figure 8.
Figure 8.
Aspartate aminotransferase activity values at weeks 0 and 4. The graph of bars and points depicts a greater value for the tacrolimus group at week 4 versus week 0, and a greater value at week 4 for the tacrolimus versus control group. There are two bars on the left and two on the right, corresponding to the control and tacrolimus groups, respectively, in each case at weeks 0 and 4. Each bar represents the mean plus or minus the standard error, and each point expresses the average of three measurements made on each animal. The vertical arrow pointing upwards, located at the side of the far right bar, indicates a tendency for enzymatic activity to weaken. Each group consisted of 8 animals, for a total of 16.
Figure 9.
Figure 9.
Glutathione peroxidase activity values at weeks 0 and 4. The graph of bars and points shows a greater value for the tacrolimus group at week 4 versus week 0, and a greater value at week 4 for the tacrolimus versus control group. There are two bars on the left and two on the right, corresponding to the control and tacrolimus groups, respectively, in each case at weeks 0 and 4. Each bar represents the mean plus or minus the standard error, and each point expresses the average of three measurements made on each animal. The asterisk above the bar that corresponds to the tacrolimus group at week 4 indicates a significant difference with the control group, with significance considered at 0.05 for the student’s t-test. Each group consisted of 8 animals, for a total of 16.
Figure 10.
Figure 10.
The body weight of the animals was assessed throughout the experiment and is depicted with two curves. The lower curve, representing less body weight, corresponds to the tacrolimus group. A difference between the curves can be appreciated immediately after the first administration of tacrolimus. Each point expresses the mean plus or minus the standard error. The asterisk placed on the values of the upper curve indicates a significant difference between the groups, with significance considered at 0.05 for the two-way repeated measures ANOVA test. Each group consisted of 8 animals, for a total of 16.
Figure 11.
Figure 11.
A view of the pancreatic tissue stained with hematoxylin-eosin is portrayed in four sections. Tissue samples were taken after the 4-week tacrolimus treatment. The coexistence of small and large islets in the control group is indicated by blue arrows in section A. In contrast, the sole presence of small islets in the tacrolimus rats is illustrated by blue arrows in section C. These two images were taken with 5x magnification. The structural integrity of normal pancreatic islets can be appreciated in the control tissue in section B. On the other hand, areas with a loss of structural integrity and of cell uniformity are seen in the tacrolimus-treated group, denoted by green arrows in section D. Additionally, there is an increase in connective tissue at the intercellular junctions of islet cells and between the islet cells and adjacent cells of the basement membrane. Finally, chromatin alterations are pointed out by red arrows. The latter two images were taken with 40x magnification.

References

    1. World Health Organization . Global report in diabetes. Geneva: World Health Organ. 2016.
    1. World Health Organization . Noncommunicable diseases country profiles.Geneva. World Health Organ. 2018. License: CC BY-NC-SA 3.0 IGO.
    1. American Diabetes Association . Diagnosis and classification of diabetes mellitus. Diabetes Care. 2014. Jan;37(Suppl 1):S81–90. PMID: 24357215. doi:10.2337/dc14-S081. - DOI - PubMed
    1. Thomas CC, Philipson LH.. Update on diabetes classification. Med Clin North Am. 2015. Jan;99(1):1–16. Epub 2014 Nov 22. PMID: 25456640. doi:10.1016/j.mcna.2014.08.015. - DOI - PubMed
    1. Persaud SJ, Jones PM. A wake-up call for type 2 diabetes? N Engl J Med. 2016. Sep 15;375(11):1090–1092. PMID: 27626524.doi:10.1056/NEJMcibr1607950. - DOI - PubMed

Publication types