

Chest CT of Lung Injury 1 Year after COVID-19 Pneumonia: The CovILD Study
- PMID: 35348379
- PMCID: PMC8988857
- DOI: 10.1148/radiol.211670
Chest CT of Lung Injury 1 Year after COVID-19 Pneumonia: The CovILD Study
Abstract
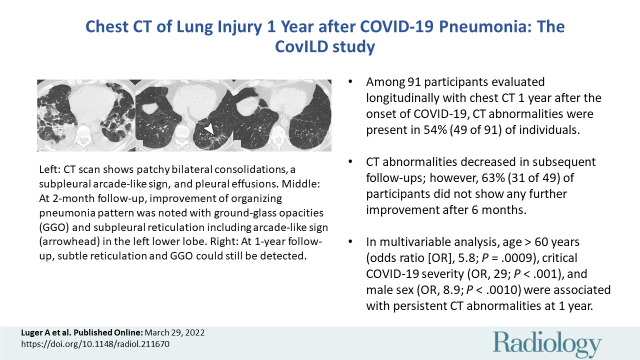
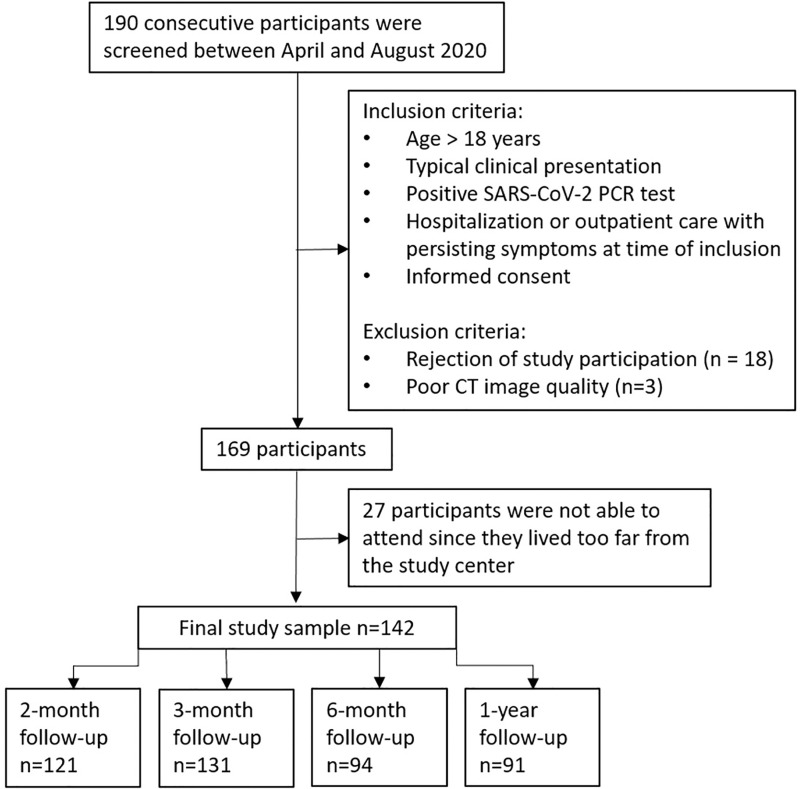
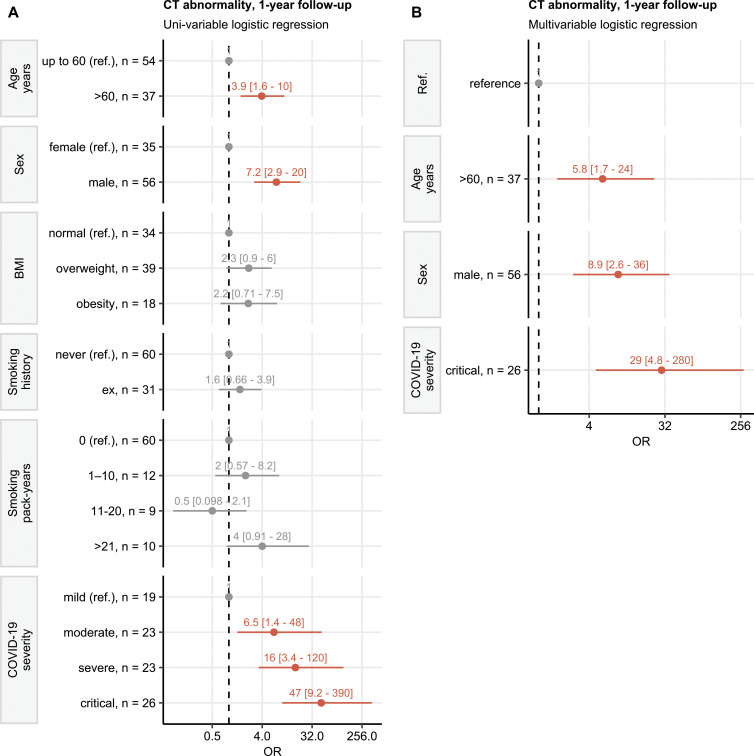
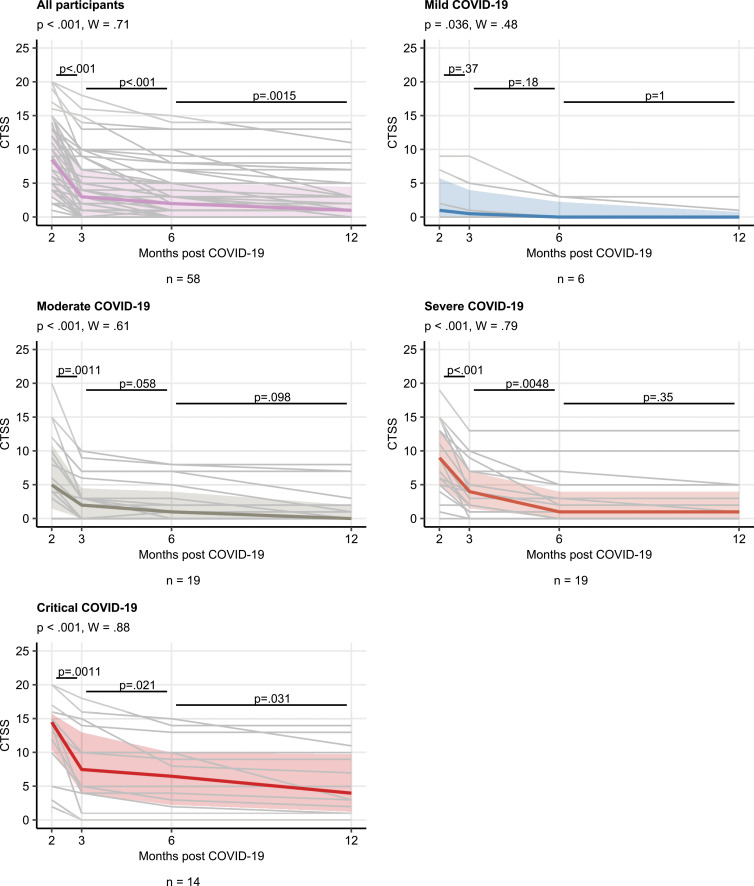
Background The long-term pulmonary sequelae of COVID-19 is not well known. Purpose To characterize patterns and rates of improvement of chest CT abnormalities 1 year after COVID-19 pneumonia. Materials and Methods This was a secondary analysis of a prospective, multicenter observational cohort study conducted from April 29 to August 12, 2020, to assess pulmonary abnormalities at chest CT approximately 2, 3, and 6 months and 1 year after onset of COVID-19 symptoms. Pulmonary findings were graded for each lung lobe using a qualitative CT severity score (CTSS) ranging from 0 (normal) to 25 (all lobes involved). The association of demographic and clinical factors with CT abnormalities after 1 year was assessed with logistic regression. The rate of change of the CTSS at follow-up CT was investigated by using the Friedmann test. Results Of 142 enrolled participants, 91 underwent a 1-year follow-up CT examination and were included in the analysis (mean age, 59 years ± 13 [SD]; 35 women [38%]). In 49 of 91 (54%) participants, CT abnormalities were observed: 31 of 91 (34%) participants showed subtle subpleural reticulation, ground-glass opacities, or both, and 18 of 91 (20%) participants had extensive ground-glass opacities, reticulations, bronchial dilation, microcystic changes, or a combination thereof. At multivariable analysis, age of more than 60 years (odds ratio [OR], 5.8; 95% CI: 1.7, 24; P = .009), critical COVID-19 severity (OR, 29; 95% CI: 4.8, 280; P < .001), and male sex (OR, 8.9; 95% CI: 2.6, 36; P < .001) were associated with persistent CT abnormalities at 1-year follow-up. Reduction of CTSS was observed in participants at subsequent follow-up CT (P < .001); during the study period, 49% (69 of 142) of participants had complete resolution of CT abnormalities. Thirty-one of 49 (63%) participants with CT abnormalities showed no further improvement after 6 months. Conclusion Long-term CT abnormalities were common 1 year after COVID-19 pneumonia. © RSNA, 2022 Online supplemental material is available for this article. See also the editorial by Leung in this issue.
Conflict of interest statement
Figures
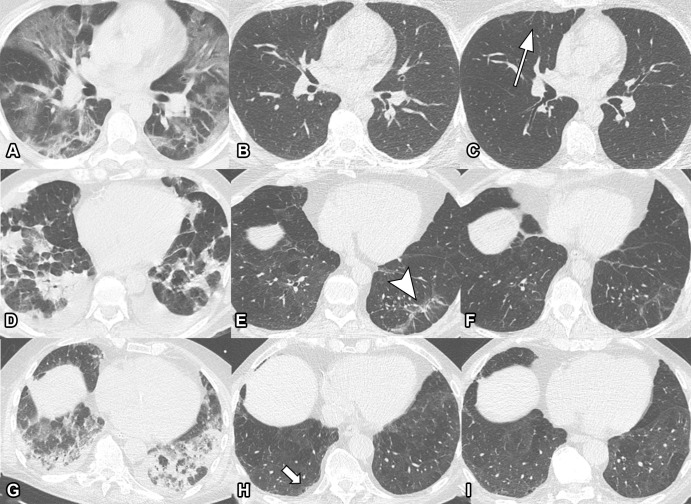
![Unenhanced axial (left) and sagittal (right) chest CT scans
corresponding to CT severity score. (A) Score of 1: minimal (subtle
ground-glass opacities [GGOs], few findings). Scans show subtle subpleural
GGO (arrow) in the right and left lower lobes. (B) Score of 2: low (several
GGOs, subtle reticulation). Scans show several subpleural GGOs and
superimposed reticulation (arrow) in the right and left lower lobes and the
left upper lobe. (C) Score of 3: moderate (multiple GGOs, reticulation,
small consolidation). Scans show multiple GGOs in all lobes. (D) Score of 4:
marked (extensive GGOs, consolidation, reticulation with distortion). Scans
show extensive subpleural GGOs and consolidations (arrow) in the dependent
lung. (E) Score of 5: massive (massive findings, parenchymal destructions).
Scans show massive consolidations in the dependent lung areas, as well as
extensive GGOs in the upper lobes. (Parenchymal destruction includes
pneumatocele, cavitation, or abscess formation.)](https://cdn.ncbi.nlm.nih.gov/pmc/blobs/96fb/9340241/33cc437f6f3f/radiol.211670.fig2.jpg)
Comment in
-
COVID-19 Pandemic: The Road to Recovery.Radiology. 2022 Aug;304(2):471-472. doi: 10.1148/radiol.220488. Epub 2022 Mar 29. Radiology. 2022. PMID: 35348383 Free PMC article. No abstract available.
References
Publication types
MeSH terms
LinkOut - more resources
Full Text Sources
Medical
Miscellaneous
