. 2022 Mar 2;63(3):26.
doi: 10.1167/iovs.63.3.26.

RNA Sequencing of Lens Capsular Epithelium Implicates Novel Pathways in Pseudoexfoliation Syndrome

Affiliations

RNA Sequencing of Lens Capsular Epithelium Implicates Novel Pathways in Pseudoexfoliation Syndrome

Sean Mullany et al. Invest Ophthalmol Vis Sci. .

Abstract

Purpose: Pseudoexfoliation syndrome (PEX) is a common systemic disease that results in severe and often irreversible vision loss. Despite considerable research effort, PEX remains incompletely understood. This study sought to perform the first RNAseq study in elucidate the pathophysiology of PEX, and contribute a publicly available transcriptomic data resource for future research.

Methods: Human ocular lens capsular epithelium samples were collected from 25 patients with PEX and 39 non-PEX controls undergoing cataract surgery. RNA extracted from these specimens was subjected to polyadenylated (mRNA) selection and deep bulk RNA sequencing. Differential expression analysis investigated protein-coding gene transcripts. Exploratory analyses used pathway analysis tools, and curated class- and disease-specific gene sets.

Results: Differential expression analysis demonstrated that 2882 genes were differentially expressed according to PEX status. Genes associated with viral gene expression pathways were among the most upregulated, alongside genes encoding ribosomal and mitochondrial respiratory transport chain proteins. Cell adhesion protein transcripts including type 4 collagen subunits were downregulated.

Conclusions: This comparative transcriptomic dataset highlights novel and previously recognized pathogenic pathways in PEX and provides the first comprehensive transcriptomic resource, adding an additional layer to build further understanding of PEX pathophysiology.


Conflict of interest statement

Disclosure: S. Mullany, None; H. Marshall, None; T. Zhou, None; D. Thomson, None; J.M. Schmidt, None; A. Qassim, None; L.S.W. Knight, None; G. Hollitt, None; E.C. Berry, None; T. Nguyen, None; M.-S. To, None; D. Dimasi, None; A. Kuot, None; J. Dubowsky, None; R. Fogarty, None; M. Sun, None; L. Chehade, None; S. Kuruvilla, None; D. Supramaniam, None; J. Breen, None; S. Sharma, None; J. Landers, None; S. Lake, None; R.A. Mills, None; M.M. Hassall, None; W.O. Chan, None; S. Klebe, None; E. Souzeau, None; O.M. Siggs, None; J.E. Craig, None

Figures

Figure 1.
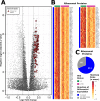
Figure 1.
Differential gene expression profile. Genes differentially expressed in a PEX versus non-PEX comparison (PEX: n = 25; non-PEX: n = 38) are represented on a volcano plot (A), with DEGs defined by an adjusted P value of less than 0.05 (horizontal dashed line), and log2 fold expression change of ± log2(1.2) (vertical dashed lines). Upregulated and downregulated genes are indicated by blue and red dots, respectively. A corresponding heatmap demonstrates the 20 most significantly upregulated and downregulated genes (B). An UpSet plot demonstrates the absolute number of upregulated and downregulated genes in separate comparisons based on PEX status (i.e., PEX versus non-PEX) and glaucoma status (i.e., glaucoma vs. non-glaucoma) in the same cohort (C). A total of 2882 genes were differentially expressed according to PEX status. Four genes were differentially expressed according to glaucoma, only one of which was uniquely differentially expressed in this comparison.
Figure 2.
Figure 2.
Pathways analysis. Enriched GO terms and KEGG pathways in PEX syndrome cases versus non-pseudoexfoliation controls (PEX: n = 25; non-PEX: n = 38). Positive and negative normalized enrichment scores indicate upregulated and downregulated pathways, respectively. GO terms are subclassified into Biological Processes, Cellular Components, and Molecular Function. Normalized enrichment scores quantify the directional enrichment value of a specific pathway while accounting for gene set size in the context of the expression dataset. Pathways are primarily ranked by adjusted P value, and secondarily ranked by the normalized enrichment score in pathways with identical adjusted P values. Point size represents the absolute number of genes from a pathway that were expressed differentially in the current study. Point color represents the adjusted P value attributed to the gene set enrichment of the relevant pathway. Specific pathways investigated further are indicated within red boxes.
Figure 3.
Figure 3.
Positively enriched GO biological processes. DEGs from the most positively enriched “GO: Biological Processes” gene set annotations are represented on a volcano plot (A) and heatmaps (B). *DEGs that were common to the 3 gene sets are represented separately on a heatmap titled Shared Annotation. Pie charts demonstrate the proportions of genes with measurable transcripts from each of these pathways which were upregulated (blue), downregulated (red), or not differentially expressed (grey).
Figure 4.
Figure 4.
Negatively enriched GO biological processes. DEGs from the most negatively enriched ‘GO: Biological Processes’ gene set annotations are represented on this volcano plot (A) and heatmaps (B). DEGs which were common to the 3 gene sets are represented separately on a heatmap titled Shared Annotation*. Pie charts demonstrate the proportions of genes with measurable transcripts from each of these pathways, which were upregulated (blue), downregulated (red), or not differentially expressed (gray).
Figure 5.
Figure 5.
Enriched KEGG disease pathway genes. After ribosome and oxidative phosphorylation, the 3 most positively enriched KEGG pathways were the disease annotated pathways Parkinson's disease, Alzheimer's disease, and Huntington's disease. DEGs from these 3 gene sets are represented on this volcano plot (A) and heatmaps (B). *DEGs that were common to the 3 gene sets are represented separately on a heatmap entitled Shared Annotation. Pie charts demonstrate the proportions of genes with measurable transcripts from each of these pathways that were upregulated (blue), downregulated (red), or not differentially expressed (gray).
Figure 6.
Figure 6.
Ribosomal genes. Ribosomal genes which were differentially expressed in PEX cases vs. non-PEX controls (PEX: n = 25; non-PEX: n = 38) are represented in a volcano plot (A). DEGs defined by a log2 fold change of ±log2(1.2) (vertical dashed lines) and an adjusted P value of less than 0.05 (horizontal dashed line) are represented by colored points. Corresponding heatmaps demonstrate normalized individual expression (z-scores) of the same genes from the ribosomal genes set (B). Pie charts demonstrate the absolute number and proportions of genes according to their differential expression characteristics (C); blue, upregulated; red, downregulated; gray, no differential expression.
Figure 7.
Figure 7.
Chromosomal and mitochondrial genes involved in the mitochondrial respiratory chain complex. Genes involved in the mitochondrial respiratory chain complex which were differentially expressed in PEX cases versus non-PEX controls are represented in a volcano plot (A). DEGs defined by a log2-fold change of ±log2(1.2) (vertical dashed lines) and an adjusted P value of less than 0.05 (horizontal dashed line) are represented by colored points. Mitochondrial protein coding genes encoded by the mitochondrial genome (representing a subgroup of these genes) are represented by square points. Corresponding heatmaps demonstrate normalized individual expression (z-scores) of the same genes from the mitochondrial respiratory chain complex genes set (excluding mitochondrial protein coding genes) and the mitochondrial genomic protein coding genes set, respectively (B). Pie charts demonstrate the absolute number and proportions of genes from both gene sets according to their differential expression characteristics (C); blue, upregulated; red, downregulated; gray, no differential expression.
Figure 8.
Figure 8.
Lens capsule histology and electron microscopy. Hematoxylin and eosin staining of the lens capsule at 60× magnification demonstrates a single layer epithelium adherent to a basement membrane in a normal (non-PEX) specimen (A) and a PEX specimen in which epithelial cells are loosely adherent to the basement membrane (B). Nuclei within the PEX specimen demonstrate chromatin condensation and reactive-type nuclear atypia. Electron microscopy demonstrates characteristic cuboidal epithelial cellular architecture in the non-PEX lens capsular epithelium. A PEX lens capsular epithelium sample by contrast, demonstrates wrinkling of the cellular membrane, an atypical reactive-type nucleus, and dilatation of the endoplasmic reticulum (diagonal arrows; D). In comparison with morphologically normal mitochondria (horizontal arrows) in the non-PEX capsular epithelium (E), mitochondria in the PEX capsular epithelium (F) are enlarged and more abundant.

References

    1. Ritch R, Schlötzer-Schrehardt U. Exfoliation syndrome. Surv Ophthalmol. 2001; 45(4): 265–315, doi:10.1016/s0039-6257(00)00196-x. - DOI - PubMed
    1. Schlötzer-Schrehardt U, Naumann GOH.. Ocular and systemic pseudoexfoliation syndrome. Am J Ophthalmol. 2006; 141(5): 921–937. - PubMed
    1. Ringvold A. Epidemiology of the pseudo-exfoliation syndrome. Acta Ophthalmol Scand. 1999; 77(4): 371–375. - PubMed
    1. Conway RM, Max Conway R, Schlotzer-Schrehardt U, Kuchle M, Naumann GOH. Pseudoexfoliation syndrome: pathological manifestations of relevance to intraocular surgery. Clin Exp Ophthalmol. 2004; 32(2): 199–210, doi:10.1111/j.1442-9071.2004.00806.x. - DOI - PubMed
    1. Puska P, Tarkkanen A.. Exfoliation syndrome as a risk factor for cataract development: five-year follow-up of lens opacities in exfoliation syndrome. J Cataract Refract Surg. 2001; 27(12): 1992–1998. - PubMed

Publication types