. 2022 Jun 2;12(6):1580-1597.
doi: 10.1158/2159-8290.CD-20-1484.

Identification of Functional Heterogeneity of Carcinoma-Associated Fibroblasts with Distinct IL6-Mediated Therapy Resistance in Pancreatic Cancer

Affiliations

Identification of Functional Heterogeneity of Carcinoma-Associated Fibroblasts with Distinct IL6-Mediated Therapy Resistance in Pancreatic Cancer

Kathleen M McAndrews et al. Cancer Discov. .

Abstract

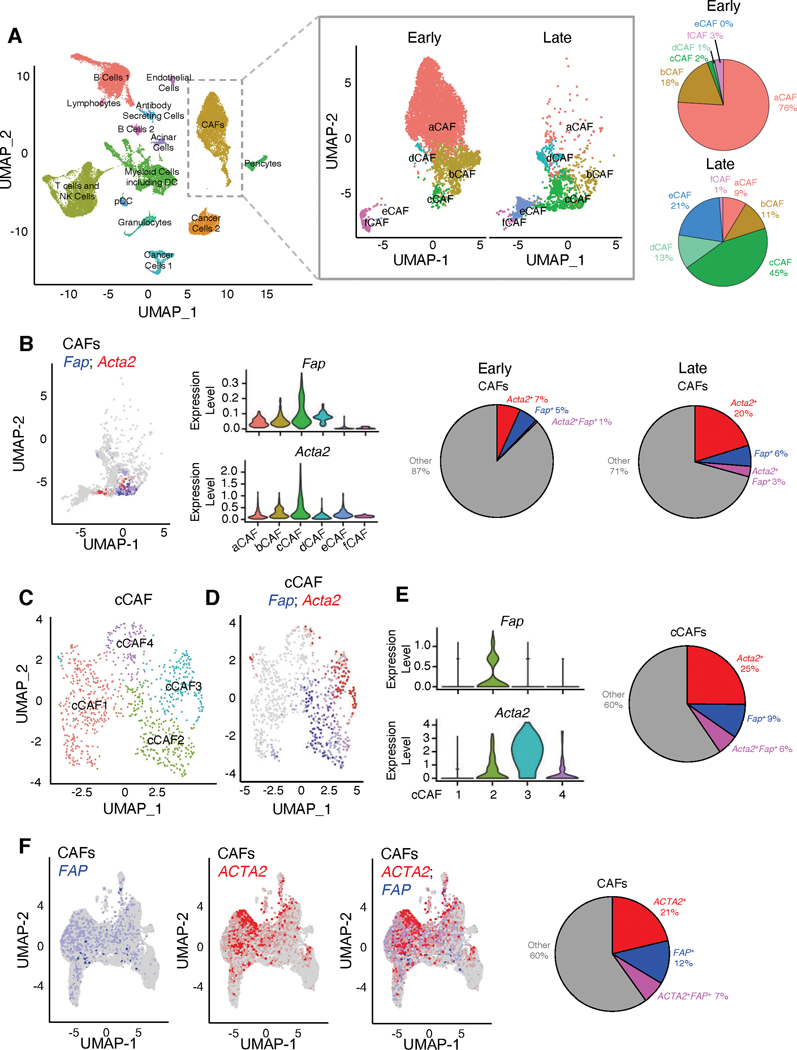
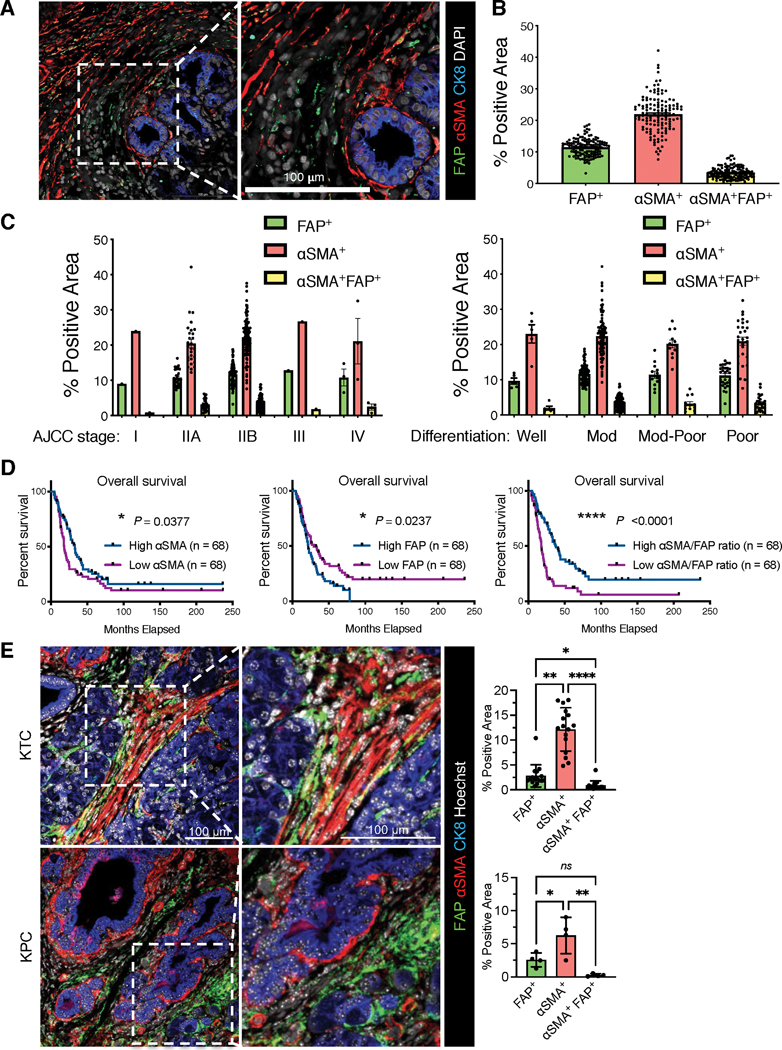
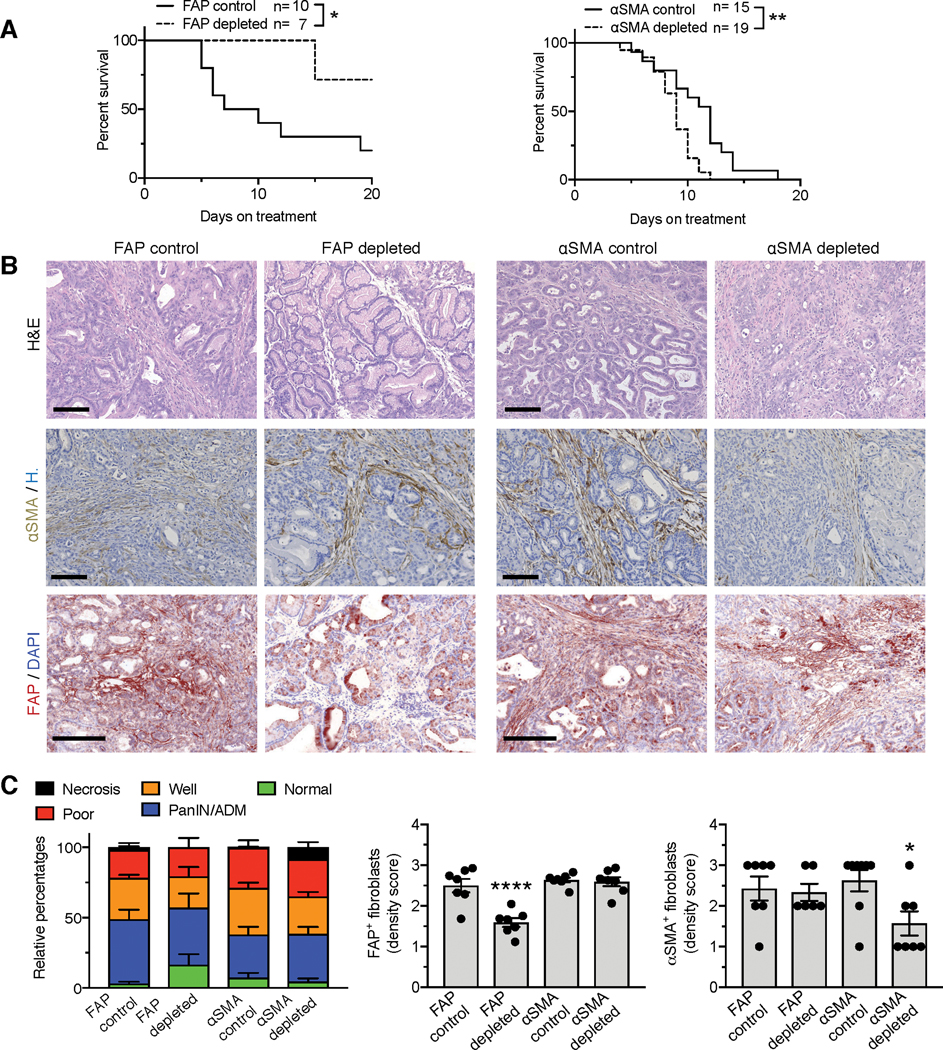
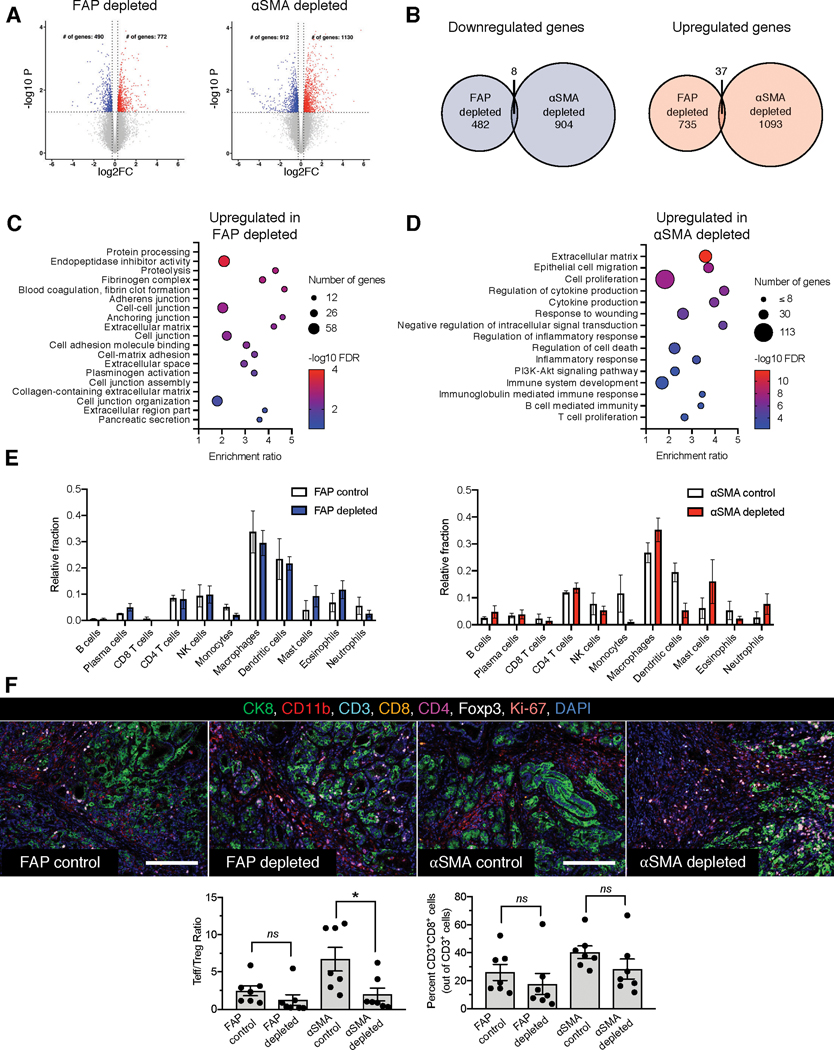
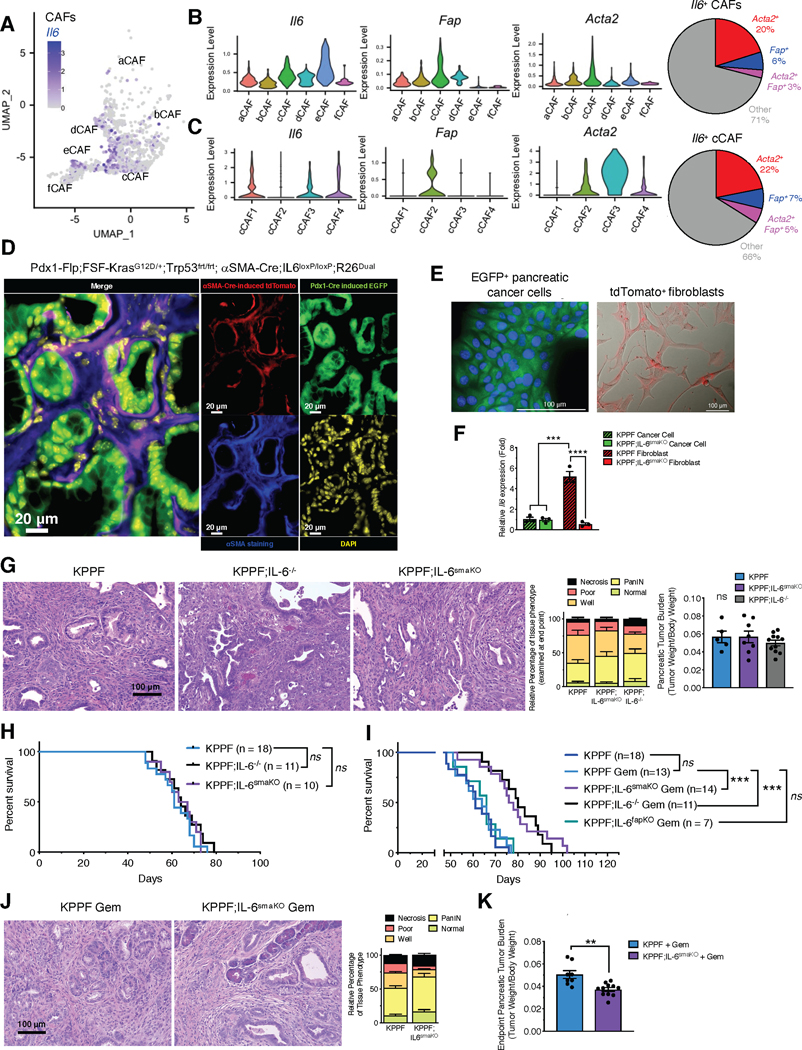
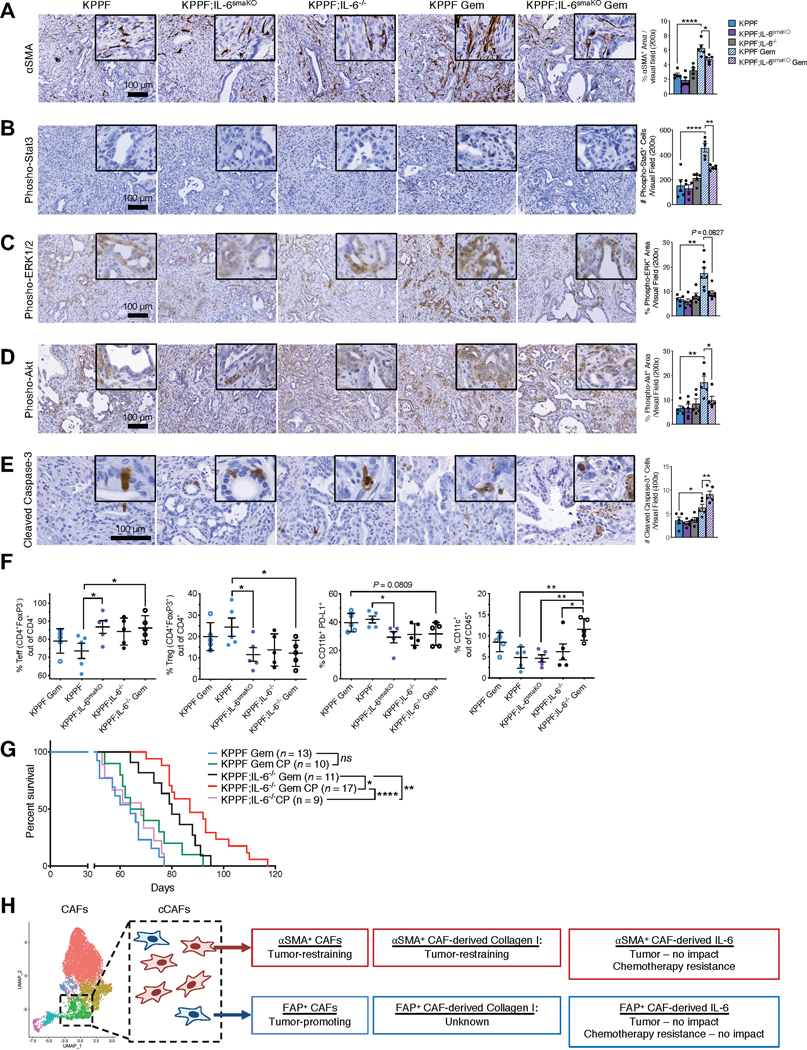
The tumor microenvironment in pancreatic ductal adenocarcinoma (PDAC) involves a significant accumulation of fibroblasts as part of the host response to cancer. Using single-cell RNA sequencing, multiplex immunostaining, and several genetic mouse models, we identify carcinoma-associated fibroblasts (CAF) with opposing functions in PDAC progression. Depletion of fibroblast activation protein (FAP)+ CAFs results in increased survival, in contrast to depletion of alpha smooth muscle actin (αSMA)+ CAFs, which leads to decreased survival. Tumor-promoting FAP+ CAFs (TP-CAF) and tumor-restraining αSMA+ CAFs (TR-CAF) differentially regulate cancer-associated pathways and accumulation of regulatory T cells. Improved efficacy of gemcitabine is observed when IL6 is deleted from αSMA+ CAFs but not from FAP+ CAFs using dual-recombinase genetic PDAC models. Improved gemcitabine efficacy due to lack of IL6 synergizes with anti-PD-1 immunotherapy to significantly improve survival of PDAC mice. Our study identifies functional heterogeneity of CAFs in PDAC progression and their different roles in therapy response.

Significance: PDAC is associated with accumulation of dense stroma consisting of fibroblasts and extracellular matrix that regulate tumor progression. Here, we identify two distinct populations of fibroblasts with opposing roles in the progression and immune landscape of PDAC. Our findings demonstrate that fibroblasts are functionally diverse with therapeutic implications. This article is highlighted in the In This Issue feature, p. 1397.


Conflict of interest statement

Conflict of interest: KMM and YC received speaker honorarium from Stellanova Therapeutics. VSL is a Scientific Advisory Board member and stockholder of Stellanova Therapeutics.

Figures

Figure 1.
Figure 1.. Distinct CAFs populations are identified by single-cell RNA-sequencing (scRNA-seq) in pancreatic tumors
(A) UMAP projection of cell populations in KPC pancreatic tumors as determined by scRNA-seq (n=8 mice; 31,861 cells; left panel). UMAP projection of the digitally selected CAF cluster in early-stage and late-stage KPC mice (early-stage, n=5 mice, 6,018 cells; late-stage, n=3 mice, 1,606 cells; center panel). Percentages of CAF subsets in early-stage and late-stage KPC mice (right panel). (B) UMAP projection (left panel) and violin plots (center panels) of Fap and Acta2 transcripts in late-stage KPC tumors (n=3 mice; 1,606 cells). Relative percentages of Fap+, Acta2+, and Acta2+Fap+ CAFs in early-stage (n=5 mice; 6,018 cells) and late-stage KPC tumors (right panel). (C) UMAP projection of subpopulations of cCAF cluster identified in (B). (D) UMAP projection (left panel) of Fap and Acta2 transcripts in cCAF cluster. (E) Violin plots of Fap and Acta2 expression levels in cCAF subsets (left panels). Relative percentages of Fap+, Acta2+, and Acta2+Fap+ cCAFs (right panel). (F) UMAP projections of FAP-expressing and ACTA2-expressing CAFs (left panel) and relative percentages of ACTA2+, FAP+, and ACTA2+FAP+ CAFs from human PDAC samples (right panel). scRNA-seq data from Peng et al. (31) was reanalyzed to overlay ACTA2-expressing and FAP-expressing CAFs. Fibroblast clusters were identified based on the expression of mesenchymal genes COL1A1, COL1A2, DCN and PDPN.
Figure 2.
Figure 2.. Distinct CAF subpopulations are identified by immunostaining in human pancreatic tumors
(A-D) Human PDAC tissue microarray (TMA) of MDACC cohort with 136 cases were examined by FAP, αSMA, and cytokeratin-8 (CK8) immunofluorescence staining. (A) Representative image of FAP, αSMA, and cytokeratin-8 stained PDAC tissue (left panel). Scale bar: 100 μm. (B) The percentage of FAP+αSMA, αSMA+FAP, and αSMA+FAP+ positive area for all cases. (C) The percentages of FAP+αSMA, αSMA+FAP, and αSMA+FAP+ positive area in the subgroups with indicated AJCC stage (left panel). The percentages of FAP+αSMA, αSMA+FAP, and αSMA+FAP+ positive area in the subgroups with indicated tumor histology identities (right panel). (D) The comparison of overall survival between patient subgroups stratified by the values of FAP level, αSMA level, or αSMA/FAP ratio. Log rank Mantel-Cox test performed. (E) The immunofluorescent staining of FAP and αSMA on pancreatic tumor tissue sections from KTC and KPC transgenic mouse models. Scale bar, 100 μm. KTC, n=16 mice; KPC, n=4 mice. Kruskall-Wallis with Dunn’s multiple comparison test performed for KTC tumors, one-way ANOVA with Tukey’s multiple comparison performed for KPC tumors. * p <0.05, ** p <0.01, **** p <0.0001, ns: not significant.
Figure 3.
Figure 3.. FAP+ CAFs and αSMA+ CAFs have opposing roles in PDAC progression
(A) Survival curves of FAP-TK KTC mice and αSMA-TK KTC mice after start of treatment with GCV or PBS. FAP control, n=10; FAP depleted, n=7; αSMA control, n=15; αSMA depleted, n=19. Log rank Mantel-Cox test performed comparing the indicated groups. (B) Representative micrographs of H&E (top panel), αSMA (middle panel) or FAP (bottom panel) immunostaining on control, FAP+ CAF-depleted, or αSMA+ CAF-depleted KTC pancreatic tumor sections. Scale bar: 100 μm. (C) Relative percentages of each tumor histological phenotype (left panel). FAP control, n=7; FAP depleted, n=7; αSMA control, n=14; αSMA depleted, n=11. Quantification of FAP (middle panel) and αSMA (right panel) density scores in indicated groups of tumors. FAP scoring: n=7 mice per group. αSMA scoring: FAP control, n=7; FAP depleted, n=6; αSMA control, n=8; αSMA depleted, n=7. One-way ANOVA with Tukey’s multiple comparisons test was performed comparing control to depleted mice. * p < 0.05, ** p < 0.01, **** p < 0.0001.
Figure 4.
Figure 4.. FAP+ and αSMA+ CAFs distinctly polarize the PDAC tumor immune microenvironment
(A-B) Differentially regulated genes in endpoint FAP+ CAF-depleted and αSMA+ CAF-depleted KTC tumors. (A) Volcano plots of downregulated and upregulated genes in FAP+ CAF-depleted and αSMA+ CAF-depleted KTC tumors. n=3 mice per group. (B) Unique and common downregulated and upregulated genes in FAP+ CAF-depleted and αSMA+ CAF-depleted KTC tumors. (C-D) GSEA pathways identified after depletion of FAP+ (C) or αSMA+ cells (D) from KTC tumors. (E) CIBERSORT analysis of abundance of immune cell subsets in FAP+ CAF-depleted and αSMA+ CAF-depleted KTC tumors. n=3 mice per group. (F) Multiplex immunohistochemical analysis of tumor immune infiltrate of endpoint FAP+ CAF-depleted and αSMA+ CAF-depleted KTC mice (top panel). Scale bar: 100μm. Quantification of Teff/Treg ratio (bottom left panel) and percent CD3+CD8+ cells (bottom right panel). n=7 mice per group. One-way ANOVA and unpaired two-tailed t-test performed comparing control to depleted mice. * p < 0.05, ns = not significant.
Figure 5.
Figure 5.. IL-6 produced by distinct CAFs populations in pancreatic cancer
(A-C) The expression profile of Il6, Fap, and Acta2 of CAF populations from late-stage KPC pancreatic tumors, presented in UMAP projection (A), violin plots (B-C, left panels), and percentages (B-C, right panels) as determined by scRNA-seq originally shown in Figure 1. (D) Representative fluorescence microscopic images of Pdx1-Flp-induced EGFP (green) expression, αSMA-Cre-induced tdTomato (red) expression, and αSMA immunofluorescence staining (blue) in the PDAC tissues of KPPF;IL-6smaKO;R26Dual mice. Scale bars, 20 μm. (E) Representative fluorescence images of FACS isolated EGFP-expressing cancer cells and tdTomato-expressing αSMA+ CAFs (depleted for IL-6) from PDAC tissues of KPPF;IL-6smaKO;R26Dual mice shown in (D). Scale bars: 100 μm. (F) qRT-PCR examination of IL-6 (Il6) in primary cancer cells and αSMA+ CAFs isolated from KPPF;IL-6smaKO;R26Dual mice (shown in E) and KPPF;αSMA-Cre;R26Dual mice (without IL-6 deletion in αSMA+ CAFs). Expression relative to Gapdh and KPPF cancer cells reported. n=3 biological replicates per group. One-way ANOVA with Sidak’s multiple comparisons test based on ΔCT values performed. (G) Representative pancreatic sections with H&E staining of KPPF, KPPF;IL-6smaKO, and KPPF;IL-6−/− mice examined at endpoint (8–11 weeks of age, left panel), relative percentage of each histological tissue phenotype (center panel), and tumor burden (right panel). Scale bar: 100 μm. Histological phenotypes: KPPF, n=14; KPPF;IL-6smaKO, n=11; KPPF;IL-6−/−, n=11. Tumor burden: KPPF, n=5; KPPF;IL-6smaKO, n=8; KPPF;IL-6−/−, n=11. Two-way ANOVA (histological phenotypes) and one-way ANOVA (tumor burden) with Tukey’s multiple comparison test performed. (H) Overall survival of KPPF (n=18), KPPF;IL-6smaKO (n=10), and KPPF;IL-6−/− (n=11) mice. Log rank Mantel-Cox test performed comparing the indicated groups. (I) Overall survival of untreated KPPF (n=18, from Figure 5H) and KPPF (n=13), KPPF;IL-6smaKO (n=14), KPPF;IL-6−/− (n=11), and KPPF;IL-6fapKO (n=7) mice treated with gemcitabine (Gem). Log rank Mantel-Cox test performed comparing the indicated groups. (J-K) Representative H&E sections of pancreatic tissues and relative percentage of each histological tissue phenotype (J), and pancreatic tumor burden (K) of gemcitabine-treated KPPF and KPPF;IL-6smaKO mice at endpoint. For (J): KPPF, n=6; KPPF;IL-6smaKO Gem, n=5. For (K): KPPF, n=8; KPPF;IL-6smaKO Gem, n=11. Scale bar: 100 μm. Two-way ANOVA with Sidak’s multiple comparison test performed for (J). Unpaired two-tailed t-test performed for (K). * p < 0.05, ** p < 0.01, *** p < 0.001, ns = not significant.
Figure 6.
Figure 6.. IL-6 produced by CAFs differentially regulates pancreatic tumor immune profile and therapeutic response
(A-E) Representative images of PDAC tissues from KPPF, KPPF;IL-6smaKO, or KPPF;IL-6−/− mice with or without gemcitabine treatment, stained with αSMA (A), phospho-Stat3 (B), phospho-ERK1/2 (C), phospho-Akt (D), and cleaved caspase-3 (E). n = 5 mice per group for (A), (B), (D), and (E). For (C), KPPF, n=5; KPPF;IL-6smaKO, n=5; KPPF;IL-6−/−, n=5; KPPF Gem, n=7; KPPF;IL-6smaKO Gem, n=7. Scale bars: 100 μm. One-way ANOVA with Sidak’s multiple comparison test performed for A-B, D-E. Kruskal-Wallis with Dunn’s multiple comparison test performed for C. (F) Percentages of CD4+FoxP3 effector T cells (Teff), CD4+FoxP3+ regulatory T cells (Treg), Teff/Treg ratio, CD11b+PD-L1+ cells, and CD11c+ cells in PDAC tissues of the indicated experimental groups (n = 5 per group, examined at 2.5-months age after saline or gemcitabine treatment for 2 weeks). One-way ANOVA with Sidak’s multiple comparison test performed. (G) Overall survival of KPPF and KPPF;IL-6−/− mice, treated with gemcitabine (Gem) and/or anti-CTLA4/anti-PD1 (CP) as either single-agent treatment or combined treatment. KPPF Gem, n=13, from Figure 5I; KPPF Gem CP, n=10; KPPF;IL-6−/− Gem, n=11, from Figure 5I; KPPF;IL-6−/− Gem CP, n=17; KPPF;IL-6−/− CP, n=9. Log rank Mantel-Cox test performed comparing the indicated groups. See Supplementary Table 1 for the complete nomenclature list of all mouse strains. (H) Schematic of the functional roles of CAF subsets and their secretome in PDAC progression and response to therapy. * p < 0.05, ** p < 0.01, **** p < 0.0001, ns: not significant.

References

    1. Chen Y, McAndrews KM, Kalluri R. Clinical and therapeutic relevance of cancer-associated fibroblasts. Nature Reviews Clinical Oncology 2021;18:792–804 doi 10.1038/s41571-021-00546-5. - DOI - PMC - PubMed
    1. LeBleu VS, Kalluri R. A peek into cancer-associated fibroblasts: origins, functions and translational impact. Dis Model Mech 2018;11(4) doi 10.1242/dmm.029447. - DOI - PMC - PubMed
    1. Kalluri R. The biology and function of fibroblasts in cancer. Nat Rev Cancer 2016;16(9):582–98 doi 10.1038/nrc.2016.73. - DOI - PubMed
    1. Hanahan D, Coussens LM. Accessories to the crime: functions of cells recruited to the tumor microenvironment. Cancer Cell 2012;21(3):309–22 doi 10.1016/j.ccr.2012.02.022. - DOI - PubMed
    1. Quail DF, Joyce JA. Microenvironmental regulation of tumor progression and metastasis. Nat Med 2013;19(11):1423–37 doi 10.1038/nm.3394. - DOI - PMC - PubMed

Publication types

MeSH terms