. 2022 Oct;22(5):1183-1198.
doi: 10.3758/s13415-022-00999-w. Epub 2022 Mar 29.

Distinct Neural Profiles of Frontoparietal Networks in Boys with ADHD and Boys with Persistent Depressive Disorder

Affiliations

Distinct Neural Profiles of Frontoparietal Networks in Boys with ADHD and Boys with Persistent Depressive Disorder

Veronika Vilgis et al. Cogn Affect Behav Neurosci. 2022 Oct.

Abstract

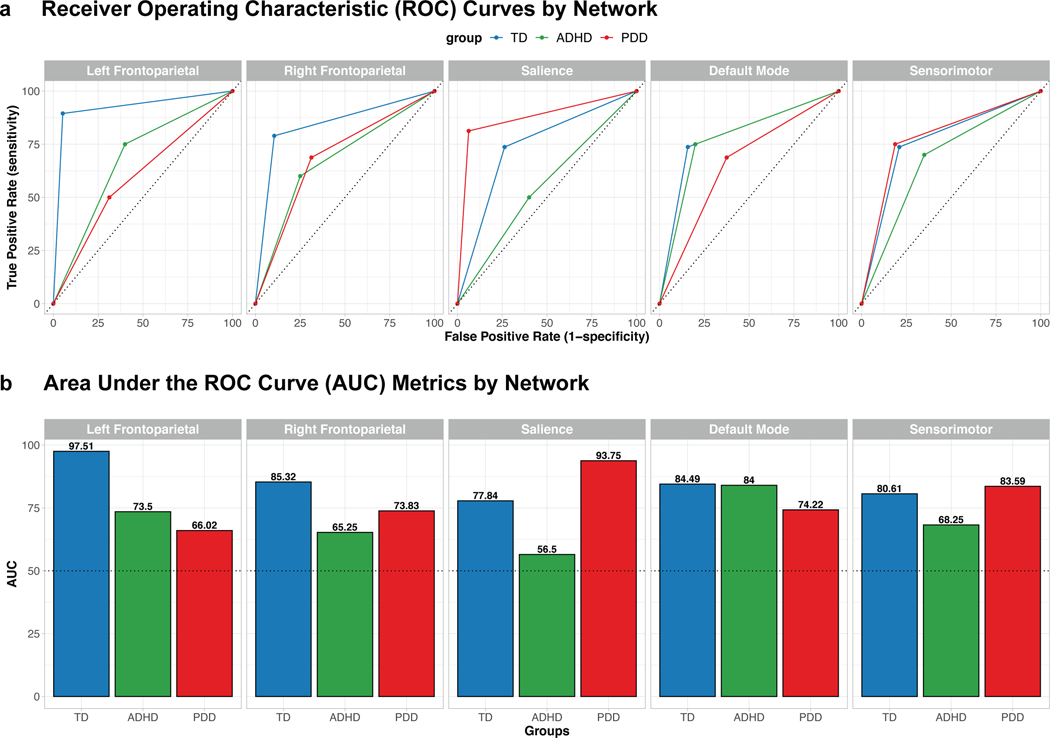
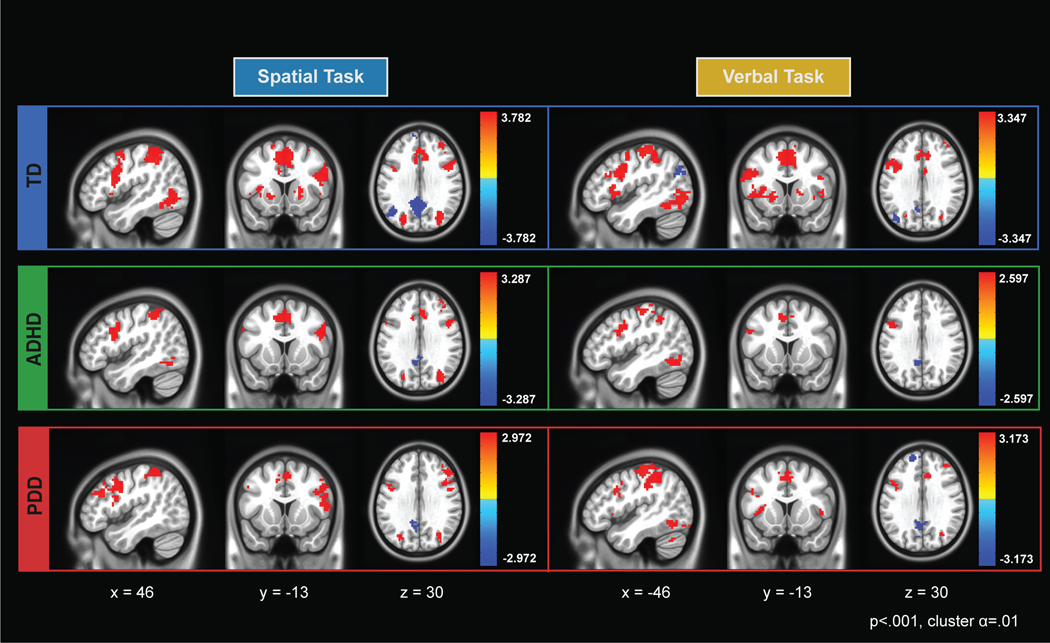
Working memory deficits are common in attention-deficit/hyperactivity disorder (ADHD) and depression-two common neurodevelopmental disorders with overlapping cognitive profiles but distinct clinical presentation. Multivariate techniques have previously been utilized to understand working memory processes in functional brain networks in healthy adults but have not yet been applied to investigate how working memory processes within the same networks differ within typical and atypical developing populations. We used multivariate pattern analysis (MVPA) to identify whether brain networks discriminated between spatial versus verbal working memory processes in ADHD and Persistent Depressive Disorder (PDD). Thirty-six male clinical participants and 19 typically developing (TD) boys participated in a fMRI scan while completing a verbal and a spatial working memory task. Within a priori functional brain networks (frontoparietal, default mode, salience), the TD group demonstrated differential response patterns to verbal and spatial working memory. The PDD group showed weaker differentiation than TD, with lower classification accuracies observed in primarily the left frontoparietal network. The neural profiles of the ADHD and PDD differed specifically in the SN where the ADHD group's neural profile suggests significantly less specificity in neural representations of spatial and verbal working memory. We highlight within-group classification as an innovative tool for understanding the neural mechanisms of how cognitive processes may deviate in clinical disorders, an important intermediary step towards improving translational psychiatry.

Keywords: Attention-deficit/hyperactivity disorder; Children; Depression; Multivariate pattern analysis; Working memory; fMRI.


Conflict of interest statement

Disclosures

Dr. Yee, Dr. Vilgis, Dr. Silk and Dr. Vance all report no biomedical financial interests or potential conflicts of interest.

Figures

Figure 1
Figure 1
a) Schematic of the Verbal Working Memory Task. Participants were cued with an array of uppercase capital letters. After 3000 ms delay, a single lowercase letter was presented for 1500 ms while participants indicated by button-press whether the probe matched the identity of the initial cues. The control condition matched the experimental condition in as many elements as possible (motor response, decision-making, visual stimuli, luminance, total trial length), except for the 3000 ms delay which was shortened to 100 ms. b) Schematic of the Spatial Working Memory Task. This task was similar to the verbal task, except the cue was a set of black dots, and participants were tasked with indicating whether the circle probe matched the location of the initial task cues. c) Multivariate Decoding of Spatial vs. Verbal Working Memory Beta Estimates. A linear support vector machine (SVM) classifier with K-fold cross validation was implemented for each network within each group, with K equal to the number of subjects in each group. The classifier was trained on beta estimates for spatial and verbal working memory from K-1 subjects and tested on the remaining subject in that group. The process was repeated for the control conditions. Permutation tests (nsim=1000) evaluated whether observed classification accuracies for each network were statistically significant above chance.
Figure 2:
Figure 2:
a) Reaction Time by Experimental and Control Condition. Participants were overall slower when performing the experimental conditions relative to the control conditions. Although RT performance was similar between verbal and spatial memory tasks, there was a slight trend towards faster RT in the verbal condition in the PDD group. For both plots, error bars indicate standard error. b) Accuracy by Experimental and Control Condition. Participants were overall less accurate when performing the experimental conditions relative to the control conditions. For each group, the accuracy did not differ between verbal and spatial memory task components.
Figure 3
Figure 3
a) Regions of Interest. Left and Right Frontoparietal Network (LFPN and RFPN) forming as the primary ROIs for working memory function, followed by the Salience Network (SN) and Default Mode Network (DMN) known to interact with the FPN. The sensorimotor network (SM) served as control ROI. b) Within-Groups Classification Accuracy of Spatial vs. Verbal Working Memory for the five selected networks. Here, the classification accuracy indicates the distinctness of spatial vs. verbal working memory task representations within each ROI. Importantly, utilization of the same ROI for each decoding facilitates clear comparison of how neural representations of working memory tasks may differ across clinical groups. High classification accuracies are observed across all networks but with group specific patterns. The TD group shows distinguishable patterns of verbal and spatial working memory processes in all networks. Classification accuracies are significantly high for the right FPN, salience and sensorimotor networks but not the left FPN or DMN in the PDD group. For the ADHD group we observed significant classification accuracies only in the DMN with a trend for the left FPN. Error bars represent 90% confidence intervals, and statistical significance is listed for one-tailed permutation tests: *p<.05; **p<.01; ***p<.001. Permutation distributions for each ROI, condition, and group are illustrated in Figure S2 in the Supplementary Material.
Figure 4
Figure 4
a) Receiver Operating Characteristic (ROC) Curves by ROI Network and Group. These empirical ROC curves reflect the combination of the linear SVM’s sensitivity (true positive rate) and specificity (false positive rate), which we combine to compute an area under the ROC curve (AUC) measure of classifier performance for the control condition. The colored lines indicate the ROC curves for TD (blue), ADHD (green), and PDD (red) groups. The black diagonal dotted line indicates chance performance. b) Area Under the ROC Curve (AUC) By ROI Network and Group. Notably, the AUC measures are highest for the TD group in both left and right Frontoparietal Networks (FPN), whereas the AUC is highest for the PDD group in the Salience Network (SN). The highest AUC measures in the Default Mode Network (DMN) are similar for both TD and ADHD groups. The black dotted line indicates chance performance.
Figure 5:
Figure 5:
Whole-brain activations for the spatial and verbal working memory experimental condition in typical development, ADHD, and PDD groups. These results revealed all groups show expected activation in key working memory related regions (e.g., left and right frontoparietal networks, salience network) and expected deactivation in default mode network for both spatial and verbal tasks. Importantly, these data show consistent activation in these networks across all groups for both spatial and verbal tasks, which markedly deviate from the neural profiles of clinical groups that were established from the MVPA decoding analyses. Significant clusters were thresholded at p<.001 and cluster corrected with a threshold of a = .01. The colors correspond to t-values, with yellow-red associated with positive values and blues associated with negative values.

Similar articles

Cited by

References

    1. Achenbach T. (1991). Manual for the Child Behavior Checklist/4–18 and 1991 profile. University of Vermont, Department of Psychiatry.
    1. Albert KM, Potter GG, Boyd BD, Kang H, & Taylor WD (2019). Brain network functional connectivity and cognitive performance in major depressive disorder. Journal of Psychiatric Research, 110, 51–56. 10.1016/j.jpsychires.2018.11.020 - DOI - PMC - PubMed
    1. Allefeld C, & Haynes J-D (2014). Searchlight-based multi-voxel pattern analysis of fMRI by cross-validated MANOVA. NeuroImage, 89, 345–357. 10.1016/j.neuroimage.2013.11.043 - DOI - PubMed
    1. American Psychiatric Association (Ed.). (2000). Diagnostic and statistical manual of mental disorders: DSM-IV-TR (4th ed., text revision). American Psychiatric Association.
    1. Arnsten AFT, & Rubia K. (2012). Neurobiological Circuits Regulating Attention, Cognitive Control, Motivation, and Emotion: Disruptions in Neurodevelopmental Psychiatric Disorders. Journal of the American Academy of Child & Adolescent Psychiatry, 51(4), 356–367. 10.1016/j.jaac.2012.01.008 - DOI - PubMed

Publication types