. 2022 Sep;38(9):992-1006.
doi: 10.1007/s12264-022-00842-9. Epub 2022 Mar 27.

Altered Retinal Dopamine Levels in a Melatonin-proficient Mouse Model of Form-deprivation Myopia

Affiliations

Altered Retinal Dopamine Levels in a Melatonin-proficient Mouse Model of Form-deprivation Myopia

Kang-Wei Qian et al. Neurosci Bull. 2022 Sep.

Abstract

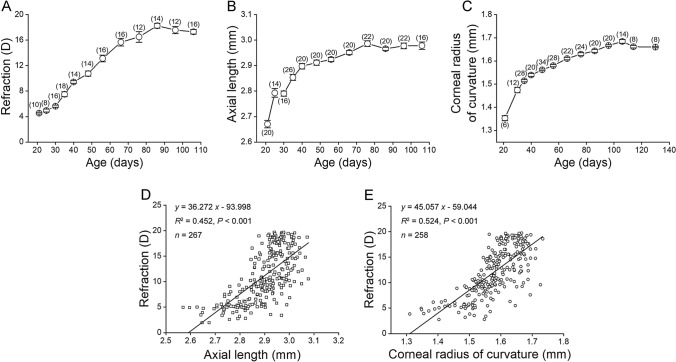
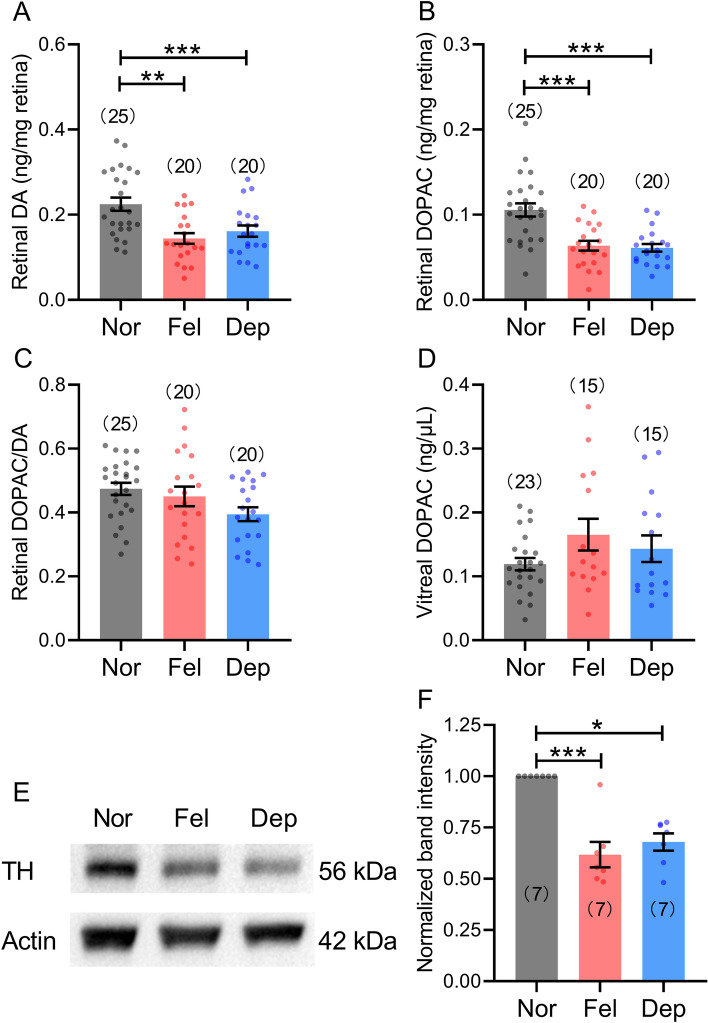
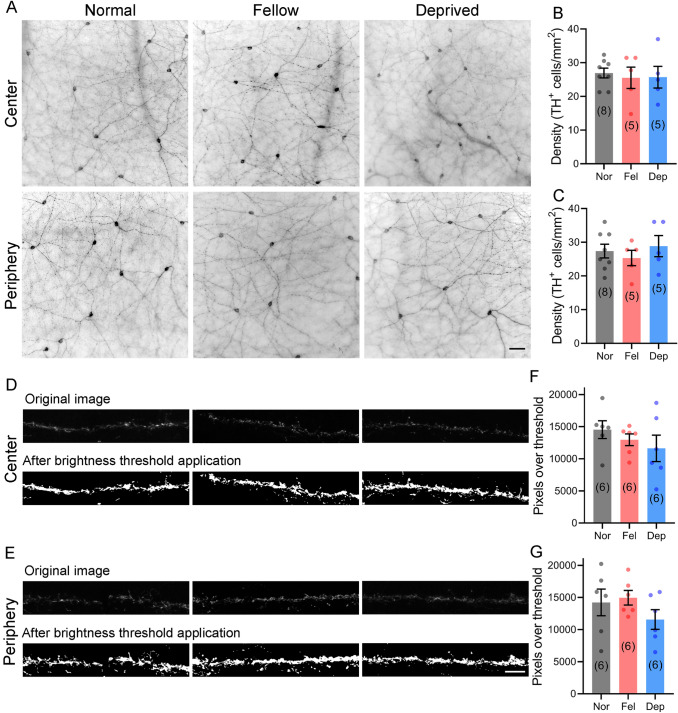
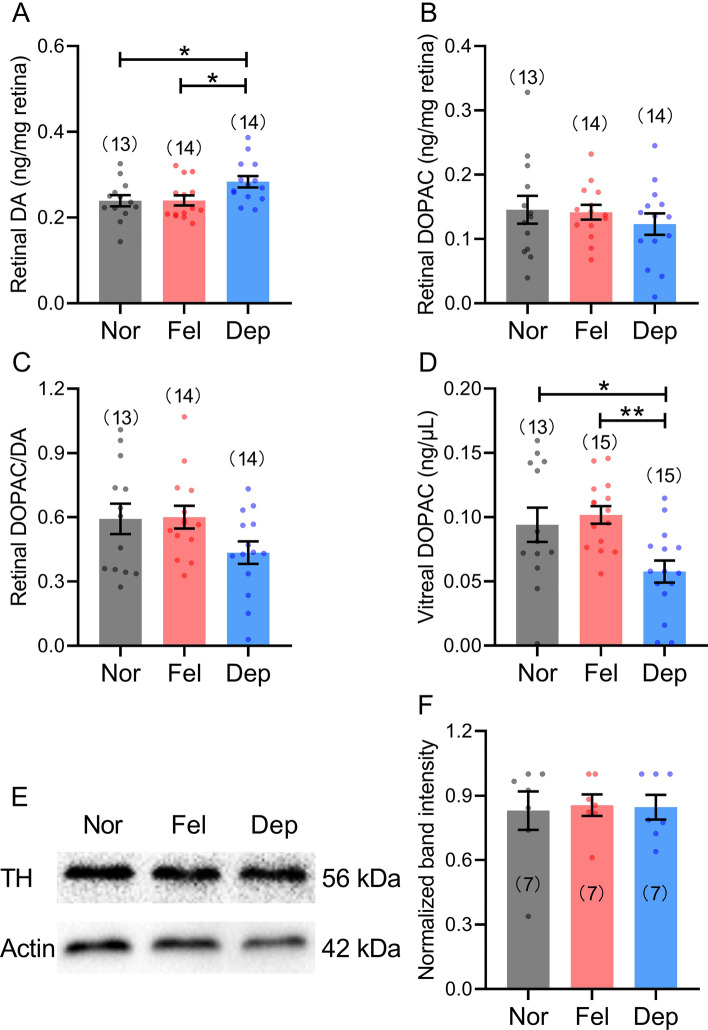
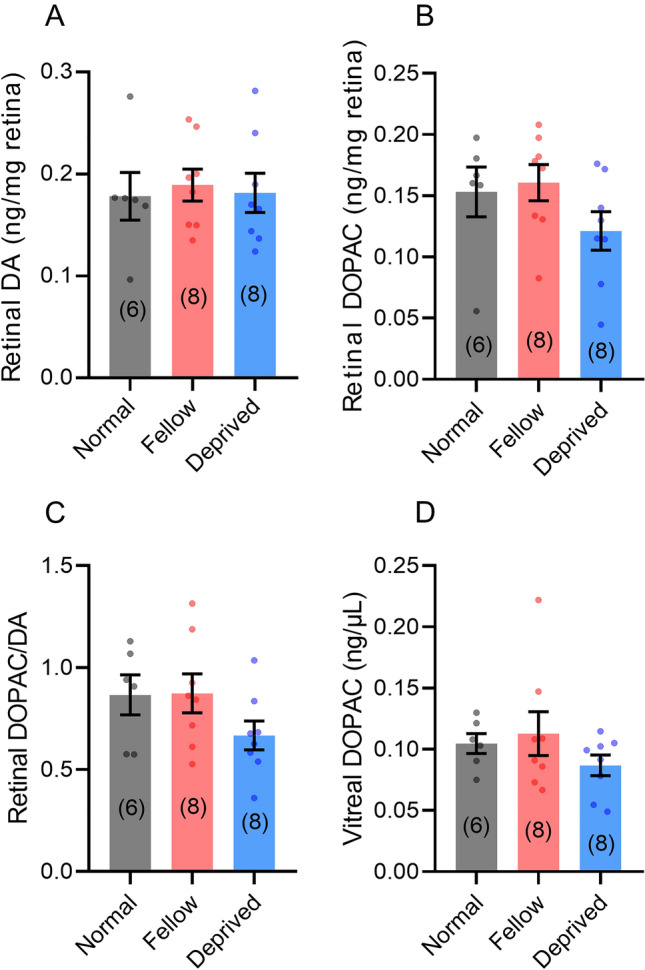
Reduced levels of retinal dopamine, a key regulator of eye development, are associated with experimental myopia in various species, but are not seen in the myopic eyes of C57BL/6 mice, which are deficient in melatonin, a neurohormone having extensive interactions with dopamine. Here, we examined the relationship between form-deprivation myopia (FDM) and retinal dopamine levels in melatonin-proficient CBA/CaJ mice. We found that these mice exhibited a myopic refractive shift in form-deprived eyes, which was accompanied by altered retinal dopamine levels. When melatonin receptors were pharmacologically blocked, FDM could still be induced, but its magnitude was reduced, and retinal dopamine levels were no longer altered in FDM animals, indicating that melatonin-related changes in retinal dopamine levels contribute to FDM. Thus, FDM is mediated by both dopamine level-independent and melatonin-related dopamine level-dependent mechanisms in CBA/CaJ mice. The previously reported unaltered retinal dopamine levels in myopic C57BL/6 mice may be attributed to melatonin deficiency.

Keywords: Dopamine; Melatonin; Mouse; Myopia; Refractive development; Retina.


Conflict of interest statement

The authors declare that they have no competing financial interests.

Figures

Fig. 1
Fig. 1
Developmental changes in refractive status and ocular dimensions in CBA/CaJ mice. AC Changes in refractive error (A, by infrared photoretinoscopy), axial length (B, by A-scan ultrasonography), and corneal radius of curvature (C, by photokeratometry) as a function of postnatal days. D, E Regression analysis showing that refraction is significantly correlated with axial length (D) and corneal radius of curvature (E). Sample sizes are given in parentheses.
Fig. 2
Fig. 2
Five-week monocular form deprivation reduces daytime retinal dopamine and TH protein levels in both eyes. A, B HPLC analysis of samples harvested at ZT1–2 reveal that retinal levels of DA (A) and DOPAC (B) are significantly reduced in deprived and fellow eyes as compared to those in normal control eyes. C, D The calculated DOPAC/DA ratios (C) and the concentrations of vitreal DOPAC (D), an indicator of retinal DA release, are similar among normal, fellow, and deprived eyes. E Representative example of TH antibody staining on a Western blot of retinal protein extracts (prepared at ZT1–2) from normal, fellow, and deprived eyes after 5 weeks of monocular form deprivation. F TH expression levels, normalized as a ratio to β-actin levels, are significantly lower in both deprived and fellow eyes as compared to those in normal eyes. *P < 0.05, **P < 0.01, ***P < 0.001; One-way ANOVA with Tukey’s multiple comparison test (A–C) or Kruskal–Wallis test with Dunn’s multiple comparison test (D and F). Sample sizes are given in parentheses. Nor, normal; Fel, fellow; Dep, deprived.
Fig. 3
Fig. 3
Five-week monocular form deprivation does not change the density of the process area of dopaminergic amacrine cells. A Representative photomicrographs of TH-immunoreactive signals captured from central and peripheral parts of retinal whole-mounts harvested from normal, fellow, and deprived eyes. B, C The average density of TH+ cells, measured in either central (B) or peripheral retinal regions (C), does not differ significantly among normal, fellow, and deprived eyes (one-way ANOVA, P > 0.05). D, E Representative images showing TH+ processes spread in the IPL of retinal cross-sections acquired using a confocal microscope (upper panels, images captured with low, non-saturating exposure intensity; lower panels, the same cross-sections, but with a brightness threshold). F, G Quantitative analysis of the areas occupied by TH+ processes, based on dozens of images as in the lower panels of D and E. There is no significant difference among the three groups, either in the central (F) or peripheral (G) retinal regions (one-way ANOVA, P > 0.05). Sample sizes are given in parentheses. Scale bars, 50 μm in A, 30 μm in E. Nor, normal; Fel, fellow; Dep, deprived.
Fig. 4
Fig. 4
Two-week form deprivation reduces daytime retinal dopamine release and increases dopamine storage in deprived eyes without changing TH protein expression. A HPLC analysis showing significantly higher retinal DA levels in deprived eyes than in fellow and normal eyes for samples collected at ZT1–2. B, C Both DOPAC levels and the DOPAC/DA ratios are comparable among the three groups. D The concentrations of vitreal DOPAC, an indicator of retinal DA release, are significantly lower in deprived cells than in normal/fellow eyes. E Representative example of TH antibody staining on a Western blot of retinal homogenates harvested at ZT1–2 from normal, fellow, and deprived eyes after 5 weeks of monocular form deprivation. F TH expression, normalized as a ratio to β-actin levels, shows no significant difference among the three groups. Sample sizes are given in parentheses. *P < 0.05, **P < 0.01; one-way ANOVA with Tukey’s multiple comparison test. Nor, normal; Fel, fellow; Dep, deprived.
Fig. 5
Fig. 5
Luzindole abolishes retinal dopamine level declines in FDM CBA/CaJ mice. AD Daytime retinal DA levels (A), DOPAC levels (B), the DOPAC/DA ratios (C), and vitreal DOPAC levels (D) in normal, fellow, and deprived eyes from 5-week form-deprived animals that were intraperitoneally injected with luzindole, a melatonin receptor antagonist, every other day. There is no significant difference in any of these levels among the three groups (one-way ANOVA for A, C and D, Kruskal–Wallis test for B). Sample sizes are given in parentheses.

References

    1. Witkovsky P. Dopamine and retinal function. Doc Ophthalmol. 2004;108:17–40. doi: 10.1023/B:DOOP.0000019487.88486.0a. - DOI - PubMed
    1. Yin N, Yang YL, Cheng S, Wang HN, Hu X, Miao YY, et al. Dopamine D2 receptor-mediated modulation of rat retinal ganglion cell excitability. Neurosci Bull. 2020;36:230–242. doi: 10.1007/s12264-019-00431-3. - DOI - PMC - PubMed
    1. Zhou XT, Pardue MT, Iuvone PM, Qu J. Dopamine signaling and myopia development: What are the key challenges. Prog Retin Eye Res. 2017;61:60–71. doi: 10.1016/j.preteyeres.2017.06.003. - DOI - PMC - PubMed
    1. Feldkaemper M, Schaeffel F. An updated view on the role of dopamine in myopia. Exp Eye Res. 2013;114:106–119. doi: 10.1016/j.exer.2013.02.007. - DOI - PubMed
    1. Guo SS, Sivak JG, Callender MG, Diehl-Jones B. retinal dopamine and lens-induced refractive errors in chicks. Curr Eye Res. 1995;14:385–389. doi: 10.3109/02713689508999936. - DOI - PubMed

LinkOut - more resources