. 2022 Mar 29;15(727):eabl5405.
doi: 10.1126/scisignal.abl5405. Epub 2022 Mar 29.

Adenosine signaling activates ATP-sensitive K+ channels in endothelial cells and pericytes in CNS capillaries

Affiliations

Adenosine signaling activates ATP-sensitive K+ channels in endothelial cells and pericytes in CNS capillaries

Maria Sancho et al. Sci Signal. .

Abstract

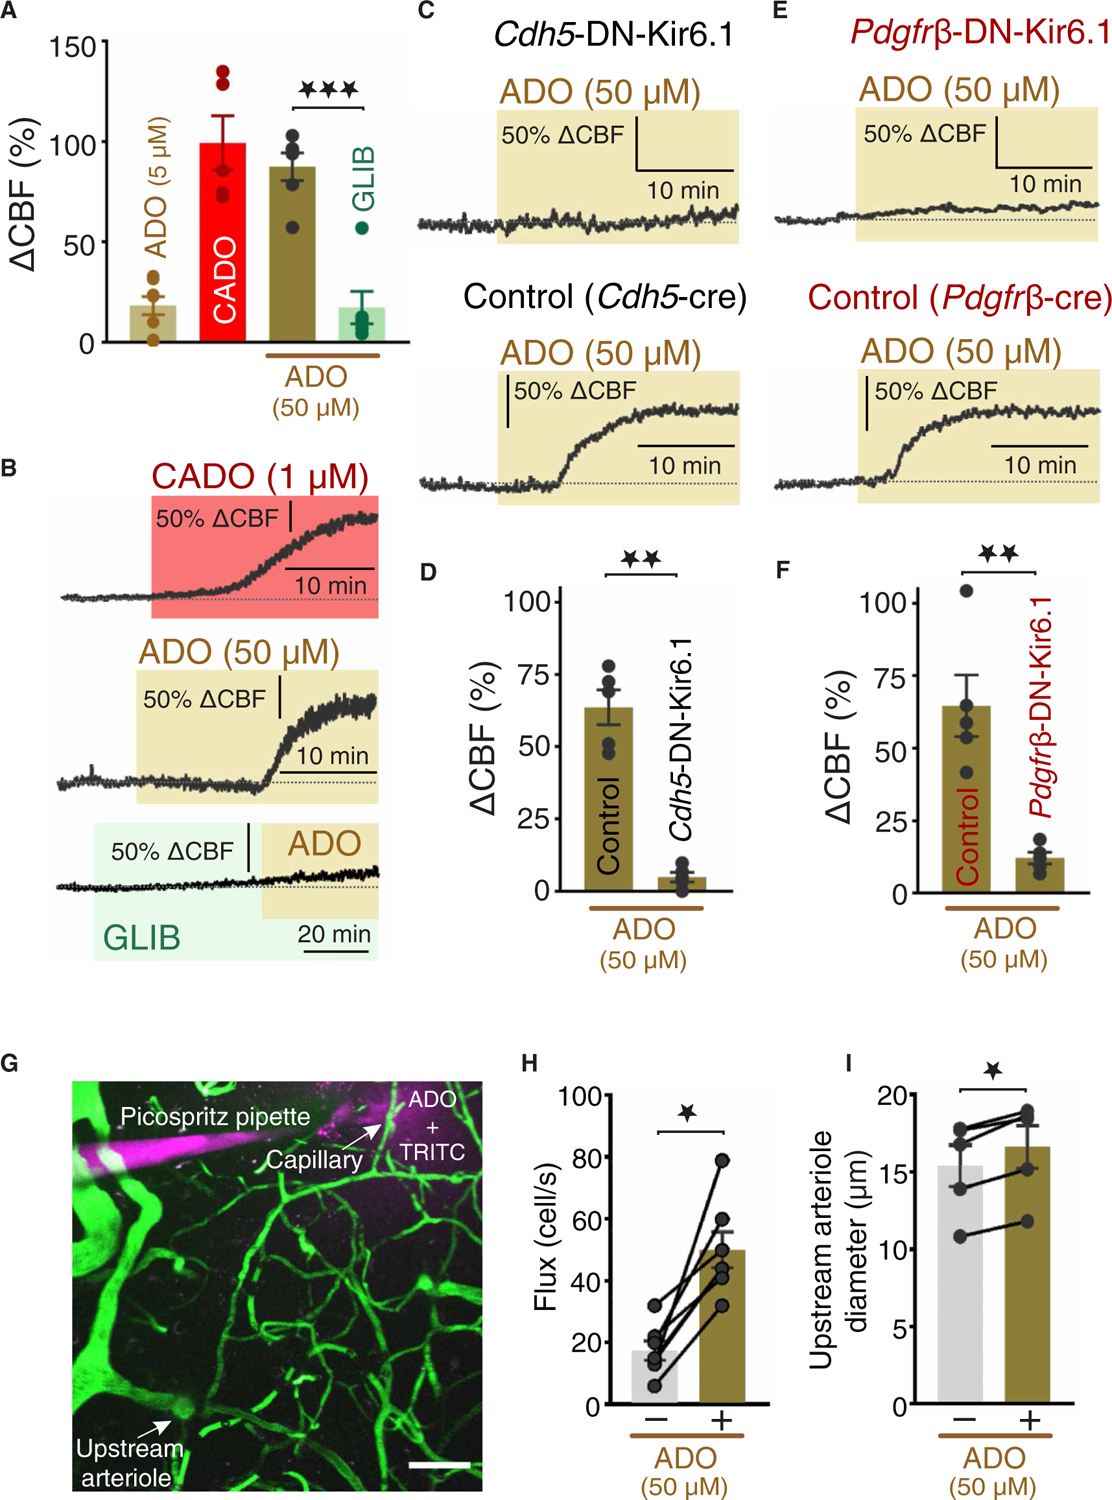
The dense network of capillaries composed of capillary endothelial cells (cECs) and pericytes lies in close proximity to all neurons, ideally positioning it to sense neuron- and glial-derived compounds that enhance regional and global cerebral perfusion. The membrane potential (VM) of vascular cells serves as the physiological bridge that translates brain activity into vascular function. In other beds, the ATP-sensitive K+ (KATP) channel regulates VM in vascular smooth muscle, which is absent in the capillary network. Here, with transgenic mice that expressed a dominant-negative mutant of the pore-forming Kir6.1 subunit specifically in brain cECs or pericytes, we demonstrated that KATP channels were present in both cell types and robustly controlled VM. We further showed that the signaling nucleotide adenosine acted through A2A receptors and the Gαs/cAMP/PKA pathway to activate capillary KATP channels. Moreover, KATP channel stimulation in vivo increased cerebral blood flow (CBF), an effect that was blunted by expression of the dominant-negative Kir6.1 mutant in either capillary cell type. These findings establish an important role for KATP channels in cECs and pericytes in the regulation of CBF.


Conflict of interest statement

Competing interests: The authors declare that they have no competing interests.

Figures

Fig. 1.
Fig. 1.. Experimental paradigm used to explore the expression of functional KATP channels in the capillary network.
(A) Schematic depiction of brain cEC and pericyte isolation for patch-clamp analysis. A small piece of brain somatosensory cortex was mechanically disrupted and filtered to yield capillary segments. Single capillary cells were released after enzymatic digestion and trituration. Because NG2-DsRed-BAC transgenic mice were used, pericytes were identified by DsRed fluorescence. Electrophysiological profiles of cECs and pericytes (black and red traces, respectively). (B) Illustration of the intact pressurized retina preparation (50 mmHg at the level of the ophthalmic artery) and measurement of VM in situ using sharp microelectrodes. The ophthalmic artery of an isolated mouse retina was cannulated, and the retina tissue was pinned down en face, allowing visualization of the entire superficial microvasculature and facilitating the impalement of a cell of interest (cEC or pericyte; inset). The phenotype of the impaled cell was confirmed by including iFluor 488–conjugated hydrazide in the sharp glass electrode. (C) CBF responses and blood pressure were monitored in the somatosensory cortex through a cranial window using laser Doppler flowmetry (LDF). (D) RBC flux and upstream parenchymal arteriole diameter were quantified in vivo using two-photon laser scanning microscopy (2PLSM). Scale bars, 10 μm.
Fig. 2.
Fig. 2.. Brain cECs and pericytes express functional KATP channels.
(A) Schematic diagram illustrating KATP channel stimulation by the synthetic opener pinacidil (PIN) and inhibition by the sulfonylurea glibenclamide (GLIB). (B and C) Representative traces showing GLIB (10 μM)–sensitive currents induced by PIN (10 μM) from a holding potential of −70 mV in freshly isolated cECs (B) (n = 9 cells per group) or pericytes (C) (n = 7 cells per group), recorded in the whole-cell configuration and dialyzed with 0.1 mM ATP/0.1 mM ADP. (D and E) Currents in cECs (black trace) and pericytes (red trace) recorded in the whole-cell configuration dialyzed with 3 mM ATP/0.1 mM ADP (n = 8 cECs or pericytes per group) (D) or in the perforated (cytoplasm intact) patch-clamp configuration (cECs, n = 8 cells per group; pericytes, n = 4 cells per group) (E). (F) Summary data showing PIN-induced current density in cECs and pericytes dialyzed with different ATP concentrations or recorded in the perforated patch configuration. Values are presented as means ± SEM (P < 0.05; ★★P < 0.01; ★★★P < 0.001; Kruskal-Wallis test with post hoc Dunn’s test). (G and H) GLIB-sensitive currents in cECs (G) and pericytes (H) from Cdh5-DN-Kir6.1 and Pdgfrβ-DN-Kir6.1 mice, respectively (top), and from the corresponding Chd5-cre and Pdgfrβ-cre control mice (bottom), recorded in the whole-cell configuration and dialyzed with 0.1 mM ATP. BaCl2 (100 μM) was added at the end of experiments that used cells derived from Cdh5-DN-Kir6.1 and Pdgfrβ-DN-Kir6.1 mice (Cdh5-DN-Kir6.1, n = 8 cells; Chd5-cre, n = 7 cells; Pdgfrβ-DN-Kir6.1, n = 6 cells; Pdgfrβ-cre, n = 6 cells). (I) Summary data comparing PIN-induced current density in cECs and pericytes isolated from Cdh5-DN-Kir6.1 and Pdgfrβ-DN-Kir6.1 to that in the corresponding cell type from Cdh5-cre and Pdgfrβ-cre control mice. Values are presented as means ± SEM (★★P < 0.01; ★★★P < 0.001; Mann-Whitney test). Dotted lines in (B) to (E), (G), and (H) represent zero current level. For all conditions, external and internal K+ were 60 and 140 mM, respectively.
Fig. 3.
Fig. 3.. Activation of KATP channels causes membrane potential hyperpolarization.
(A) Representative wide-field image of the whole-mount en face pressurized retina preparation used for VM measurements. Rhodamine-isolectin was used to label the entire superficial microvasculature. (B and C) Higher-magnification images of the yellow inset in (A), depicting the vascular network stained with rhodamine-isolectin (B) and the impaled cell of interest (pericyte) filled with iFluor 488 hydrazide (C). (D) Stitched confocal z-stack image magnified from the yellow inset depicted in (A) and (B). (E) Confocal z-stack of the fill of a pericyte with iFluor 488 hydrazide with a sharp microelectrode. (F) Stitched z projection of spinning disk confocal images illustrating an impaled capillary pericyte in which fluorescent hydrazide labeling remained exclusively in the cell body and processes of the impaled cell. (G) Stitched confocal z-stack image of the microvascular network, labeled with rhodamine-isolectin. (H) Impaled cell of interest (cEC) filled with iFluor 488 hydrazide. (I) In impaled cECs, iFluor 488–conjugated hydrazide diffused to coupled adjacent cells, staining mainly cell bodies. Retinal tissue was stained with rhodamine-isolectin at the end of VM measurements. Scale bars, 1 mm (A), 100 μm (B and C), and 20 μm (D to I). (J and K) Representative VM recordings and summary data from cECs (J) (n = 3 to 10 cells per group) and pericytes (K) (n = 3 to 13 cells per group) in the pressurized (50 mmHg at the level of the ophthalmic artery) retina vasculature illustrating the robust hyperpolarization induced by pinacidil (PIN; 10 μM) and subsequent block by glibenclamide (GLIB; 20 μM). Data are presented as means ± SEM (P < 0.05; ★★P < 0.01; Kruskal-Wallis test with post hoc Dunn’s test). Dashed line represents 0-mV baseline before impalement of the cell.
Fig. 4.
Fig. 4.. Adenosine evokes KATP currents in cECs and pericytes through the A2AR and PKA signaling pathway.
(A) Schematic diagram illustrating how A2AR signaling through the Gαs-AC-PKA intracellular pathway activates KATP channels. The A2AR and PKA agonists or antagonists used are indicated. (B) Representative recordings showing the effects of adenosine (ADO; 25 μM) on glibenclamide (GLIB; 10 μM)–sensitive currents from native cECs (n = 7 cells) and pericytes (n = 7 cells). (C) Effects of the metabolically stable adenosine analog 2-chloroadenosine (CADO; 5 μM) on GLIB-sensitive currents in cECs (n = 9 cells) and pericytes (n = 6 cells per group). (D) Effects of the adenosine A2 receptor agonist CGS-21680 (CGS; 500 nM) on GLIB-sensitive currents evoked by in cECs (n = 8 cells) and pericytes (n = 7 cells). (E) Summary data showing the averaged GLIB-sensitive current density induced by ADO (25 μM), CADO (5 μM), and CGS-21680 (500 nM) in cECs and pericytes. (F) Original traces and summary data showing the effects of adenosine (25 μM) and pinacidil (PIN; 10 μM) in cECs (n = 8 cells; top) and pericytes (n = 8 cells; bottom) treated with the A2AR blocker ZM-241385 (30 nM). (G) Effects of the PKA inhibitor H-89 (1 μM) or PIN on GLIB-sensitive KATP currents induced by ADO or CSG-21680 in cECs (n = 7 cells) and pericytes (n = 7 cells). External K+ was 60 mM, and cells were dialyzed with 0.1 mM ATP, 0.1 mM ADP, and 140 mM K+. Membrane current was recorded at a VM of −70 mV. Dotted line represents zero current level. Data are presented as means ± SEM (P < 0.05; ★★P < 0.01; ★★★P < 0.001; Kruskal-Wallis test with post hoc Dunn’s test).
Fig. 5.
Fig. 5.. A2AR stimulation hyperpolarizes the membrane potential of capillary cECs and pericytes through KATP channels.
(A and B) Original VM recordings (left) and summary data (right) from cECs (A) (n = 3 to 7 cells per group) and pericytes (B) (n = 3 to 8 cells per group) in pressurized (50 mmHg at the level of the ophthalmic artery) retinal vasculature showing changes in VM induced by adenosine (ADO; 500 nM to 25 μM) or CADO (1 μM) superfused in the absence or presence of glibenclamide (GLIB; 20 μM). Note that ADO was washed off (~15 to 20 min) before CADO was superfused. Dashed line represents 0-mV baseline before impalement of the cell. Summary data illustrate the effects of ADO, CADO, and GLIB on the VM of cECs and pericytes. Data are presented as means ± SEM (P < 0.05; ★★P < 0.01; Kruskal-Wallis test and Wilcoxon matched-pairs signed-rank test).
Fig. 6.
Fig. 6.. Activation of KATP channels increases CBF.
CBF responses in the somatosensory cortex were continuously monitored through a cranial window using laser Doppler flowmetry. (A and B) Summary data (A) and original traces (B) illustrating changes in CBF induced by a low concentration of adenosine (ADO; 5 μM) or CADO (1 μM) or a higher concentration of ADO (50 μM) superfused in the absence or presence of glibenclamide (GLIB; 20 μM; n = 5 to 8 mice per group). (C and D) Original traces (C) and summary data (B) showing CBF responses induced by superfusion of ADO (50 μM) in Cdh5-cre control mice (n = 5 mice per group). (E and F) Original traces (E) and summary data (F) showing changes in CBF induced by superfusion of ADO in Pdgfrβ-DN-Kir6.1 and control (Pdgfrβ-cre) mice (n = 5 mice per group). (G) A pipette containing ADO (50 μM) plus TRITC-dextran in aCSF was placed next to a capillary, which was further line-scanned at 5 kHz during local pressure ejection of the pipette contents. (H and I) Summary data showing RBC flux responses (H) (n = 7 capillaries from three mice) and changes in arteriole diameter (I) (n = 5 capillaries from three mice) before and after ADO application. Data in (D), (F), (H), and (I) are presented as means ± SEM [P < 0.05; ★★P < 0.01; (D) and (F), Mann-Whitney test; and (H) and (I), Wilcoxon matched-pairs signed-rank test].
Fig. 7.
Fig. 7.. KATP channels in capillaries and their impact on CBF.
(A) During normal brain activity or under pathophysiological conditions (hypoxia and ischemia), neurons and/or astrocytes release adenosine. (B) Adenosine, in turn, stimulates KATP channel activity through A2ARs and the Gαs-AC-PKA signaling pathway. (C) Activation of KATP channels causes profound hyperpolarization of cEC and pericyte membranes and (D) enhances CBF.

Comment in

References

    1. Gould IG, Tsai P, Kleinfeld D, Linninger A, The capillary bed offers the largest hemodynamic resistance to the cortical blood supply. J. Cereb. Blood Flow Metab 37, 52–68 (2017). - PMC - PubMed
    1. Longden TA, Dabertrand F, Koide M, Gonzales AL, Tykocki NR, Brayden JE, Hill-Eubanks D, Nelson MT, Capillary K+-sensing initiates retrograde hyperpolarization to increase local cerebral blood flow. Nat. Neurosci 20, 717–726 (2017). - PMC - PubMed
    1. Dunwiddie TV, Diao L, Proctor WR, Adenine nucleotides undergo rapid, quantitative conversion to adenosine in the extracellular space in rat hippocampus. J. Neurosci 17, 7673–7682 (1997). - PMC - PubMed
    1. Zhang JM, Wang HK, Ye CQ, Ge W, Chen Y, Jiang ZL, Wu CP, Poo MM, Duan S, ATP released by astrocytes mediates glutamatergic activity-dependent heterosynaptic suppression. Neuron 40, 971–982 (2003). - PubMed
    1. Park KH, Rubin LE, Gross SS, Levi R, Nitric oxide is a mediator of hypoxic coronary vasodilatation. Relation to adenosine and cyclooxygenase-derived metabolites. Circ. Res 71, 992–1001 (1992). - PubMed

Publication types

LinkOut - more resources