. 2022 May 16;132(10):e152308.
doi: 10.1172/JCI152308.

Cardiac pericyte reprogramming by MEK inhibition promotes arteriologenesis and angiogenesis of the ischemic heart

Affiliations

Cardiac pericyte reprogramming by MEK inhibition promotes arteriologenesis and angiogenesis of the ischemic heart

Elisa Avolio et al. J Clin Invest. .

Abstract

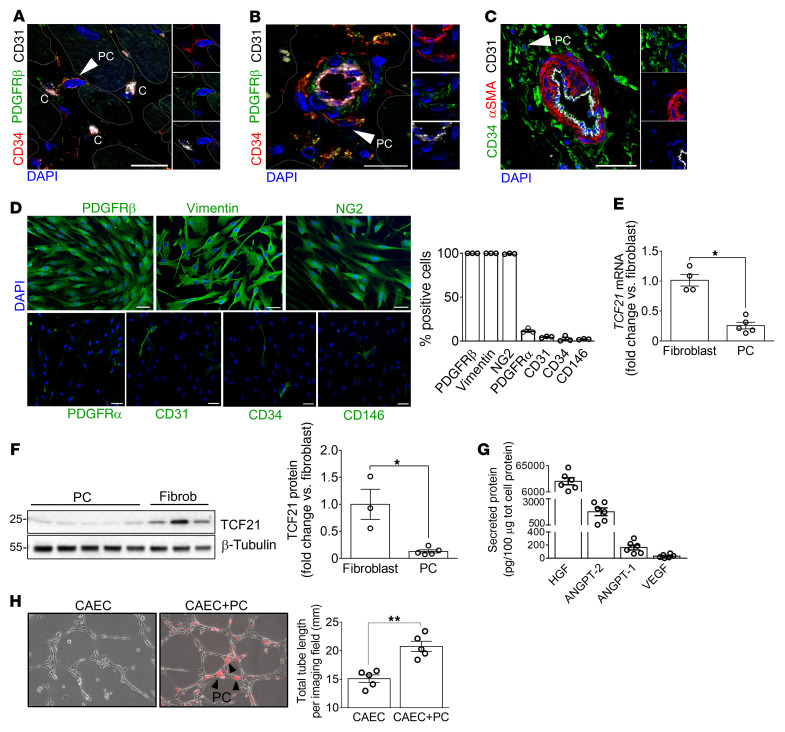
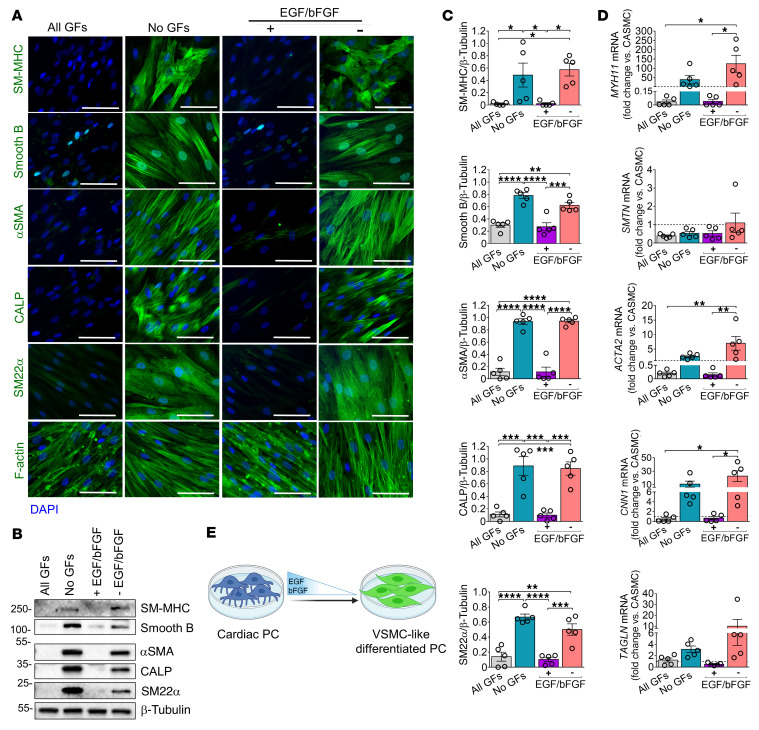
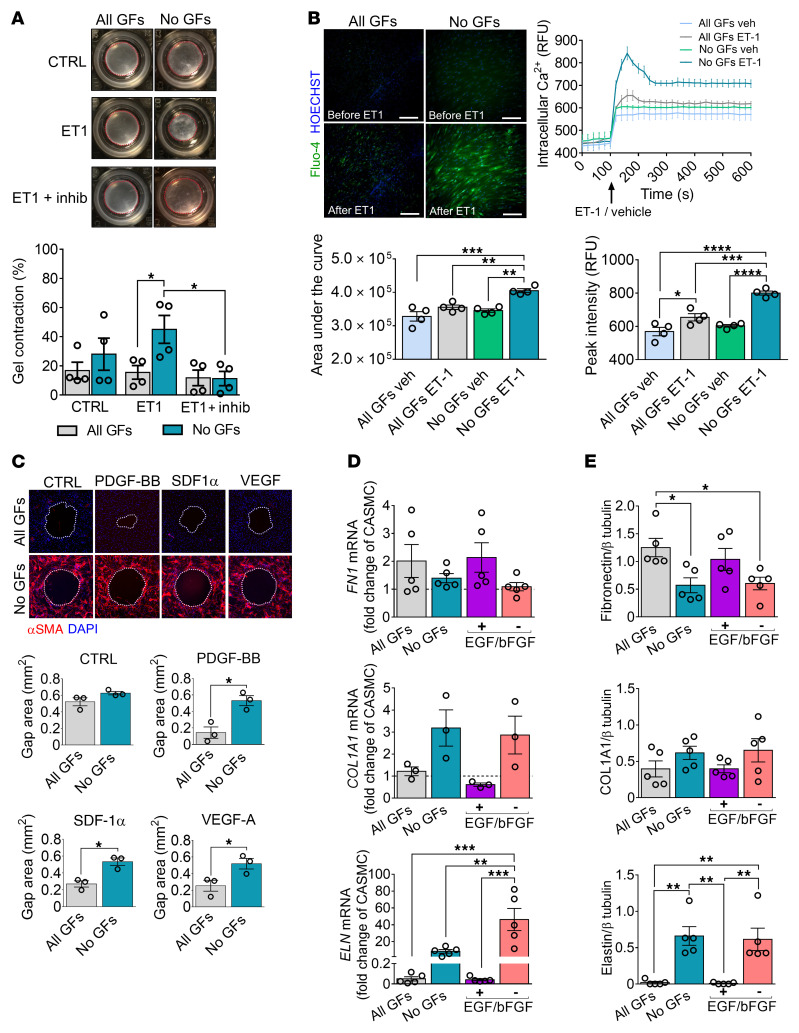
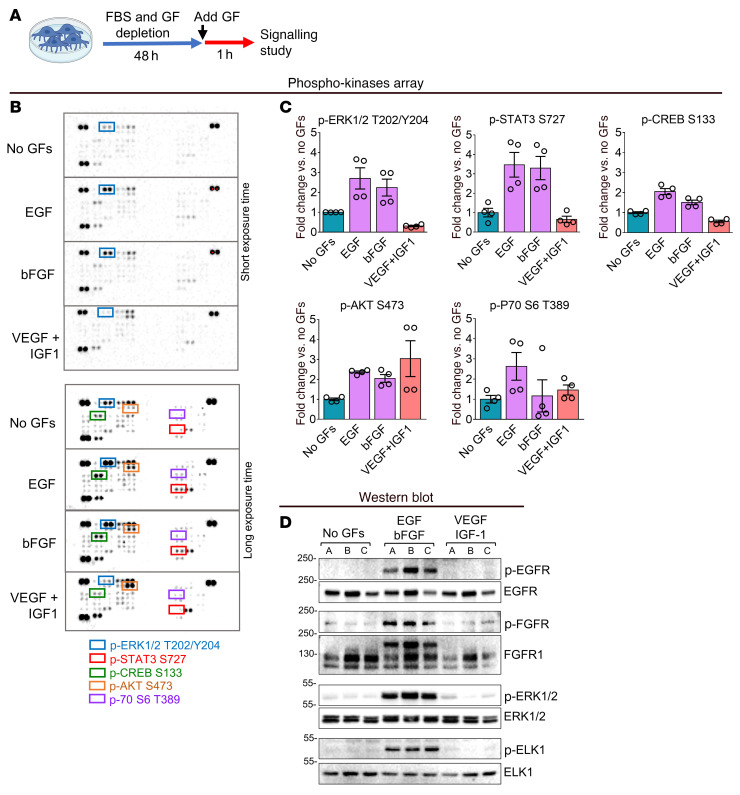
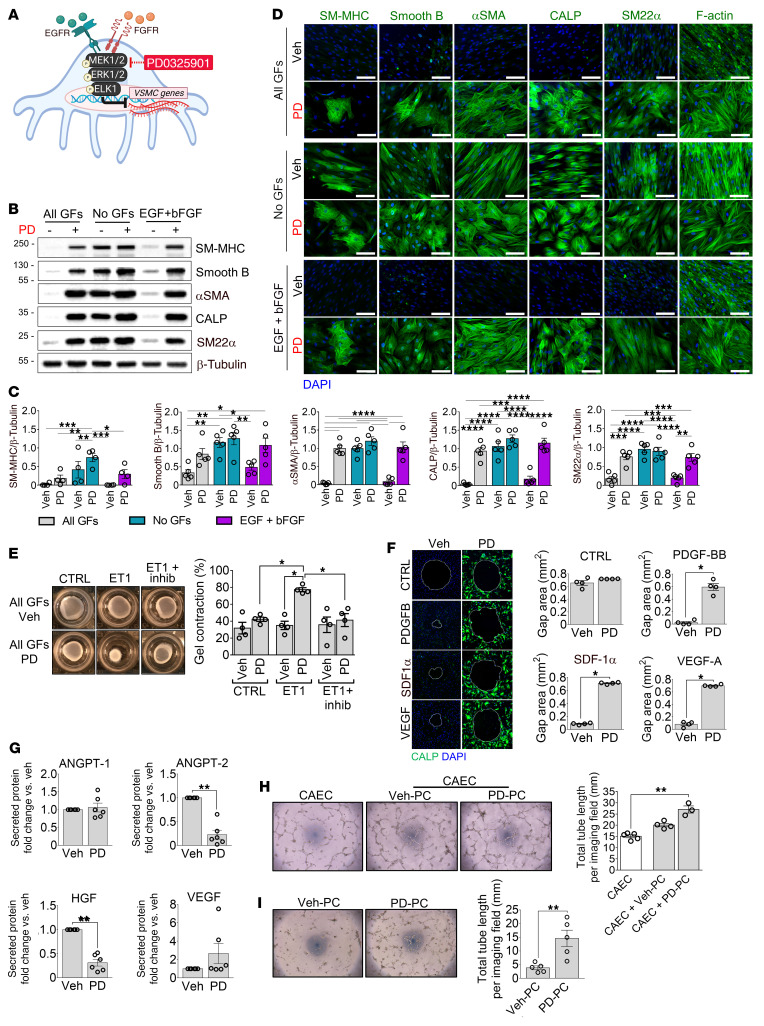
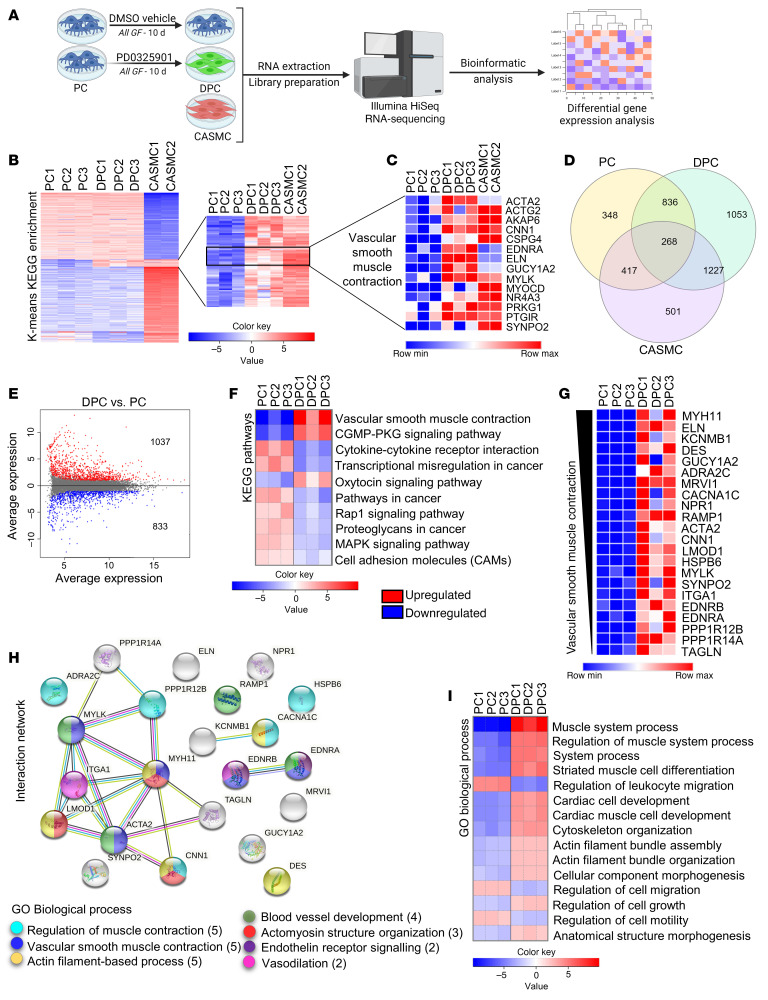
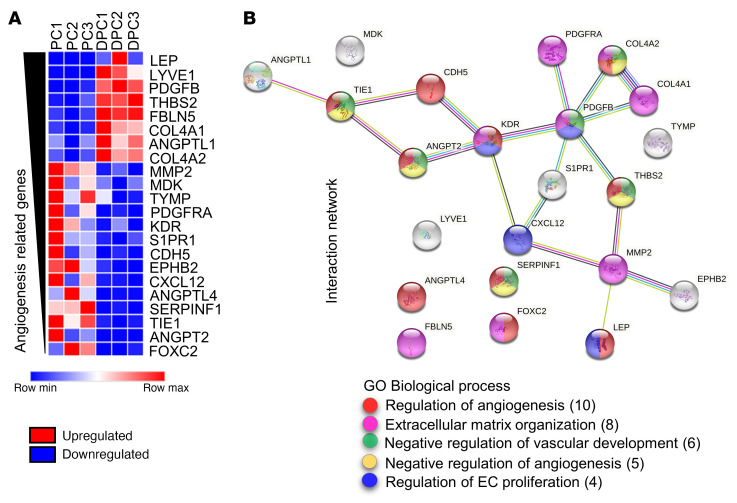
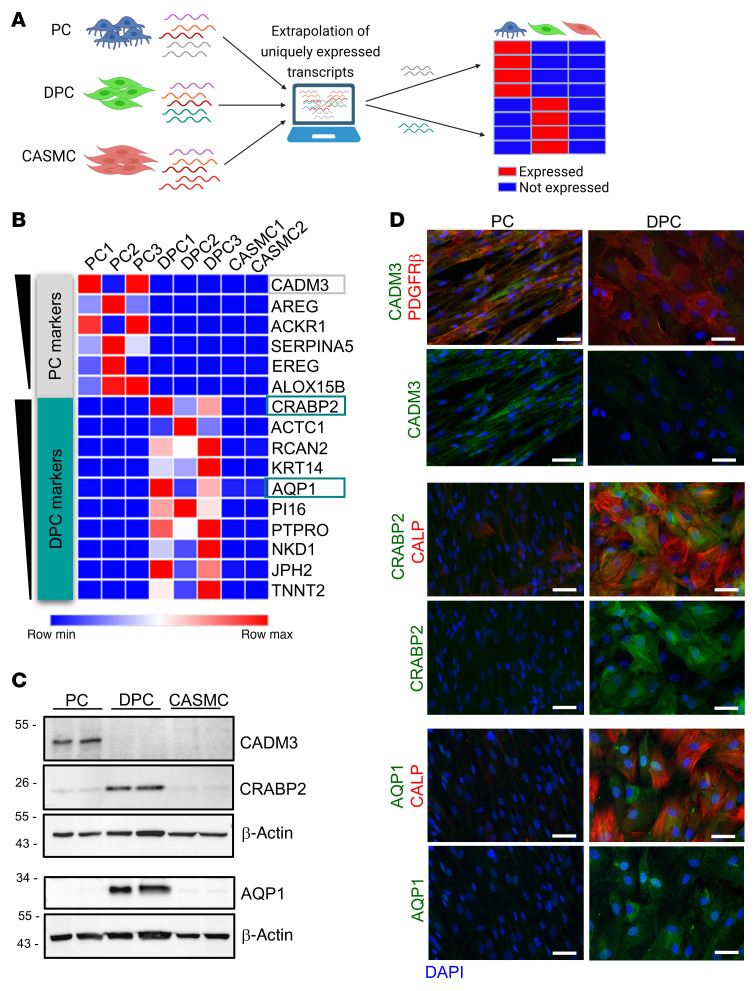
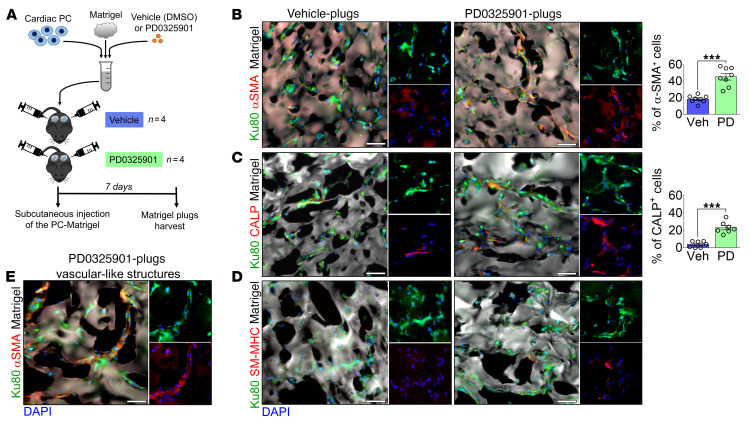
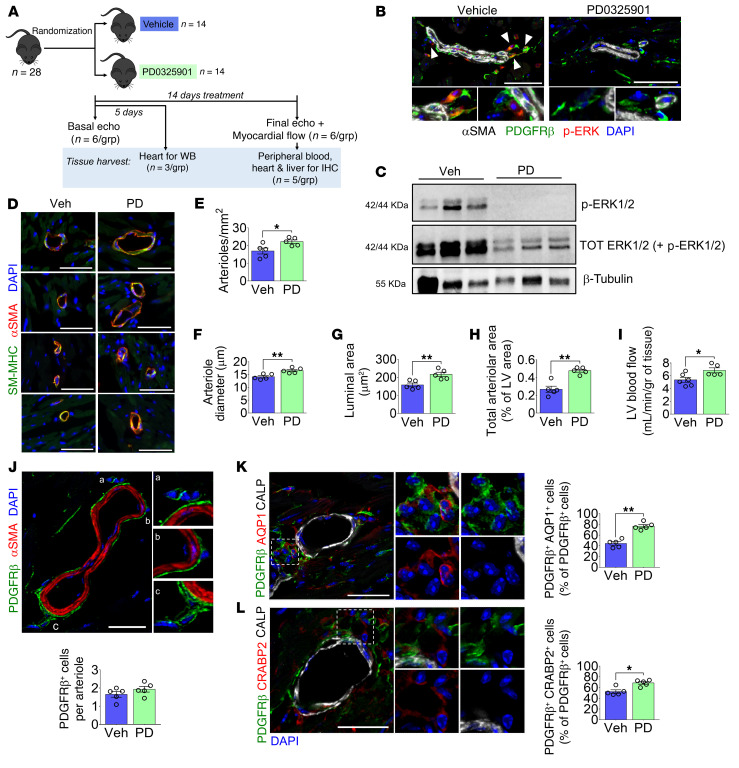
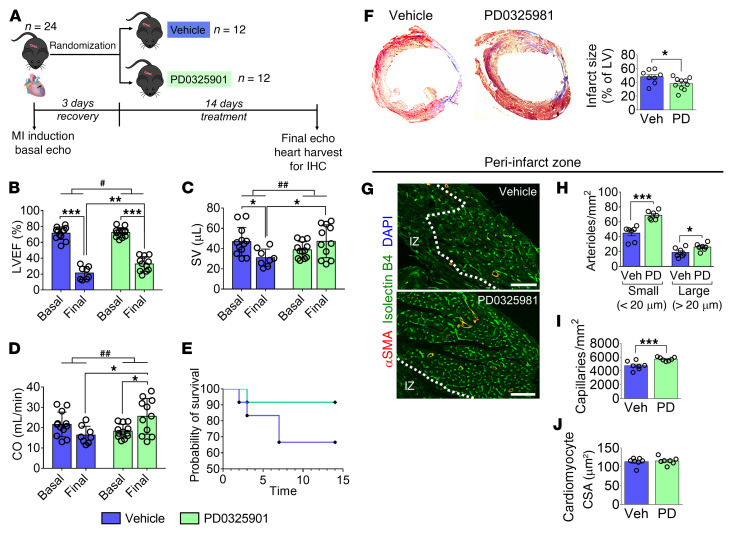
Pericytes (PCs) are abundant yet remain the most enigmatic and ill-defined cell population in the heart. Here, we investigated whether PCs can be reprogrammed to aid neovascularization. Primary PCs from human and mouse hearts acquired cytoskeletal proteins typical of vascular smooth muscle cells (VSMCs) upon exclusion of EGF/bFGF, which signal through ERK1/2, or upon exposure to the MEK inhibitor PD0325901. Differentiated PCs became more proangiogenic, more responsive to vasoactive agents, and insensitive to chemoattractants. RNA sequencing revealed transcripts marking the PD0325901-induced transition into proangiogenic, stationary VSMC-like cells, including the unique expression of 2 angiogenesis-related markers, aquaporin 1 (AQP1) and cellular retinoic acid-binding protein 2 (CRABP2), which were further verified at the protein level. This enabled us to trace PCs during in vivo studies. In mice, implantation of Matrigel plugs containing human PCs plus PD0325901 promoted the formation of αSMA+ neovessels compared with PC only. Two-week oral administration of PD0325901 to mice increased the heart arteriolar density, total vascular area, arteriole coverage by PDGFRβ+AQP1+CRABP2+ PCs, and myocardial perfusion. Short-duration PD0325901 treatment of mice after myocardial infarction enhanced the peri-infarct vascularization, reduced the scar, and improved systolic function. In conclusion, myocardial PCs have intrinsic plasticity that can be pharmacologically modulated to promote reparative vascularization of the ischemic heart.

Keywords: Angiogenesis; Cardiovascular disease; Microcirculation; Molecular biology; Vascular Biology.


Conflict of interest statement

Conflict of interest: The authors have declared that no conflict of interest exists.

Figures

Figure 1
Figure 1. Human cardiac PC antigenic and functional characterization.
(AC) Confocal immunofluorescence images of human hearts. Arrows point to CD31CD34+PDGFRβ+αSMA PCs around capillaries (indicated with “C”) and arterioles. Scale bars: 20 μm (A and B) and 100 μm (C). (D) Immunofluorescence images and bar graphs showing PC antigenic profile at passage 5 of culture. Scale bars: 50 μm. n = 3 patients’ PCs. Representative images are from 1 patient. (E and F) Expression of TCF21 in cardiac PCs and fibroblasts evaluated by RT-qPCR (E) and Western blotting (F). n = 4 fibroblasts in E (from 2 donors, assayed in independent experimental duplicates) and n = 3 fibroblast donors in F, n = 5 patients’ PCs. (G) Angiogenic factors secreted by cardiac PCs. Amounts of secreted factors throughout 48 hours were normalized against the total intracellular protein content. n = 6 patients’ PCs. (H) 2D-Matrigel assay with human coronary artery ECs (CAECs) in monoculture or coculture with cardiac PCs. PCs were labeled with dil (red fluorescent dye). Black arrowheads point to examples of PCs. n = 5 patients’ PCs, n = 1 CAEC. Representative images are from 1 patient’s PCs. All data are presented as individual values and mean ± SEM. *P < 0.05; **P < 0.01 by unpaired Mann-Whitney U test.
Figure 2
Figure 2. EGF and bFGF control human cardiac PC differentiation into VSMC-like cells.
(A) Immunofluorescence images showing expression of cytoskeletal proteins by naive and differentiated PCs when cultured with different GF combinations for 10 days. All GFs: VEGF, IGF-1, EGF, bFGF. No GFs: depletion of all GFs. – EGF/bFGF: only VEGF and IGF1 were added to the culture medium. + EGF/bFGF: only EGF and bFGF. Scale bars: 50 μm. Representative images are from 1 patient. (B and C) Western blotting analysis of VSMC markers in naive and differentiated PCs. Representative blots are from 1 patient. Graphs show blot densitometry for all patients. (D) Transcriptional analysis of contractile SM genes in naive and differentiated PCs. mRNA data are expressed as fold change versus coronary artery SMCs (CASMCs) used as reference population (dashed line at y = 1). For all analyses, n = 5 patients’ PCs. Data are presented as individual values and mean ± SEM. *P < 0.05; **P < 0.01; ***P < 0.001; ****P < 0.0001 by ordinary 2-way ANOVA followed by Tukey’s multiple comparisons test. (E) Cartoon illustrating the role of EGF and bFGF in regulating the PC phenotype.
Figure 3
Figure 3. Human cardiac PCs differentiated without GFs display functional properties of contractile VSMCs.
PCs were cultured with different GF combinations for 10 days and then used for functional assays. All GFs: VEGF, IGF-1, EGF, bFGF. No GFs: depletion of all GFs. – EGF/bFGF: only VEGF and IGF1. + EGF/bFGF: only EGF and bFGF. (A) Contraction assay. Cells were embedded in collagen gels, treated with a contraction inhibitor (inhib), and stimulated with endothelin-1 (ET-1). Bar graphs indicate the percentage of gel contraction after 24 hours. n = 4 patients’ PCs. Representative images are from 1 patient. (B) Fluo-4 calcium assay. Cells were loaded with the Fluo-4 dye and stimulated with ET-1 or vehicle. The intracellular calcium flux was measured as relative fluorescence units (RFU, green). Scale bars: 50 μm. Curves summarize n = 4 patients’ PCs (mean ± SEM are reported for each time point). Bar graphs show the quantification of the area under the curve and the peak fluorescence intensity. Representative images are from 1 patient. (C) Gap closure migration assay. Migration time was 24 hours. The absence of stimuli served as control (CTRL). Bar graphs show the final area of the gap. n = 3 patients’ PCs. Representative images are from 1 patient. (D and E) Expression of extracellular matrix proteins and transcripts. mRNA data are expressed as a fold change versus coronary artery SMCs (CASMCs) used as reference population (dashed line at y = 1). n = 3 to 5 patients’ PCs. All data are individual values and mean ± SEM. *P < 0.05; **P < 0.01; ***P < 0.001; ****P < 0.0001 by unpaired Kruskal-Wallis followed by Dunn’s multiple comparisons test to compare the 3 treatment groups (CTRL, ET-1, ET-1 + inhib) per experimental condition, and unpaired Mann-Whitney U test to compare the 2 experimental groups (All GFs and No GFs) per treatment (A); ordinary 2-way ANOVA followed by Tukey’s multiple comparisons test (B, D, and E); or unpaired Mann-Whitney U test (C).
Figure 4
Figure 4. Signaling studies in cardiac PCs.
(AC) Phospho-kinase array. For a quick screening of the intracellular signaling activated by EGF and bFGF in cardiac PCs, we performed a human phospho-kinase protein array (n = 2 patients’ PCs). The array allowed the detection of the phosphorylation of 43 kinases. (A) Experimental protocol. (B) Membranes representative of n = 1 PC. (C) Targets whose phosphorylation was induced by EGF and bFGF. Densitometry graphs show the quantification of all replicate spots from n = 2 patients’ PCs (2 spots each). Data are presented as individual values and mean ± SEM. No statistical tests were applied. (D) Western blot indicating the activation of EGFR/FGFR/ERK1/-2/ELK1 signaling by EGF and bFGF in cardiac PCs. n = 3 patients’ PCs, indicated by A, B, and C.
Figure 5
Figure 5. Inhibition of the MEK1/-2/ERK1/-2 signaling induces the switch from human cardiac PCs into VSMC-like cells in vitro.
(A) Schematic showing EGF and bFGF signaling in cardiac PCs and the MEK1/2 inhibitor employed. (BI) PCs were cultured for 10 days with different media as indicated, in the presence of PD0325901 (PD, 250 nM) or DMSO (Veh), before using them for the functional assays. (B and C) Analyses of protein expression using Western blotting. Representative blots are from 1 patient, and graphs show blot densitometry for n = 5 patients’ PCs. (D) Representative immunofluorescence images of PCs from 1 patient show contractile VSMC proteins and cytoskeletal F-actin expression (green). Scale bars: 50 μm. n = 5 patients’ PCs. (E) Contraction assay. Cells were embedded in collagen gels, treated with a contraction inhibitor (inhib), and stimulated with endothelin-1 (ET-1). Bar graphs indicate the percentage of gel contraction after 24 hours. (F) Gap closure migration assay. Migration time was 24 hours. Bar graphs report the area of the final gap. n = 4 patients’ PCs (E and F). Representative images are from 1 patient. SDF-1α, stromal cell–derived factor 1α. (G) Secreted angiogenic factors. n = 6 patients’ PCs. (H) 2D-Matrigel assay with human coronary artery ECs (CAECs) and PCs. CAECs were used in monoculture or cocultures with either Veh-PC or PD0325901-treated PC (PD-PC). n = 3 or 4 patients’ PCs. n = 1 CAEC (assayed 5 times). (I) 2D-Matrigel assay with PCs alone. n = 5 patients’ PCs. All data are plotted as individual values and mean ± SEM. *P < 0.05; **P < 0.01; ***P < 0.001; ****P < 0.0001 by ordinary 2-way ANOVA followed by Tukey’s multiple comparisons test (C); unpaired Kruskal-Wallis followed by Dunn’s multiple comparisons test to compare the 3 treatment groups (CTRL, ET-1, ET-1 + inhib) per experimental condition, and unpaired Mann-Whitney U test to compare the 2 experimental groups (All GFs Veh and All GFs PD) per treatment (E); unpaired Mann-Whitney U test (F, G, and I); or unpaired Kruskal-Wallis followed by Dunn’s multiple comparisons test (H).
Figure 6
Figure 6. Next-generation RNA-Seq analysis of naive and differentiated human cardiac PCs.
(A) Experimental design. RNA-Seq was performed in vehicle-treated PCs (n = 3 patients), PD0325901-differentiated PCs (DPC, n = 3 patients), and human coronary artery SMCs (CASMCs) (n = 2 donors). (B) K-means KEGG analysis of genes differentially expressed in the 3 cell populations. (C) List of most predominant genes associated with the pathway “Vascular smooth muscle contraction.” (D) The Venn diagram shows the number of transcripts expressed uniquely or shared by the 3 cell populations. (E) MA plot showing genes differentially expressed in DPCs versus naive PCs. (F) List of most regulated KEGG pathways in DPCs versus PCs. (G) Significant differentially expressed genes (DEGs) associated with “Vascular smooth muscle contraction.” (H) STRING protein-protein interaction analysis of genes in F, and emerging Gene Ontology (GO) Biological Process. (I) Main pathways resulting from the GO Biological Process analysis of DPCs versus PCs. Genes in the heatmap in G are ranked by log2FC. For EI, adjusted P value < 0.05.
Figure 7
Figure 7. Next-generation RNA-Seq analysis of angiogenesis-related genes in naive and differentiated human cardiac PCs.
(A) Analysis of angiogenesis-related DEGs in DPCs versus PCs. (B) STRING network analysis of angiogenesis-related genes and emerging GO Biological Process terms. Genes in the heatmap in A are ranked by log2FC. Absolute log2FC > 1.5. Adjusted P value < 0.05.
Figure 8
Figure 8. Discovery of unique antigens identifying naive PCs and VSMC-like differentiated PCs (DPCs).
(A) Schematic illustrating the experimental design. We compared the RNA-Seq results for PCs, PD0325901-differentiated PCs (DPCs), and control human coronary artery SMCs (CASMCs) to identify transcripts uniquely expressed by PCs and DPCs. (B) List of top genes that emerged during the analysis. Genes in the heatmap are ranked for average transcripts per million (TPM) expression in the positive population. (C and D) Three transcripts were validated at the protein level using Western blotting (C) and immunocytochemistry (D) in human PCs (n = 2 patients, same patients’ cells used for the RNA-Seq). Scale bars: 50 μm. Representative immunofluorescence images of PCs are from 1 patient. CADM3, cell adhesion molecule 3; CRABP2, cellular retinoic acid–binding protein 2; AQP1, aquaporin 1. The antigens employed for histology were selected according to the following criteria: (a) high identity between the human and mouse proteins to allow matching data from studies in the 2 species, (b) intracellular or membrane marker for precise localization in PCs in situ (exclusion of soluble factors), and (c) suitability for microscopy imaging.
Figure 9
Figure 9. Inhibition of MEK1/-2/ERK1/-2 signaling induces the differentiation of human cardiac PCs into VSMC-like cells upon transplantation in vivo.
(A) Experimental protocol of the in vivo Matrigel plug assay. (BD) Immunofluorescence images of vehicle- and PD0325901-Matrigel plugs show that human cells express VSMC markers. Human PCs embedded in the Matrigel plugs were identified using the human Ku80 antigen. Bar graphs show the percentage of human PCs expressing αSMA and CALP. n = 7 or 8 plugs (from 4 mice). (E) Immunofluorescence image documenting the presence of αSMA+ vascular-like structures within the PD0325901-Matrigel plugs. Veh, vehicle; PD, PD0325901. Data are plotted as individual values and mean ± SEM. ***P < 0.001 by Mann-Whitney U test. Scale bars: 50 μm.
Figure 10
Figure 10. A 2-week treatment with PD0325901 induces arteriologenesis and improves perfusion of the healthy mouse heart.
(A) Cartoon summarizing the experimental design. Mice were given the MEKi (10 mg/kg/d) or DMSO vehicle orally for 5 or 14 days. The drug was embedded in flavored jelly and eaten spontaneously by animals. All analyses were performed after 14 days, excluding the Western blot (WB) on heart samples done after 5 days. (B) Staining for p-ERK in PDGFRβ+ perivascular cells in the mouse hearts. Arrowheads point to p-ERK+ PCs in the vehicle group. Scale bars: 50 μm. n = 5 mice. (C) Western blot for p-ERK and total ERK using heart protein lysates confirmed the drug efficacy. n = 3 mice. (D) Immunofluorescence images showing examples of arterioles expressing αSMA and SM-MHC in vehicle- and PD-treated hearts. Scale bars: 50 μm. (E) Analysis of arteriole density in the left ventricle (LV). (F) Measurement of arterioles’ diameter in the LV. (G) Mean arteriolar luminal area, calculated starting from the mean diameter. (H) The total arteriolar area in the LV is expressed as a percentage of the whole LV area. (I) LV blood flow. (J) Immunofluorescence image of PDGFRβ+ PCs around arterioles and quantification of the average PC per arteriole in the LV. Scale bar: 20 μm. (K and L) Immunofluorescence images and analysis of PDGFRβ+AQP1+CRABP2+ cells around small arterioles in the LV. Scale bars: 20 μm. Graphs show the percentage of perivascular PDGFRβ+ cells expressing AQP1 or CRABP2. In DL, n = 5 mice. Veh, vehicle; PD, PD0325901. Data are reported as individual values and mean ± SEM. *P < 0.05, **P < 0.01 by unpaired Mann-Whitney U test.
Figure 11
Figure 11. A 2-week treatment with PD0325901 improves left ventricular function and vascularization in a mouse MI model.
(A) Cartoon summarizing the experimental design. Mice were given the MEKi (10 mg/kg/d) or DMSO vehicle orally for 14 days after MI induction. The drug was embedded in flavored jelly and eaten spontaneously by animals. (BD) Graphs showing basal and final echocardiography indices. For vehicle, n = 12 mice basal and n = 8 final. For PD, n = 12 mice basal and n = 11 final. Individual values and mean ± SD. SV, stroke volume; CO, cardiac output. (E) Graph showing mouse survival. (F) Representative images showing the Azan-Mallory staining of the LV and bar graphs indicating the infarct size expressed as a percentage of the LV area. n = 8 mice for Veh, n = 10 mice for PD. (G) Representative immunofluorescence images showing arterioles (αSMA, red) and capillaries (isolectin B4, green) in the peri-infarct myocardium. The dashed line defines the infarct zone (IZ). Scale bars: 100 μm. (HJ) Graphs showing the quantification of arteriole (H) and capillary (I) densities and cardiomyocyte cross-sectional area (CSA) (J) in the LV. n = 7 mice. In FJ, individual values and mean ± SEM are shown. Veh, vehicle; PD, PD0325901. *P < 0.05, **P < 0.01, ***P < 0.001; #P < 0.05, ##P < 0.01 in the comparison between changes (Δ). In BD, 2-way ANOVA (mixed effects model with Sidak’s multiple comparison test) was performed considering that there were missing data in the 2 treatment groups due to premature death after MI. In addition, we compared the changes (Δ) from basal to final times in the 2 groups using an unpaired Student’s t test. In F and HJ, an unpaired Mann-Whitney U test was used.

Similar articles

Cited by

References

    1. Verhaert D, et al. Long-term reverse remodeling with cardiac resynchronization therapy: results of extended echocardiographic follow-up. J Am Coll Cardiol. 2010;55(17):1788–1795. doi: 10.1016/j.jacc.2010.01.022. - DOI - PubMed
    1. Kobayashi K, et al. Dynamics of angiogenesis in ischemic areas of the infarcted heart. Sci Rep. 2017;7(1):7156. doi: 10.1038/s41598-017-07524-x. - DOI - PMC - PubMed
    1. Meier P, et al. The impact of the coronary collateral circulation on mortality: a meta-analysis. Eur Heart J. 2012;33(5):614–621. doi: 10.1093/eurheartj/ehr308. - DOI - PubMed
    1. Gaengel K, et al. Endothelial-mural cell signaling in vascular development and angiogenesis. Arterioscler Thromb Vasc Biol. 2009;29(5):630–638. doi: 10.1161/ATVBAHA.107.161521. - DOI - PubMed
    1. Nees S, et al. Isolation, bulk cultivation, and characterization of coronary microvascular pericytes: the second most frequent myocardial cell type in vitro. Am J Physiol Heart Circ Physiol. 2012;302(1):H69–H84. doi: 10.1152/ajpheart.00359.2011. - DOI - PubMed

Publication types

MeSH terms

Substances