Case Reports
. 2022 Jun 9;139(23):3439-3449.
doi: 10.1182/blood.2021013507.

Studies of a mosaic patient with DBA and chimeric mice reveal erythroid cell-extrinsic contributions to erythropoiesis

Affiliations
Case Reports

Studies of a mosaic patient with DBA and chimeric mice reveal erythroid cell-extrinsic contributions to erythropoiesis

Raymond T Doty et al. Blood. .

Abstract

We follow a patient with Diamond-Blackfan anemia (DBA) mosaic for a pathogenic RPS19 haploinsufficiency mutation with persistent transfusion-dependent anemia. Her anemia remitted on eltrombopag (EPAG), but surprisingly, mosaicism was unchanged, suggesting that both mutant and normal cells responded. When EPAG was withheld, her anemia returned. In addition to expanding hematopoietic stem/progenitor cells, EPAG aggressively chelates iron. Because DBA anemia, at least in part, results from excessive intracellular heme leading to ferroptotic cell death, we hypothesized that the excess heme accumulating in ribosomal protein-deficient erythroid precursors inhibited the growth of adjacent genetically normal precursors, and that the efficacy of EPAG reflected its ability to chelate iron, limit heme synthesis, and thus limit toxicity in both mutant and normal cells. To test this, we studied Rpl11 haploinsufficient (DBA) mice and mice chimeric for the cytoplasmic heme export protein, FLVCR. Flvcr1-deleted mice have severe anemia, resembling DBA. Mice transplanted with ratios of DBA to wild-type marrow cells of 50:50 are anemic, like our DBA patient. In contrast, mice transplanted with Flvcr1-deleted (unable to export heme) and wild-type marrow cells at ratios of 50:50 or 80:20 have normal numbers of red cells. Additional studies suggest that heme exported from DBA erythroid cells might impede the nurse cell function of central macrophages of erythroblastic islands to impair the maturation of genetically normal coadherent erythroid cells. These findings have implications for the gene therapy of DBA and may provide insights into why del(5q) myelodysplastic syndrome patients are anemic despite being mosaic for chromosome 5q deletion and loss of RPS14.


Figures

None
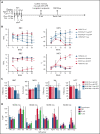
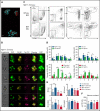
Graphical abstract
Figure 1.
Figure 1.
Clinical and molecular analyses of a patient with RSP19 mosaic DBA. (A) Hemoglobin level (left y-axis) is plotted as a function of time in months from eltrombopag initiation to present. Blue shading indicates dosing of eltrombopag (right y-axis). Red triangles indicate RBC transfusions; green triangle indicates a single therapeutic phlebotomy for iron removal (ferritin was 2985 mcg/L, see panel B). (B) Ferritin (left y-axis) is plotted as a function of time from eltrombopag initiation to present. Blue shading indicates dosing of eltrombopag (right y-axis). (C) Fraction of mutant alleles (RPS19 c.356 + 3A>C) in cultured skin fibroblasts, bone marrow mononuclear cells, and marrow subpopulations measured by digital droplet PCR at different time points in months in relation to eltrombopag initiation. (D) Fraction of mutant allele of granulocyte–macrophage and erythrocyte colony-forming unit (CFU-GM and CFU-E) grown from the patient’s bone marrow before and on treatment with eltrombopag. All CFUs were wild-type or heterozygous-mutated. Grans, granulocytes; NRBC, nucleated red blood cells; RBC, red blood cells.
Figure 2.
Figure 2.
Molecular characterization and pathology of the patient’s novel RPS19 mutation. (A) The patient’s 2012 and 2018 chromosome 19 single nucleotide polymorphism genotype: the upper pattern is the B allele frequency and the lower pattern is the log R ratio. Red arrows indicate the B allele frequency splitting widening over time; blue arrows indicate no change in intensity of the total alleles. (B) Identification and visualization of RPS19 transcripts using the Integrative Genome Viewer. De novo transcript assembly identified 2 transcripts that mapped to the RPS19 gene locus (MSTRG.7258.1 and MSTRG.7258.2) and are shown below the reference RPS19 locus. Of note, although MSTRG.7258.1 resembles the reference transcripts, MSTRG.7258.2 lacks exon 4 (red box). (C) The normalized FPKM values of the indicated RPS19 transcripts are shown for all samples. MSTRG.7258.1, the WT transcript, was expressed in all samples, but MSTRG.7258.2 was expressed in the patient sample. (D) Patient and control complementary DNA transcripts were amplified using primers in exon 3 and exon 5 of the RPS19 gene. The red arrow indicates the WT transcript; the blue arrow the truncated transcript skipping exon 4 found in the patient but not control. Results were validated by Sanger sequencing. (E) 40s and 60s ribosomal subunit abundance determined by the areas under the peaks to calculate 40s/60s abundance ratios. Bars indicate standard deviation (n = 3). *P < .05. FPKM, fragments per kilobase per million.
Figure 3.
Figure 3.
Rpl11 haploinsufficient chimeras model DBA mosaicism. (A) The experimental design for generation of 0%, 50%, 80%, and 100% mutant chimeras and their controls. Flvcr1-deleted (FFMx) and Mxcre (++Mx) control mice are treated with pIpC, whereas Rpl11 haploinsufficient (+LT2) and T2cre (++T2) control mice are treated with tamoxifen starting 5 weeks before transplant. Marrow cells from femurs and tibias from the deleted and control mice were mixed with wild-type marrow cells from untreated ubiquitin-GFP mice (WT GFP) at 50:50 and 80:20 ratios and then transplanted into recipient mice. Because mice receiving 100% Flvcr1-deleted marrow succumb to severe anemia by 7 weeks posttransplant, the 100% FFMx and control ++Mx transplants were performed before pIpC treatment. These recipient mice were then treated with pIpC after engraftment 4 weeks later. Deletion efficiency of donor mice is shown in supplemental Figure 1. (B) Monthly analysis of red cell counts and MCV of Rpl11 chimeras, Flvcr chimeras, along with their respective cre control chimeras. (C) The relative RBC, Hb, and HCT of Rpl11 and Flvcr chimeras compared with transplants that received 100% deleted (0% recovery) or control (100% recovery) marrow. MCV is presented as a percent of control transplants. (D) The frequency of peripheral blood granulocytes, RBC, B cells, and T cells that were from the WT (GFP+) partner cells in the chimeric mice 16 weeks after transplant are shown with significant differences compared with the respective control chimeras indicated. Data are presented as mean ± standard deviation (mean ± standard error of the mean, panel C) from 3 to 8 Flvcr chimeras, 6 Mx control chimeras, 6 to 9 Rpl11 chimeras, and 7 T2 control chimeras. *P < .05; **P < .01; ***P < .001 from Student t test. CBC, complete blood count; ctrl, control; Hb, hemoglobin; HCT, hematocrit; MCV, mean corpuscular volume; pIpC, polyI-polyC.
Figure 4.
Figure 4.
RPL11 haploinsufficient cells prevent expansion of normal erythroid cells on erythroblastic islands. (A) Photomicrograph of 3 erythroblastic islands (EBIs) from wild-type C57Bl/6J mice. Ter119+ cells are in cyan; F4/80+ macrophages are in red. The indicator bar is 10 μM. (B) Representative ImageStream flow cytometry analysis of enriched bone marrow EBI from a 50:50 Rpl11 chimeric transplant mouse showing both GFP+ and Rpl11 haploinsufficient (GFP) Ter119+ erythroid cells attached within the same EBIs. GFP is overexposed in the panels on the right to aid in resolution of whether the macrophages express GFP or not because macrophage GFP is difficult to detect compared with the very high erythroid GFP expression. The top 3 EBI panels contain GFP+ macrophages. About 2/3 of the imaged EBIs included GFP+ (therefore control WT) macrophages. Of 18 EBIs examined from Rpl11-chimeras, all contained both GFP+ and GFP Ter119+ erythroid precursors. ImageStream analysis of T2 control and Flvcr-chimeras are in supplemental Figure 4. (C) Representative flow cytometry analysis of mouse bone marrow erythroid precursor cells from a 50:50 Rpl11-chimeric transplant mouse before (whole BM) and after enrichment for erythroblastic islands (BM EBI). Cells are gated to identify BFU-E through reticulocytes as before. Gating includes lineage-negative precursors (LNPC), erythroid precursor population I includes BFU-E, CFU-E, and proerythroblasts, whereas populations II-V are basophilic, polychromatic, orthochromatic erythroblasts, and reticulocytes, respectively. The isolated EBIs included between 6.6% and 12.8% of the total marrow mononuclear cells recovered from whole marrow in the chimeric mice. Representative flow analysis of T2 control and Flvcr-chimeras are in supplemental Figure 5. (D) Erythroid precursor cell composition of EBIs isolated from 50:50 chimeras. Rpl11-hap:GFP (N = 3), T2 control:GFP (N = 6), Flvcr-del:GFP (N = 4), and Mx control:GFP (N = 2) mice showing the percentage of cre+ control or mutant erythroblast cells along with the percentage of GFP+ partner cells in each population stage (I-V) of erythroid differentiation in EBI isolated from marrow. (E) Quantitative PCR analysis showing relative expression of heme induced genes Spic, Hmox1, Slc40a1 (ferroportin), and Slc48a1 (HRG1) in F4/80+ EBI macrophages isolated from 50:50 chimeric transplant mice (Rpl11 and T2 control chimeras, N = 5 mice; Flvcr and Mx control chimeras, N = 3 mice). The cre control or mutant F4/80+ macrophages (GFP and their wild-type (GFP+) chimeric partner F4/80+ macrophages were sorted separately and analyzed as technical replicates to eliminate potential bias from unequal prevalence. (F) Heme content in WT/GFP+ polychromatic erythroblasts (population III) isolated from EBI of chimeric mice (N = 3-8 mice). Data are presented as mean ± standard deviation. *P < .05; **P < .01; ***P < .001 from Student t test. BFU-E, burst-forming unit–erythroid; BM, bone marrow.
Figure 5.
Figure 5.
Mechanisms by which normal erythropoiesis would fail. Because EBIs contain both DBA and normal erythroid cells, the high heme export from DBA CFU-E/proerythroblasts to the central macrophage might saturate its uptake mechanism and/or its processing abilities (eg, HMOX1). This could then inhibit further heme export from both DBA and normal CFU-E/proerythroblasts that share this EBI, and both die of resulting heme toxicities. An alternative possibility is that the excessive heme disrupts central macrophage transcription, translation, or hemoprotein formation and thus disrupts its “nurse cell” function, impairing the differentiation of all (ie, DBA and normal) adherent red cell precursors.

Comment in

  • Defending the island against excess heme.
    Blanc L, Lipton JM. Blanc L, et al. Blood. 2022 Jun 9;139(23):3359-3360. doi: 10.1182/blood.2022016341. Blood. 2022. PMID: 35679077 Free PMC article. No abstract available.

Similar articles

Cited by

References

    1. Da Costa L, Leblanc T, Mohandas N. Diamond-Blackfan anemia. Blood. 2020;136(11):1262-1273. - PMC - PubMed
    1. Ulirsch JC, Verboon JM, Kazerounian S, et al. . The genetic landscape of Diamond-Blackfan anemia [published correction appears in Am J Hum Genet. 2019;104(2):356]. Am J Hum Genet. 2018;103(6):930-947. - PMC - PubMed
    1. Yang Z, Keel SB, Shimamura A, et al. . Delayed globin synthesis leads to excess heme and the macrocytic anemia of Diamond Blackfan anemia and del(5q) myelodysplastic syndrome. Sci Transl Med. 2016;8(338):338ra67. - PMC - PubMed
    1. Doty RT, Yan X, Lausted C, et al. . Single-cell analyses demonstrate that a heme-GATA1 feedback loop regulates red cell differentiation. Blood. 2019;133(5):457-469. - PMC - PubMed
    1. Rio S, Gastou M, Karboul N, et al. . Regulation of globin-heme balance in Diamond-Blackfan anemia by HSP70/GATA1. Blood. 2019;133(12):1358-1370. - PMC - PubMed

Publication types