. 2022 Dec;76(6):1634-1648.
doi: 10.1002/hep.32490. Epub 2022 Jun 29.

Consensus subtypes of hepatocellular carcinoma associated with clinical outcomes and genomic phenotypes

Affiliations

Consensus subtypes of hepatocellular carcinoma associated with clinical outcomes and genomic phenotypes

Sung Hwan Lee et al. Hepatology. 2022 Dec.

Abstract

Background and aims: Although many studies revealed transcriptomic subtypes of HCC, concordance of the subtypes are not fully examined. We aim to examine a consensus of transcriptomic subtypes and correlate them with clinical outcomes.

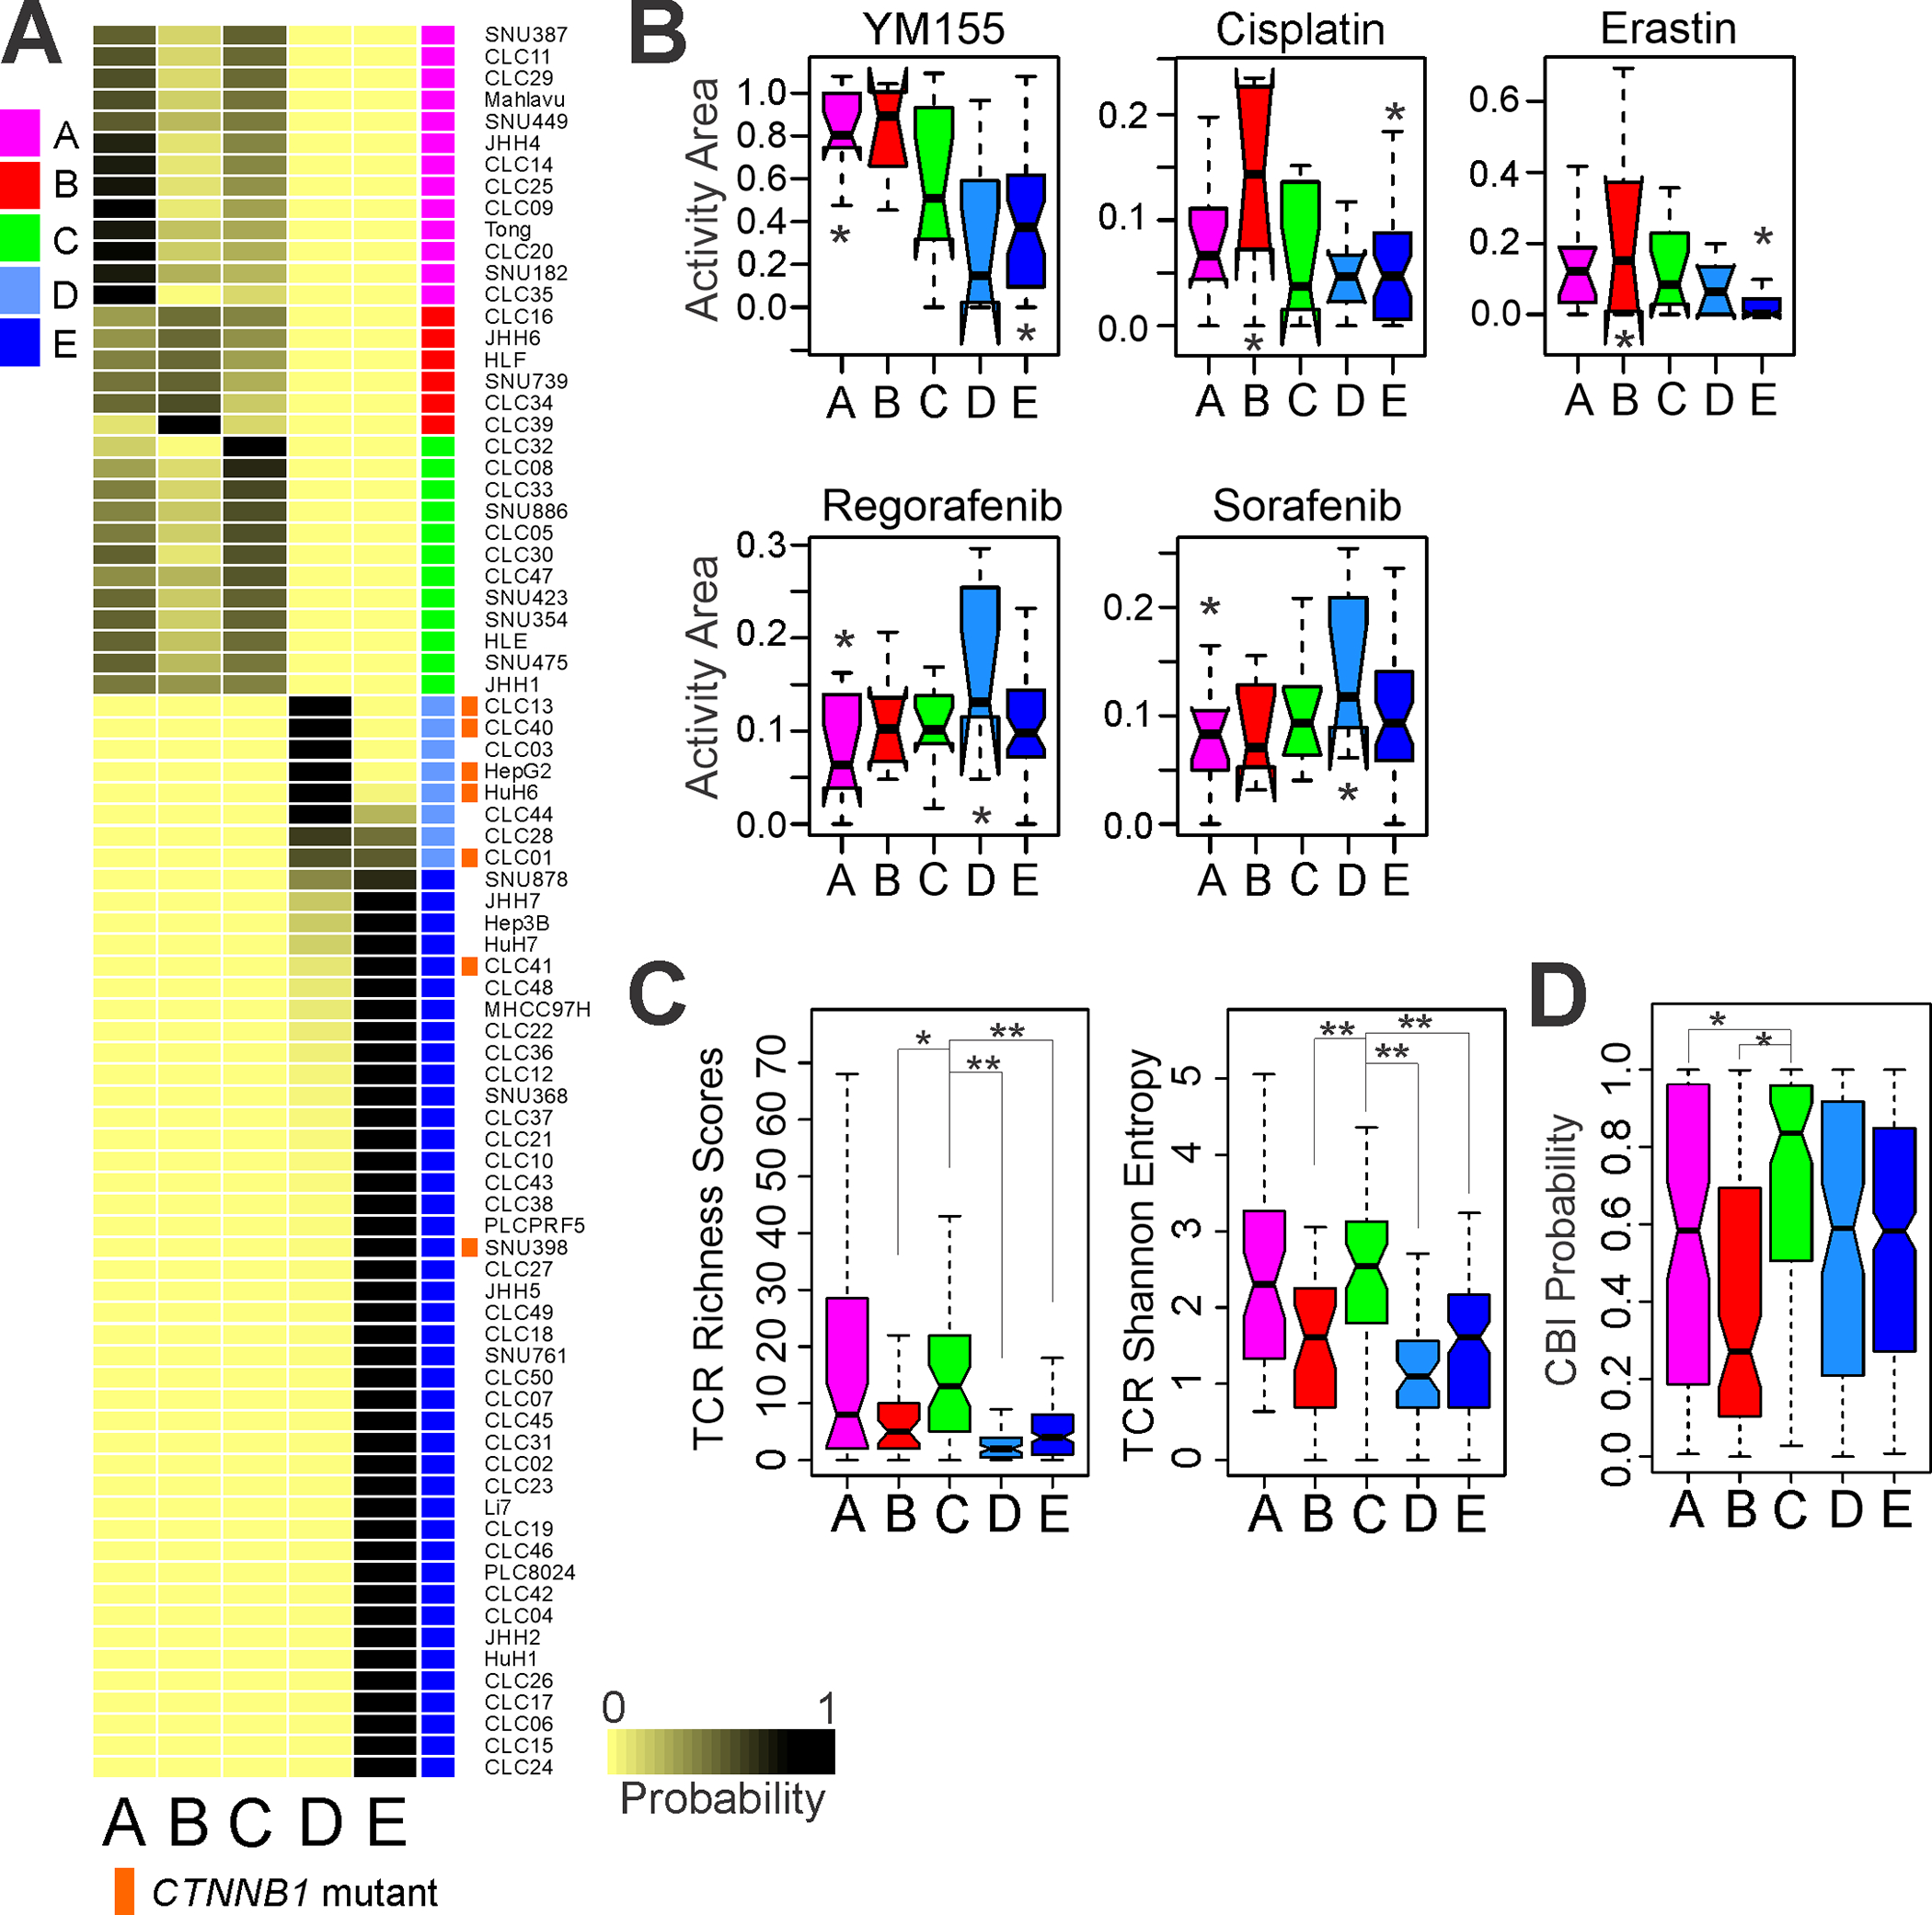
Approach and results: By integrating 16 previously established genomic signatures for HCC subtypes, we identified five clinically and molecularly distinct consensus subtypes. STM (STeM) is characterized by high stem cell features, vascular invasion, and poor prognosis. CIN (Chromosomal INstability) has moderate stem cell features, but high genomic instability and low immune activity. IMH (IMmune High) is characterized by high immune activity. BCM (Beta-Catenin with high Male predominance) is characterized by prominent β-catenin activation, low miRNA expression, hypomethylation, and high sensitivity to sorafenib. DLP (Differentiated and Low Proliferation) is differentiated with high hepatocyte nuclear factor 4A activity. We also developed and validated a robust predictor of consensus subtype with 100 genes and demonstrated that five subtypes were well conserved in patient-derived xenograft models and cell lines. By analyzing serum proteomic data from the same patients, we further identified potential serum biomarkers that can stratify patients into subtypes.

Conclusions: Five HCC subtypes are correlated with genomic phenotypes and clinical outcomes and highly conserved in preclinical models, providing a framework for selecting the most appropriate models for preclinical studies.


Conflict of interest statement

Conflict of interests

The authors declare that they have no conflict of interests.

Figures

Fig. 1.
Fig. 1.. Consensus subtypes of HCC discovered by cluster-of-clusters assignment analysis of previously recognized molecular and genomic subtypes.
A, Schematic diagram of the study strategy. Briefly, subtype information from the 16 subtyping algorithms was converted to the binary vectors (tumor samples in columns and subtype information in rows) and tumors were re-grouped according to those vectors by applying COCA. Consensus subtypes were further validated in the validation data set. B, Heatmap and hierarchical dendrogram of the consensus subtypes. HCC tumors were subgrouped according to the shared features of independently discovered molecular subtypes. Tumors from 4 HCC cohorts (NCI, TCGA, UHK, and Heptromic cohorts, n=1006) were stratified using 16 genomic classification methods, and subtype information was used for the COCA analysis. Columns represent HCC tumors, and rows represent molecular subtypes from the 16 classification methods. C, Clinical significance of the 5 consensus subtypes of HCC in the training cohorts. OS, overall survival. Tables at bottom shows p-values from pair-wise comparison of subtypes.
Fig. 2.
Fig. 2.. Validation of the 5 consensus subtypes of HCC.
A, Expression patterns of the prediction signatures for the 5 consensus subtypes of HCC in the TCGA and validation cohorts. B, Prognostic significance of the consensus subtypes in the validation cohort (P=2.0× 10⁻⁷, log-rank test, n=748). Tables at bottom shows p-values from pair-wise comparison of subtypes. C, Recurrence risk scores for the 5 subtypes in the TCGA and validation cohorts. In the box plots, the boundary of the box indicates the 25th to 75th percentile, a black line within the box marks the mean. Whiskers above and below the box indicate the 10th and 90th percentiles.
Fig. 3.
Fig. 3.. Genomic alterations associated with the consensus subtypes of HCC in the TCGA cohort.
A, Numbers of nonsynonymous mutations in the HCC subtypes (n=367). B, Copy number alteration (CNA) scores, which were defined by the summation of the absolute values of each tumor’s GISTIC2 score, in the subtypes (n=361). Subtype B had significantly more alterations than the other subtypes did (P<0.001, Student t-test, for all comparisons) C, Heat map of CNAs in the 22 autosomes in the 5 subtypes. Red and blue indicate chromosome copy number gains and losses, respectively. D, Non-silent mutation rates for individual tumors (top); sex and grade details (middle), and genes with mutation rates more than 3% (bottom). Mutation types are indicated in the legend at the bottom. P values (χ2 test) describe associations between the mutations and consensus subtypes. Red indicates genes significantly associated with the subtypes (P<0.05).
Fig. 4.
Fig. 4.. Significant association of consensus subtypes with potential treatment.
A, Consensus subtypes in liver cancer cell lines (n = 81 in LIMORE data set). Liver cancer cell lines were stratified according to PICS100 predictor. Activation mutations of CTNNB1 is significantly associated with subtype D (P=1.1 × 10⁻⁶ by χ2-test). Of 7 cell lines with mutations in CTNNB1, 5 were classified into subtype D. B, Box plots of activity area reflecting drug response of cell lines. Significance of association was estimated by one-way ANOVA (P<0.05). * indicates two subtypes with most significant difference in pair-wise comparison by Student t-test (P<0.05). C, Box plots of TCR diversity in HCC subtypes. Significance of association was estimated by ANOVA (P<0.001). Subtype C had the highest TCR diversity (*P<0.01, **P<0.001, Student t-test). D, Box plots of immunotherapy response probability. Subtype C had the highest immunotherapy response probability (*P<0.01, Student t-test). In the box plots, the boundary of the box indicates the 25th to 75th percentile, a black line within the box marks the mean. Whiskers above and below the box indicate the 10th and 90th percentiles. CBI, checkpoint blockade immunotherapy.
Fig. 5.
Fig. 5.. Consensus subtypes of HCC in PDX models.
A, Expression patterns of PICS100 genes in HCC PDX tumors. PDX tumors (n=75) were stratified according to PICS100. B, Mice were transplanted with PDX tumors as indicated in Materials and Methods. Mice were then randomized to treatment with vehicle (controls) or sorafenib of 50 mg/kg. P-values (Student t-test) indicate significance of difference at final measurement of tumor size. C, Depletion of β-catenin expression decreased sorafenib sensitivity in HCC cells. Results of cell viability assays performed 48 h after sorafenib treatment in HepG2 and HuH1 cells transduced with b-catenin-silencing shRNAs (shb-cat-2, shb-cat-4) or a control shRNA against green fluorescent protein (shGFP). Cell viability after sorafenib treatment were compared using a Student t test. Data shown are means ± s.e’s. of the mean from three independent experiments. *P<0.01. **P<0.001
Fig. 6.
Fig. 6.. Subtype-specific serum markers
A, Heatmap of standardized protein levels in serum specific to consensus subtypes in HCC patients. Subtype specific serum markers were selected according to AUC values from receiver operating characteristics (ROC) analysis. HI indicates healthy individuals with normal liver. B, ROC plot for best biomarker showing positive predictive power for each consensus subtypes. C, Serum levels of 5 serum markers in the consensus subtypes. In the box plots, the boundary of the box indicates the 25th to 75th percentile, a black line within the box marks the mean. Whiskers above and below the box indicate the 10th and 90th percentiles.
Fig. 7.
Fig. 7.. Summary of the 5 consensus subtypes of HCC.
The 5 subtypes’ differences are well-reflected by their biological and clinical characteristics. STM, stem cell; CIN, chromosome instable; IMH, immune high; BCM, beta-catenin with male predominance; DLP, differentiated and low proliferation.

References

    1. Forner A, Llovet JM, Bruix J. Hepatocellular carcinoma. Lancet 2012;379:1245–1255. - PubMed
    1. Marquardt JU, Andersen JB, Thorgeirsson SS. Functional and genetic deconstruction of the cellular origin in liver cancer. Nat Rev Cancer 2015;15:653–667. - PubMed
    1. Lee JS. The mutational landscape of hepatocellular carcinoma. Clin Mol Hepatol 2015;21:220–229. - PMC - PubMed
    1. Lee JS. Genomic profiling of liver cancer. Genomics Inform 2013;11:180–185. - PMC - PubMed
    1. Lee JS, Chu IS, Heo J, Calvisi DF, Sun Z, Roskams T, Durnez A, et al. Classification and prediction of survival in hepatocellular carcinoma by gene expression profiling. Hepatology 2004;40:667–676. - PubMed

Publication types