. 2022 Jun 1;110(11):1806-1821.e8.
doi: 10.1016/j.neuron.2022.03.003. Epub 2022 Mar 28.

Human and mouse trigeminal ganglia cell atlas implicates multiple cell types in migraine

Affiliations

Human and mouse trigeminal ganglia cell atlas implicates multiple cell types in migraine

Lite Yang et al. Neuron. .

Abstract

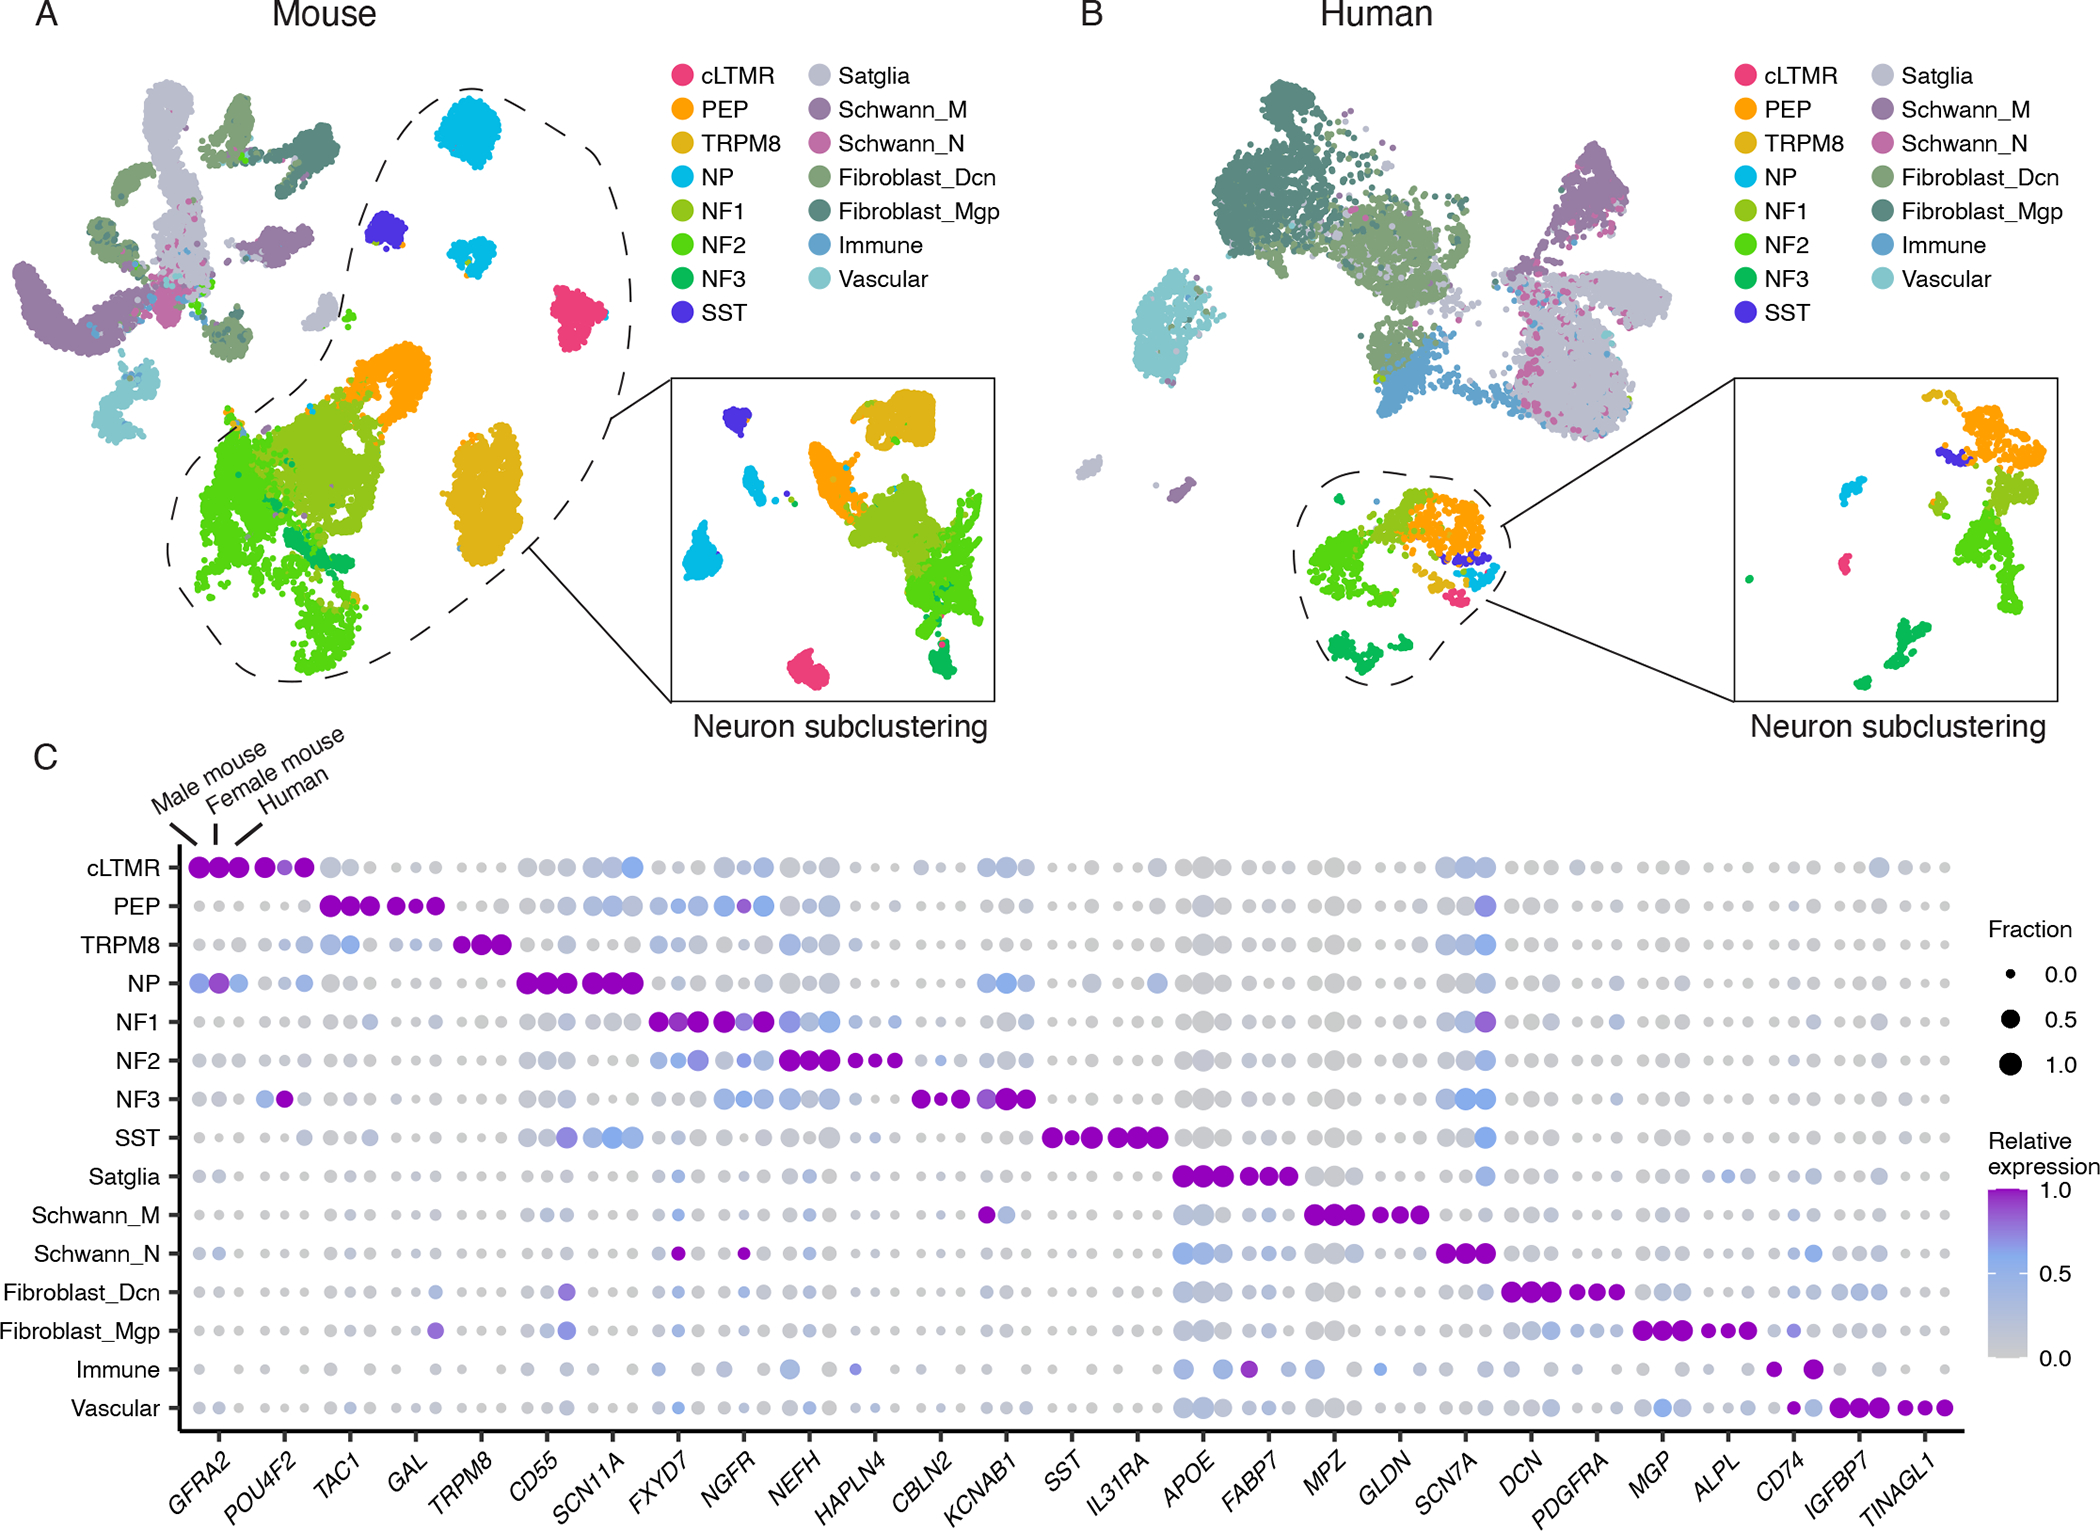
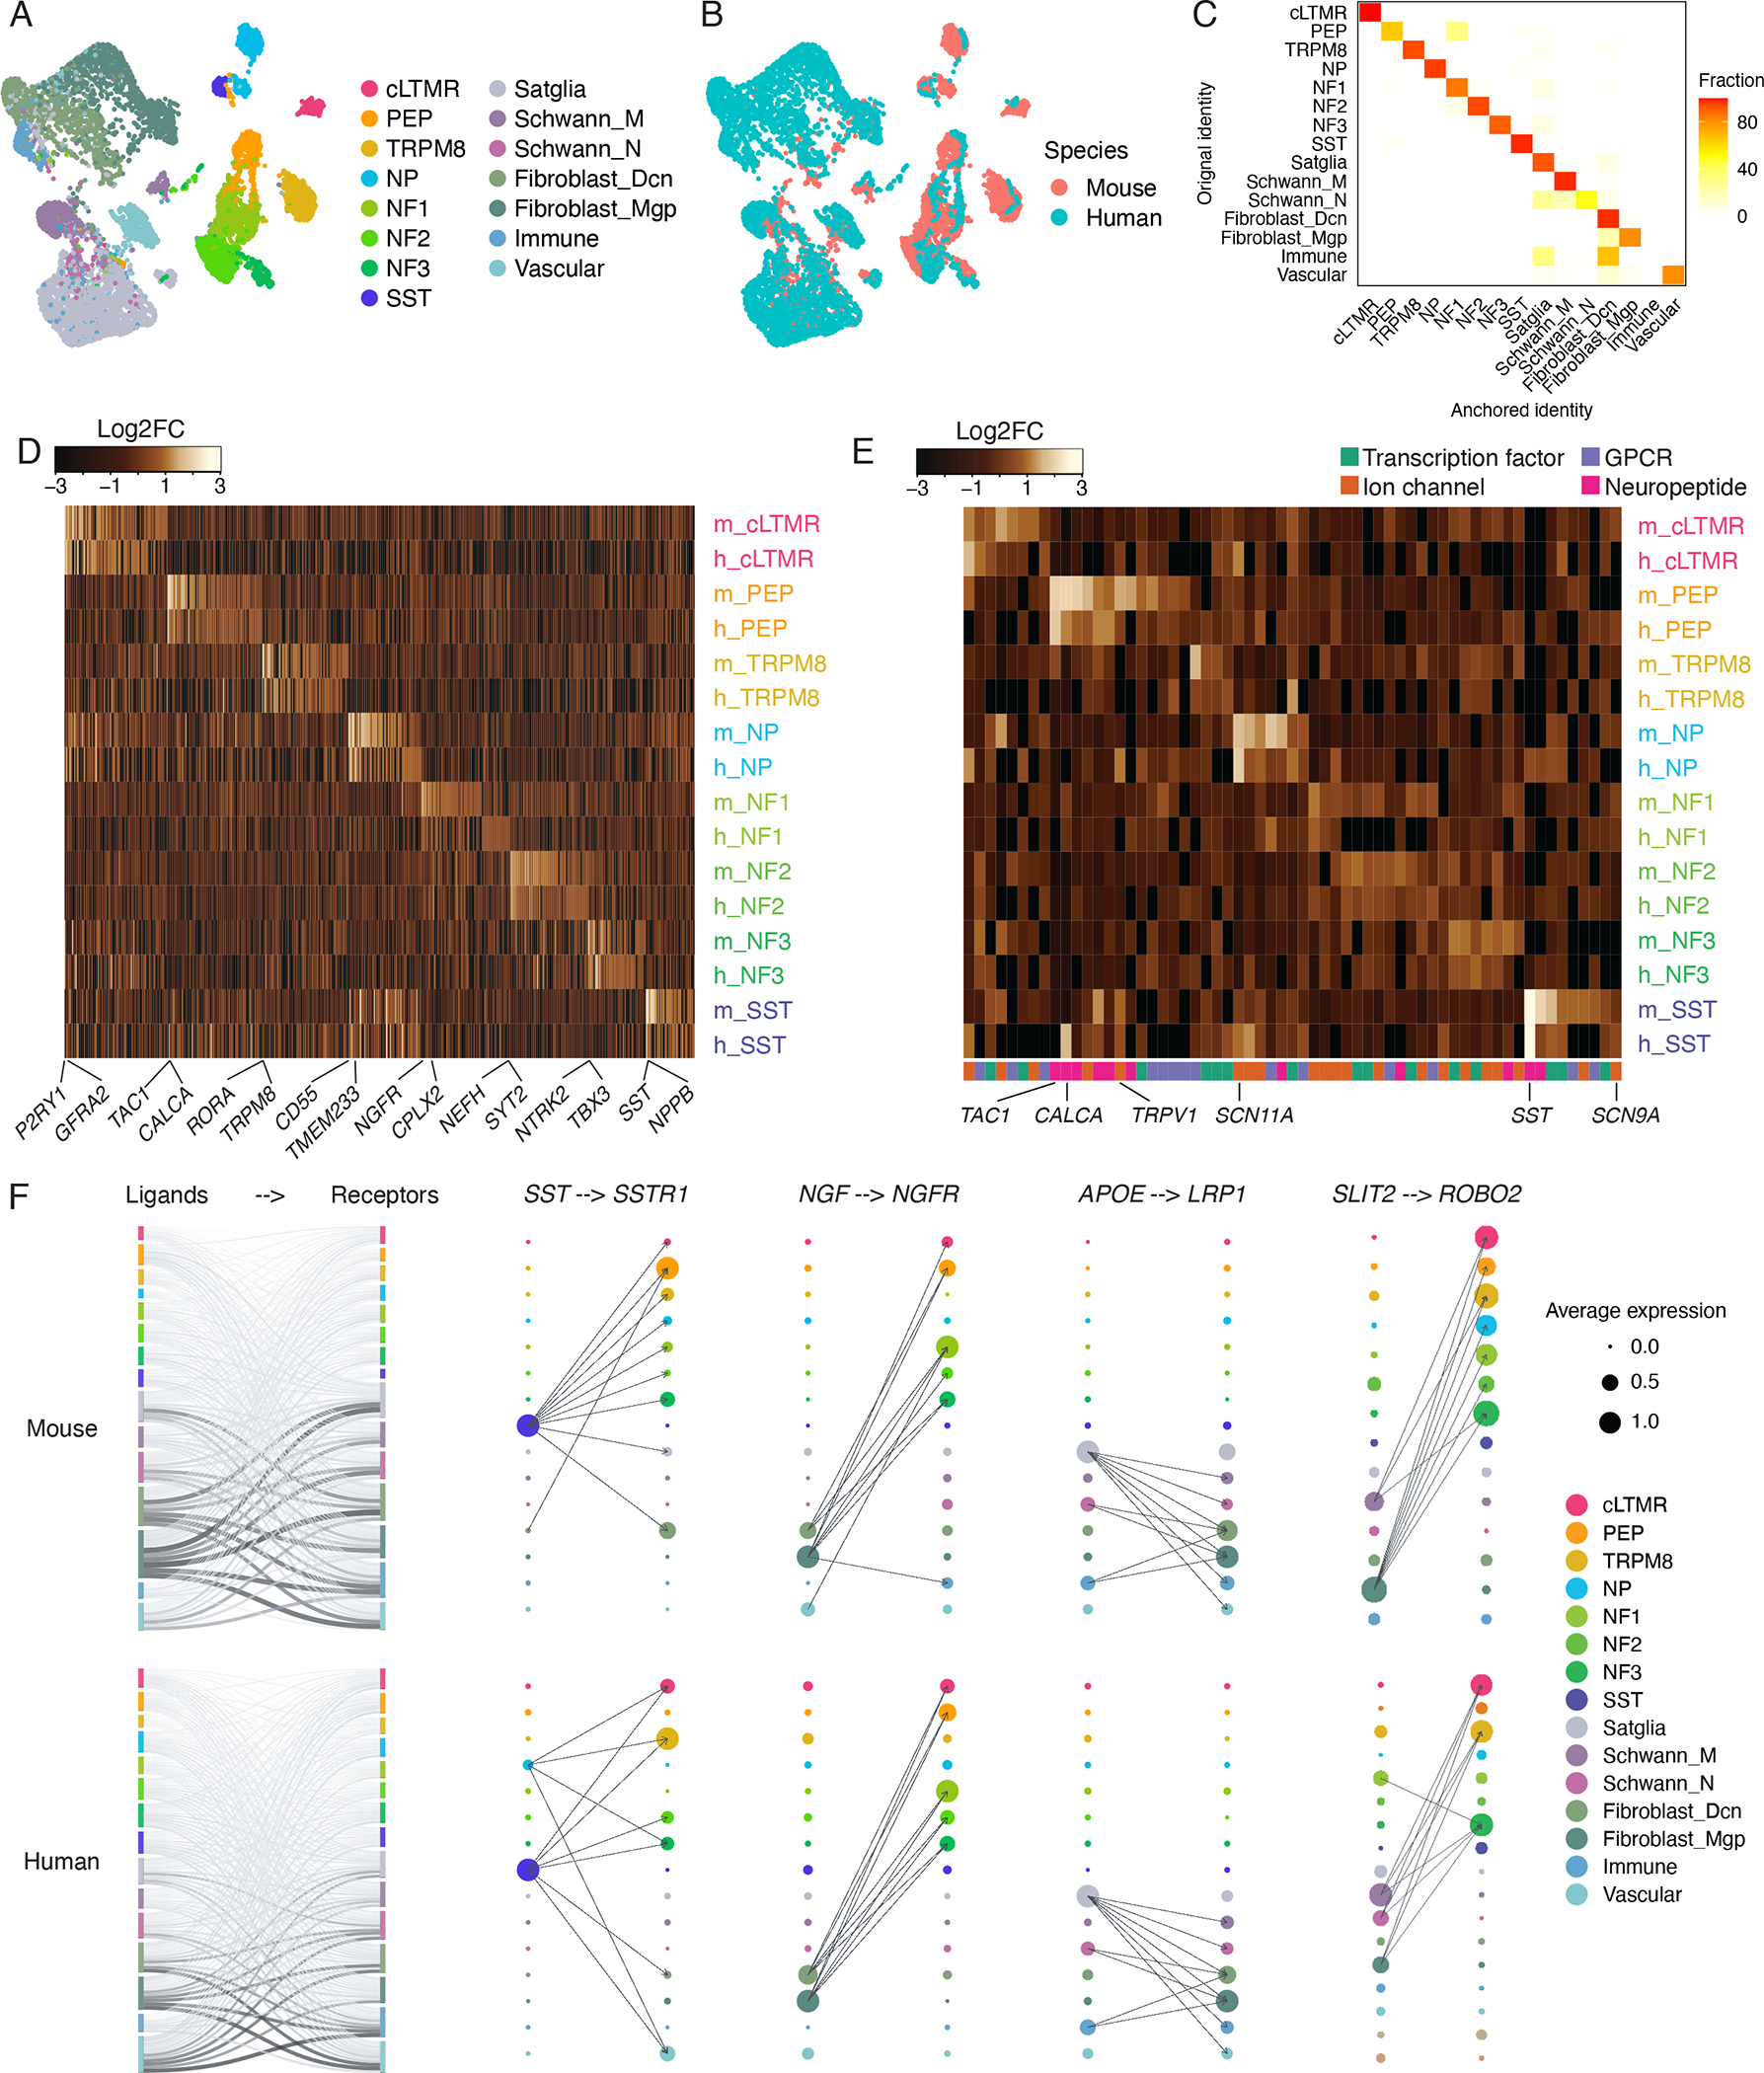
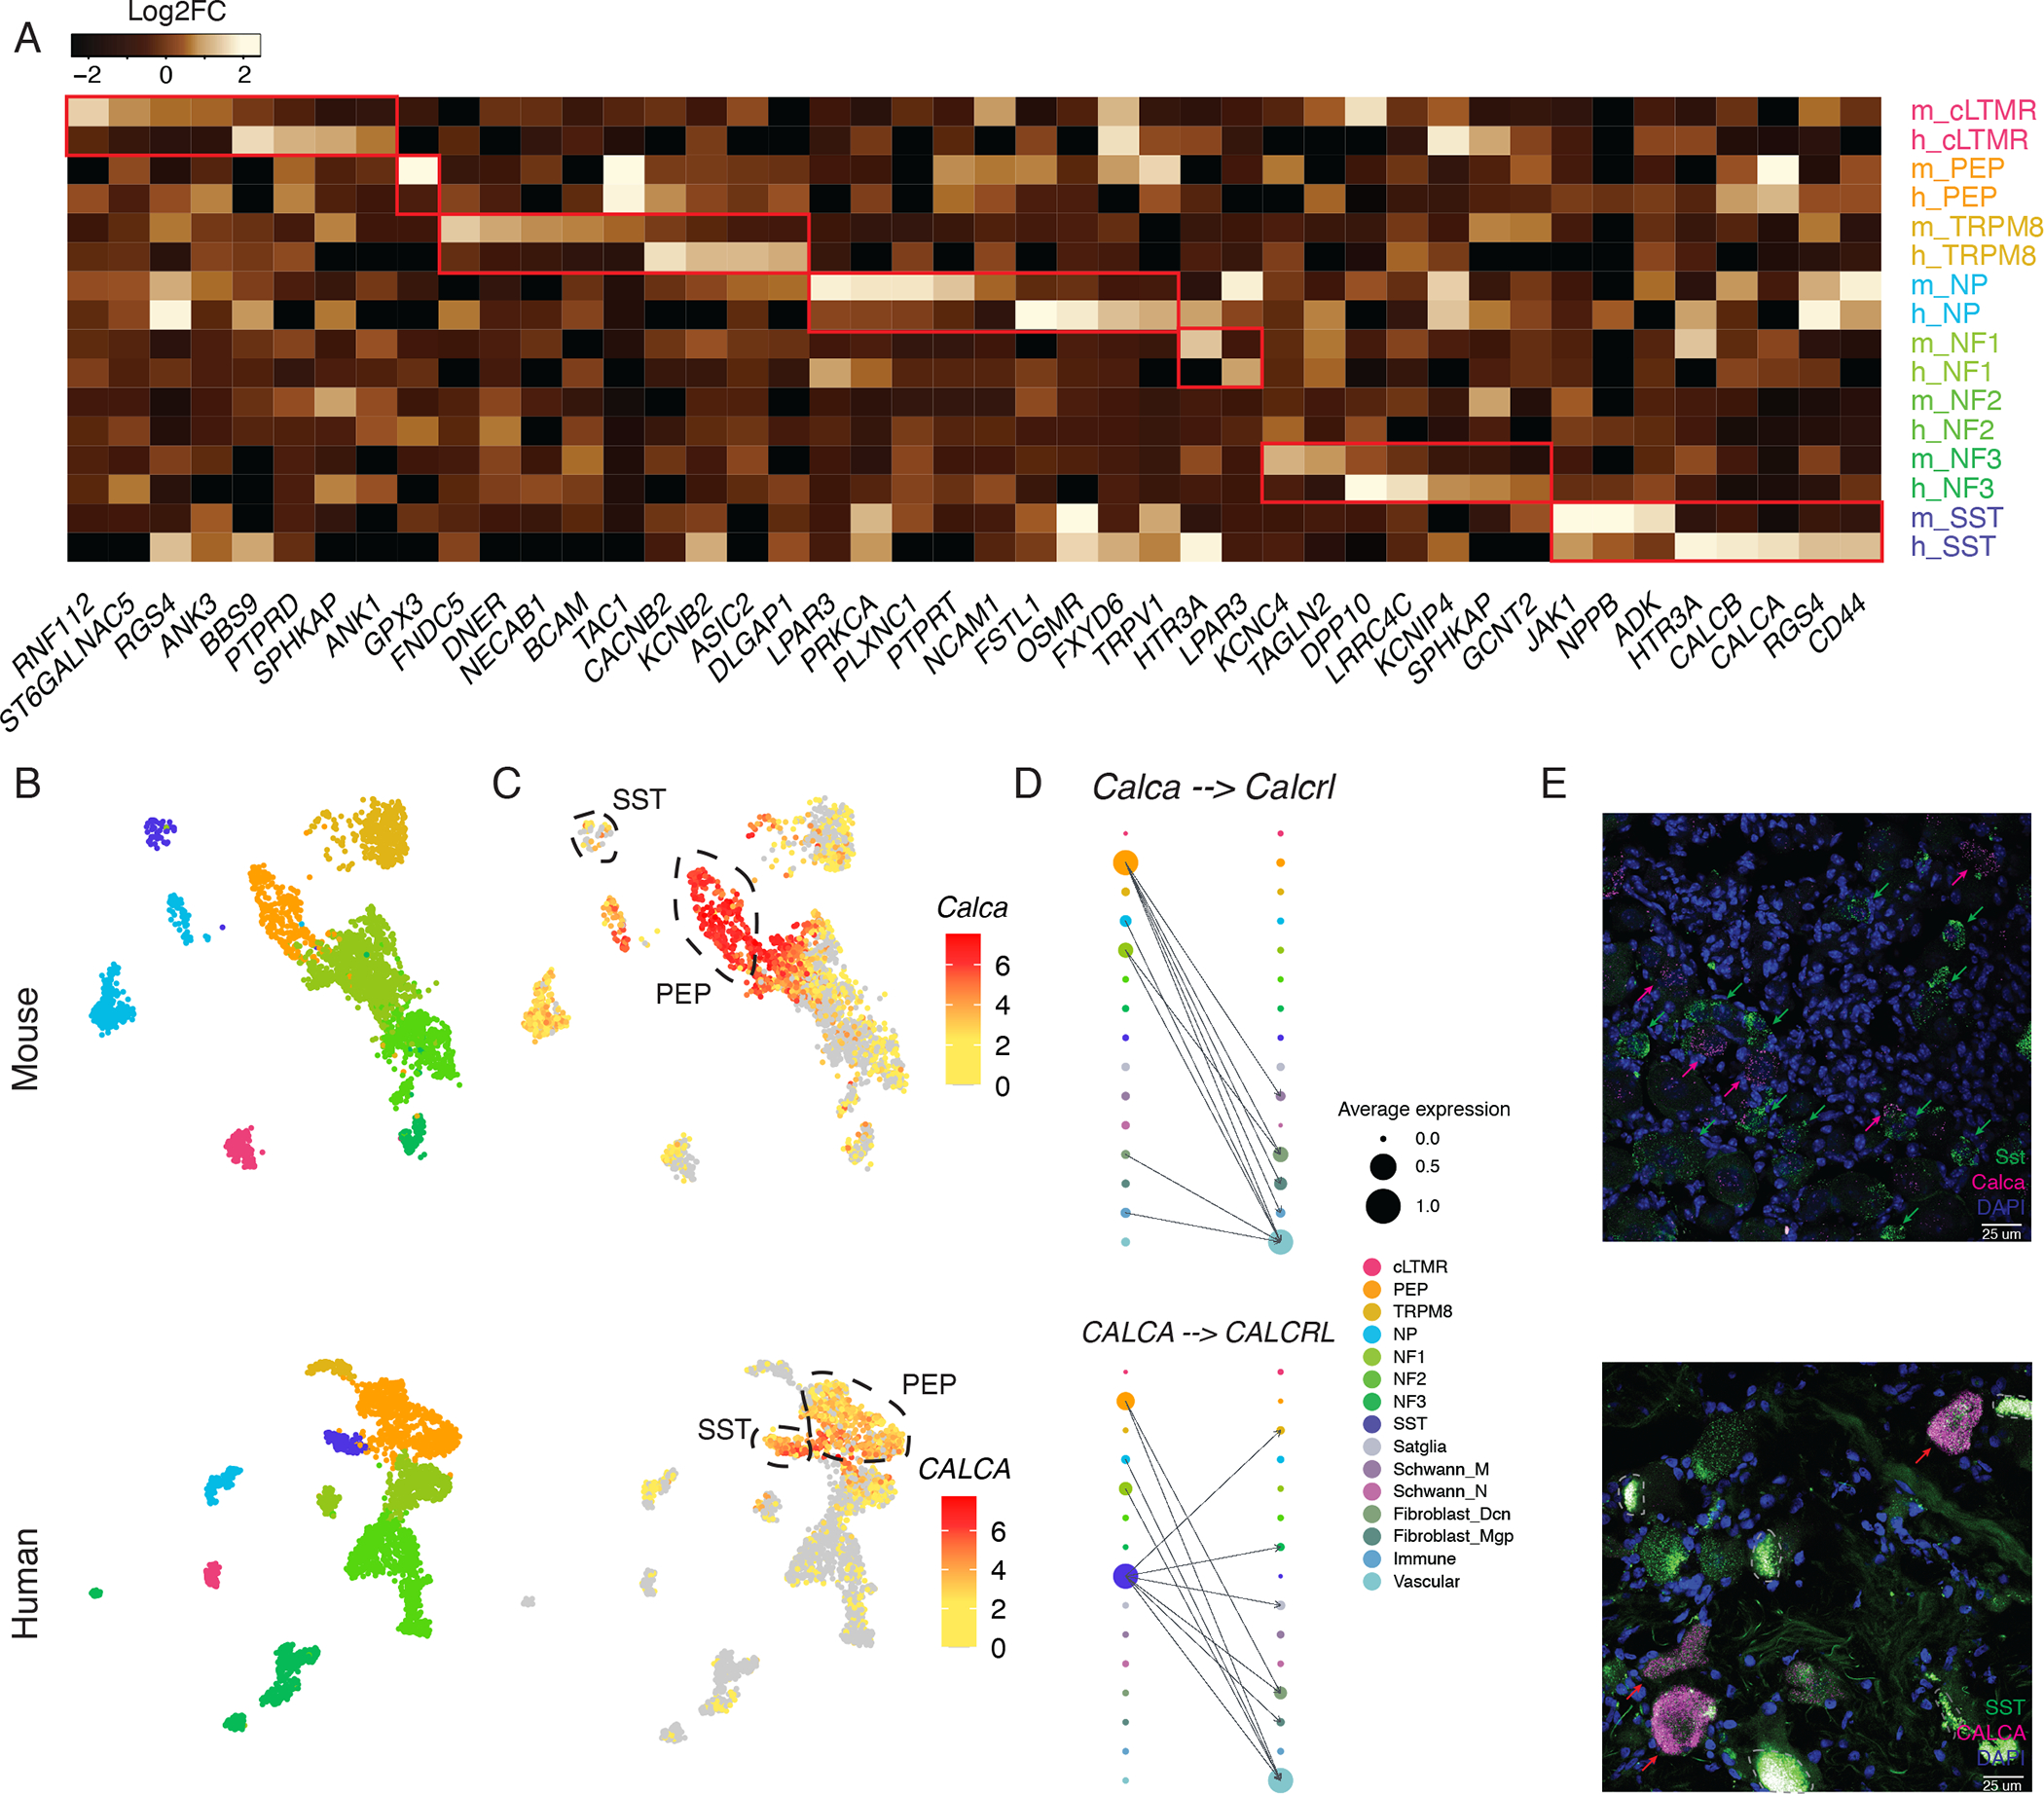
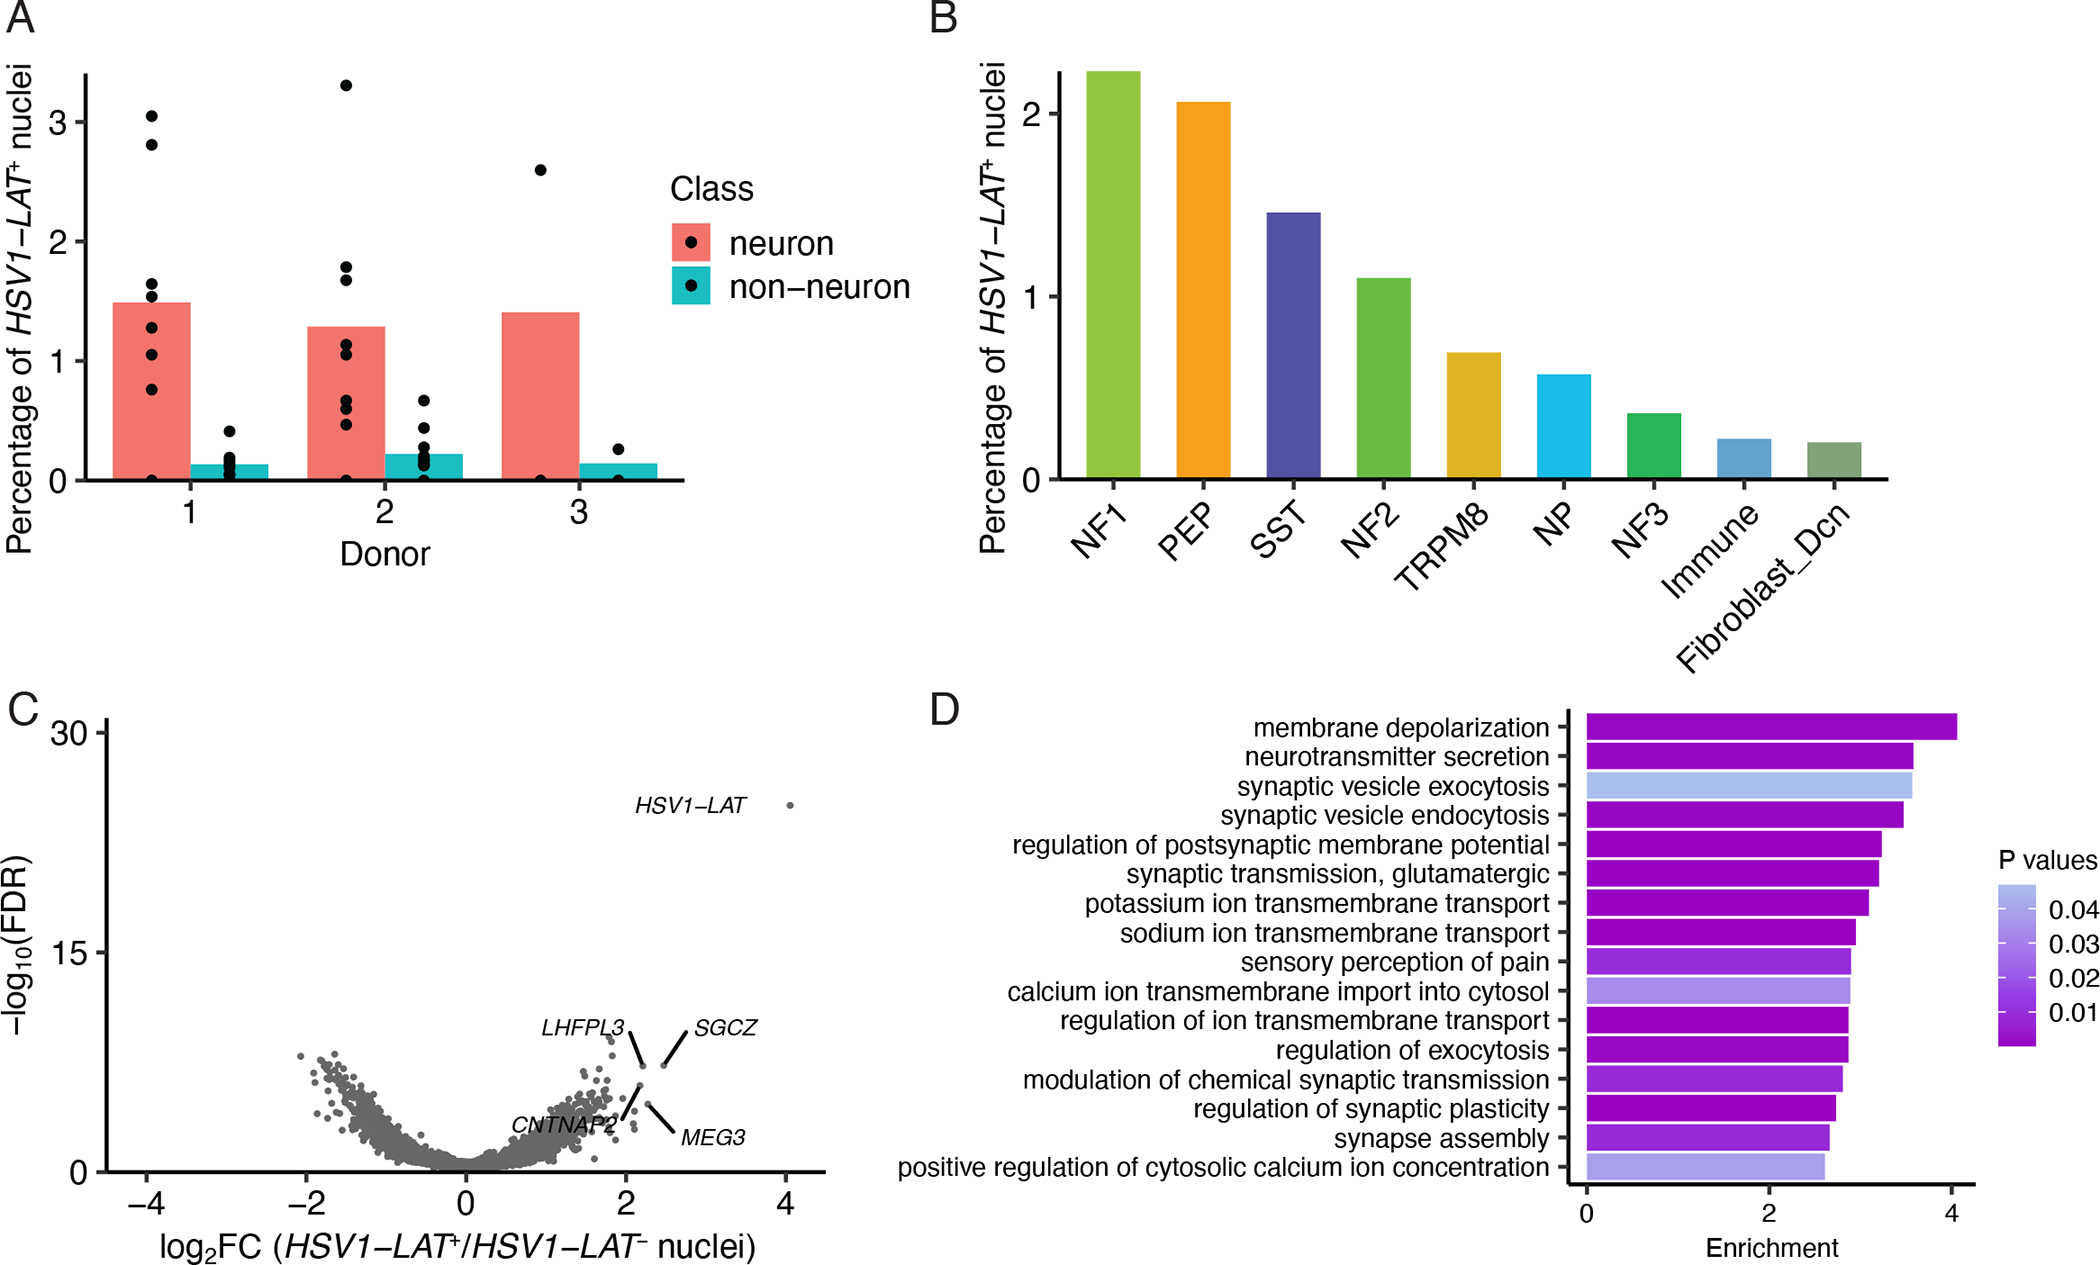
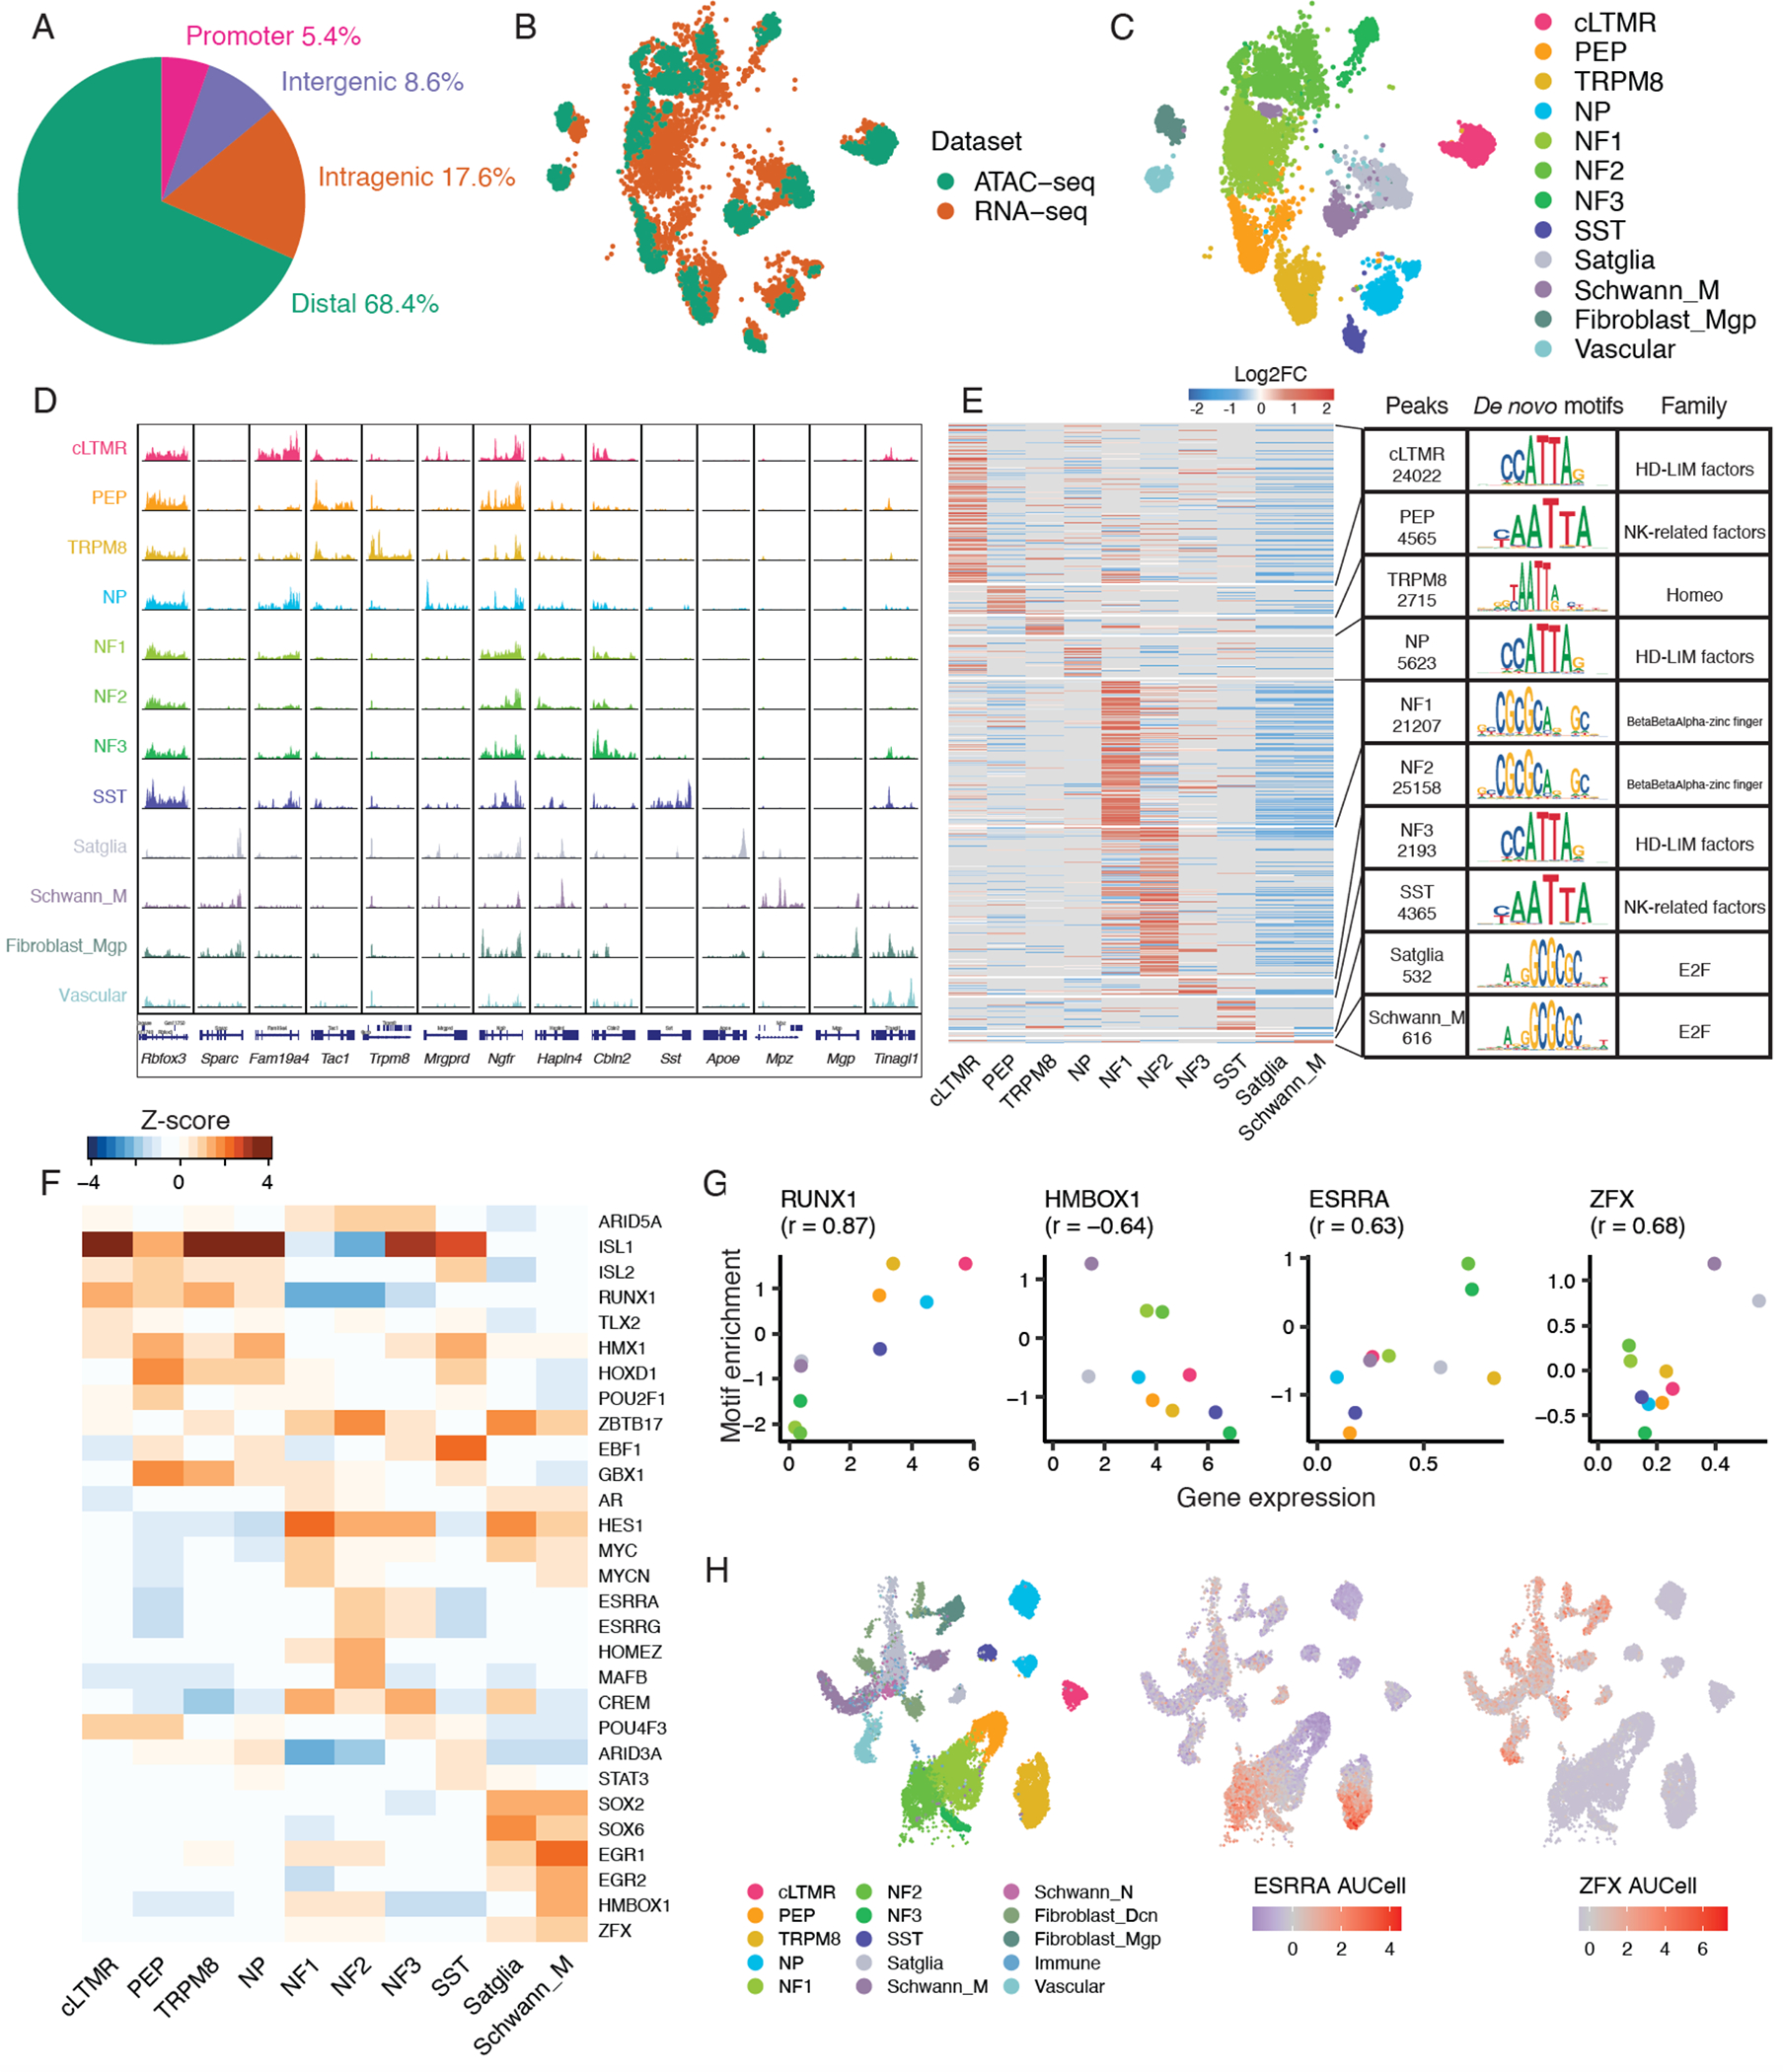
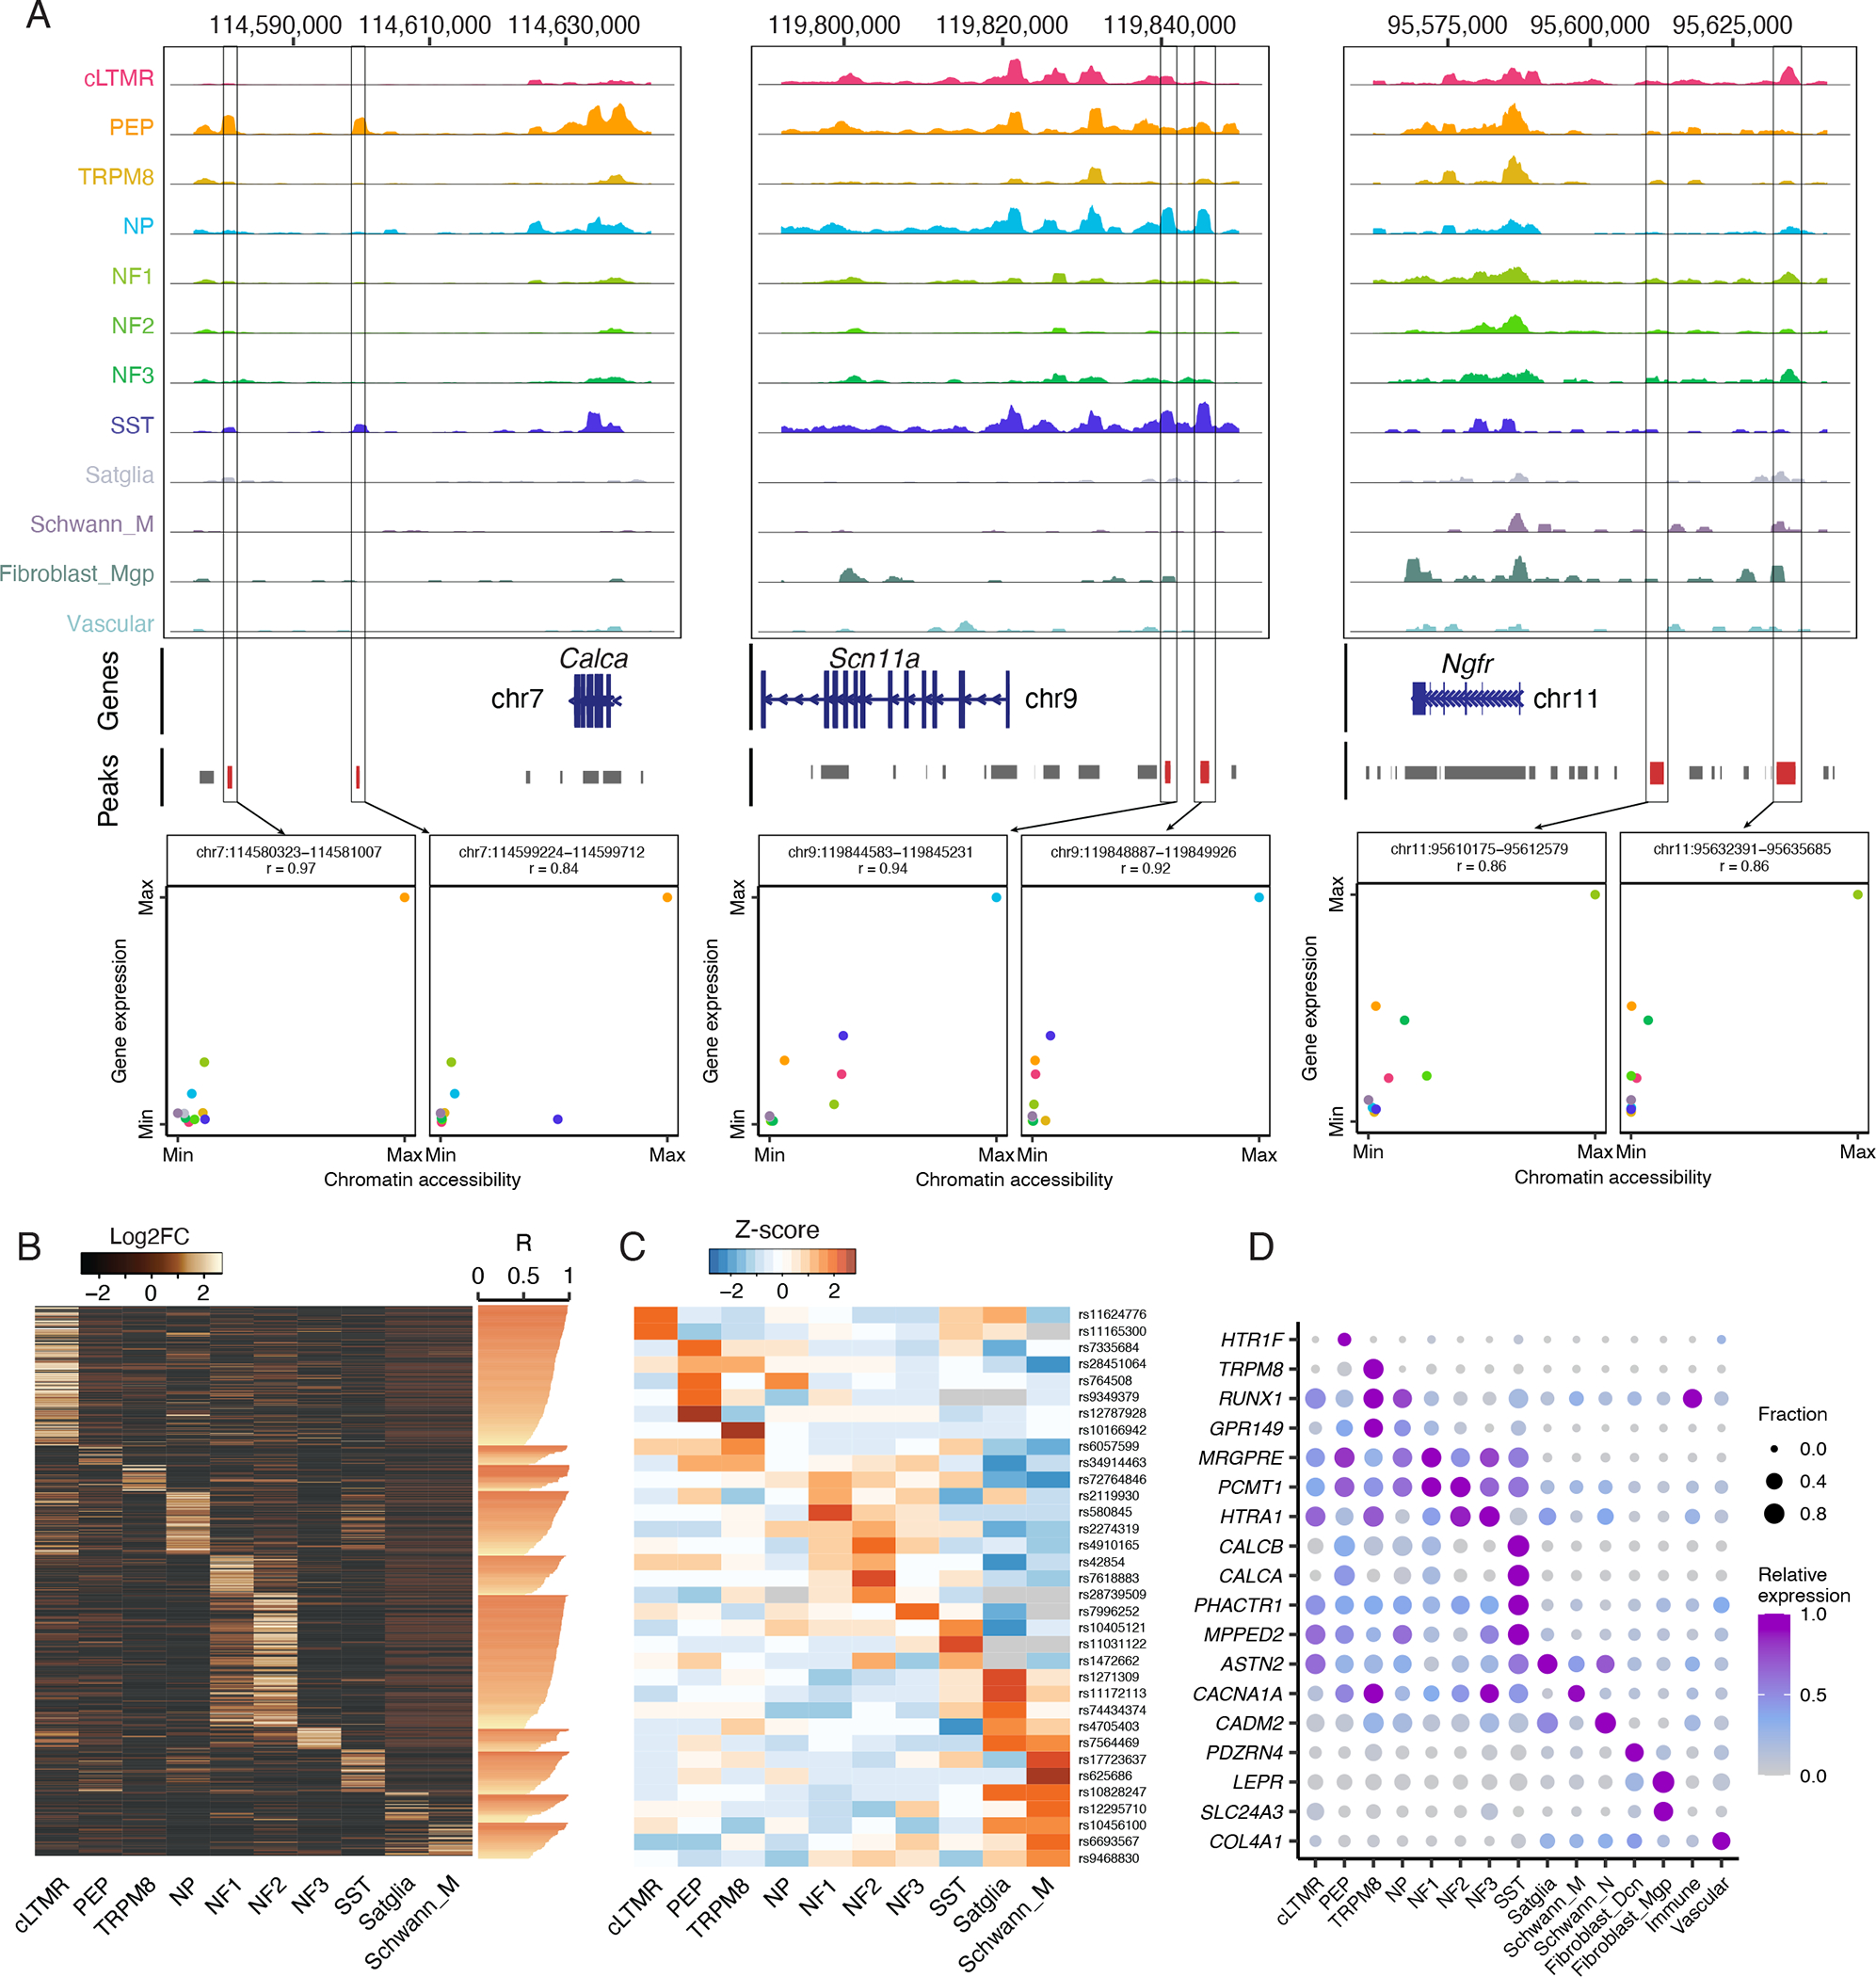
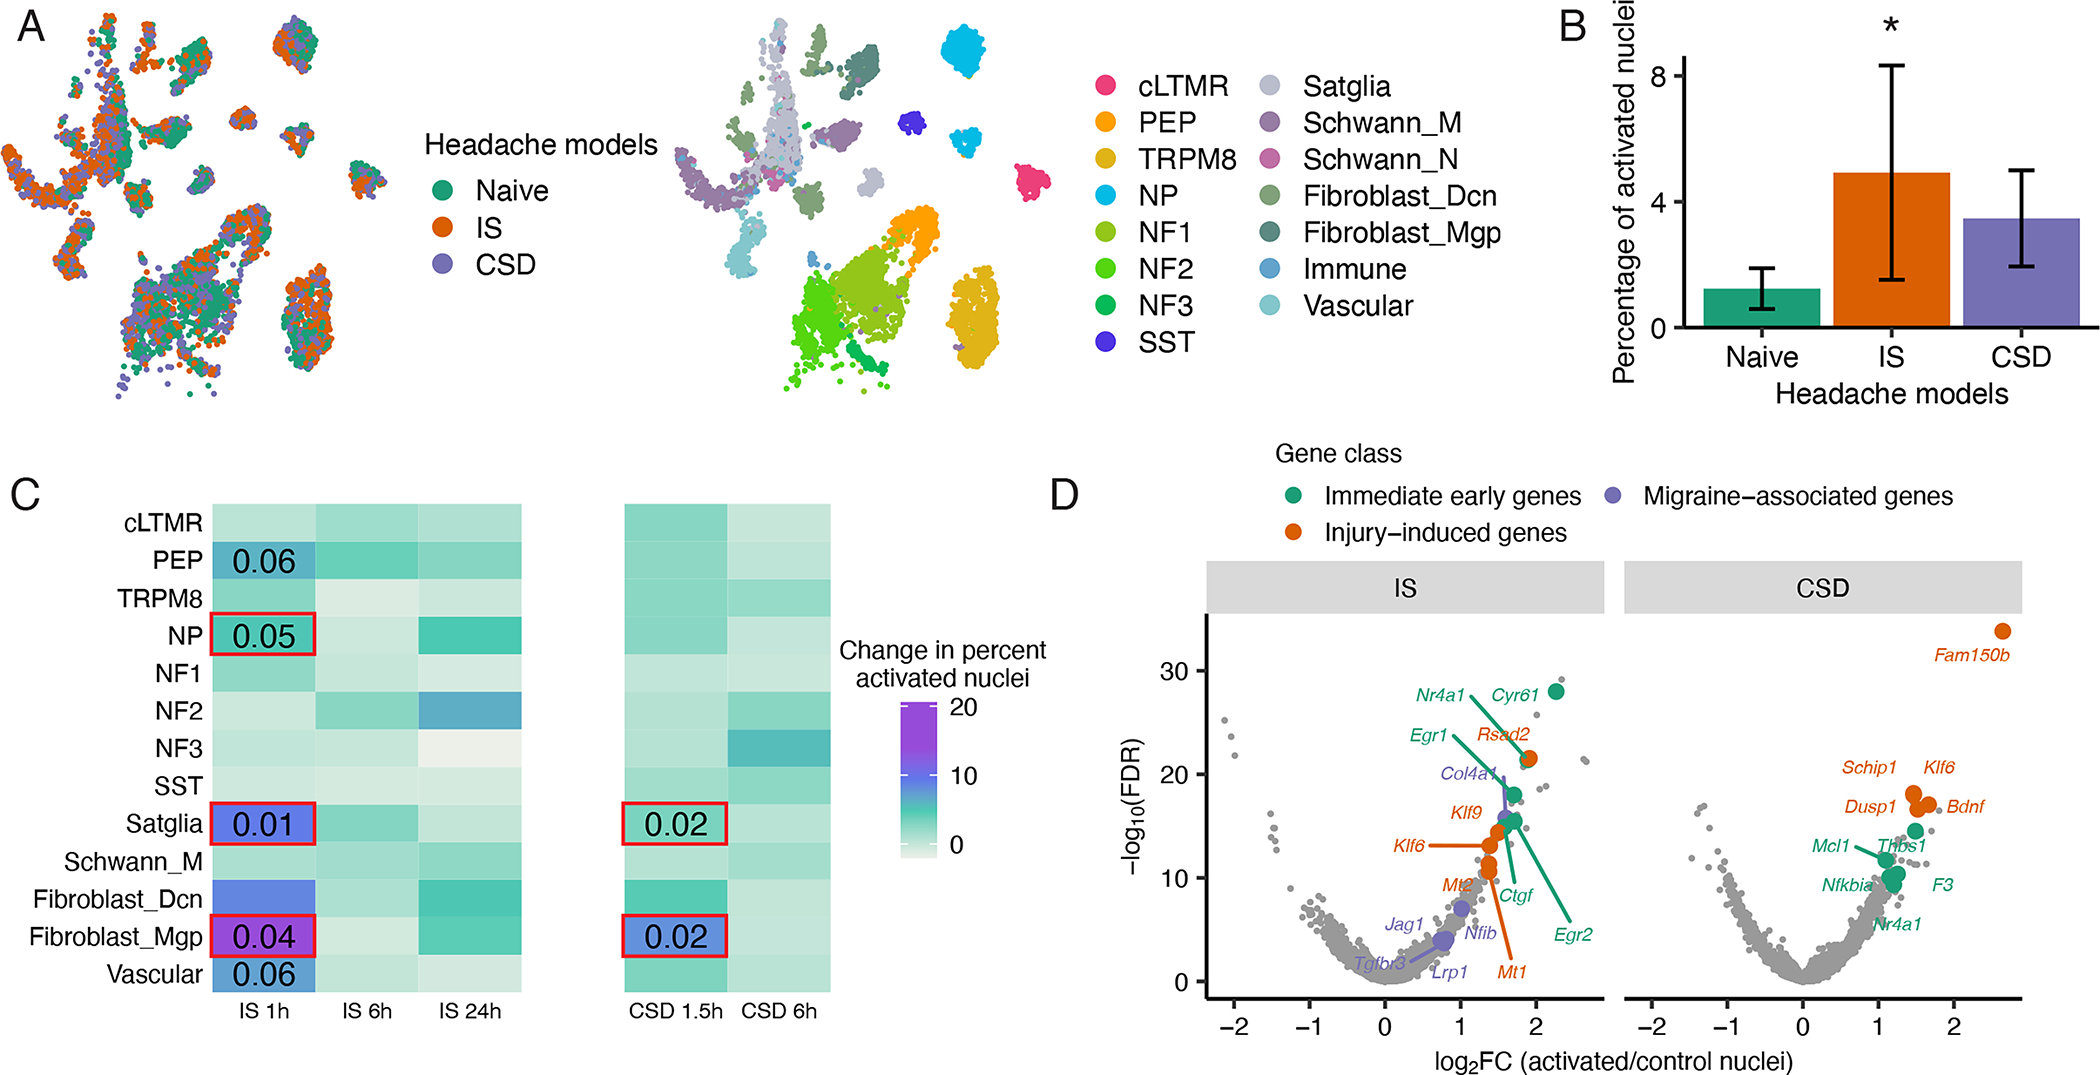
Sensitization of trigeminal ganglion neurons contributes to primary headache disorders such as migraine, but the specific neuronal and non-neuronal trigeminal subtypes that are involved remain unclear. We thus developed a cell atlas in which human and mouse trigeminal ganglia are transcriptionally and epigenomically profiled at single-cell resolution. These data describe evolutionarily conserved and human-specific gene expression patterns within each trigeminal ganglion cell type, as well as the transcription factors and gene regulatory elements that contribute to cell-type-specific gene expression. We then leveraged these data to identify trigeminal ganglion cell types that are implicated both by human genetic variation associated with migraine and two mouse models of headache. This trigeminal ganglion cell atlas improves our understanding of the cell types, genes, and epigenomic features involved in headache pathophysiology and establishes a rich resource of cell-type-specific molecular features to guide the development of more selective treatments for headache and facial pain.

Keywords: epigenomics; facial pain; gene regulation; headache; migraine; single-cell genomics; trigeminal ganglion.


Conflict of interest statement

Declaration of interests W.R. receives research funding from Teva Pharmaceuticals and is on an AbbVie scientific advisory board.

Figures

Figure 1.
Figure 1.. snRNA-seq of human and mouse trigeminal ganglion
A. UMAP plot of snRNA-seq data from 59,921 mouse TG nuclei from 14 biological replicates, downsampled to display 28,000 nuclei, 2,000 per replicate (14,984 neuronal, 13,016 non-neuronal). UMAP of neuronal nuclei clustered independently is shown in the figure inset. Colors represent cell types. B. UMAP plot of snRNA-seq data from 38,028 human TG nuclei from three donors, downsampled to display 15,000 nuclei, 5,000 per donor (1,487 neuronal, 13,513 non-neuronal). UMAP of neuronal nuclei clustered independently is shown in the figure inset. Colors represent cell types. C. Dot plot displaying the expression of select cell-type-specific marker genes (columns) in male mice, female mice, or human TG cell types (rows). Dot size denotes the fraction of nuclei expressing a marker gene (>0 counts), and color denotes relative expression of a gene in each cell type (calculated as the mean expression of a gene relative to the highest mean expression of that gene across all cell types in the respective species and sex). Cell types with < 30 cells are not displayed. cLTMR = c-fiber low threshold mechanoreceptor (LTMR); PEP = peptidergic nociceptor; TRPM8 = TRPM8+ cold sensitive neuron; NP = non-peptidergic nociceptor; NF1 = neurofilament+ A-LTMR enriched for A-beta-Field; NF2 = neurofilament+ A-LTMR enriched for A-beta-RA and A-beta-Field; NF3 = neurofilament+ LTMR enriched for A-delta; SST = somatostatin-positive pruriceptors; Satglia = satellite glia; Schwann_M = myelinating Schwann cells; Schwann_N = non-myelinating Schwann cells; Fibroblast_Dcn = Dcn+ meningeal fibroblasts; Fibroblast_Mgp = Mgp+ meningeal fibroblast; Immune = leukocytes; Vascular = endothelial cells.
Figure 2.
Figure 2.. Evolutionary conservation of mouse and human TG cell types
A-B. UMAP plots of human TG snRNA-seq data anchored to the mouse TG snRNA-seq data (see methods). Each species is downsampled to display 5,000 nuclei. (A) Colors represent cell type classifications determined from clustering each species separately prior to anchoring (as in Figures 1A–B). (B) Colors represent species. C. Overlap of human TG cell types between the initial classifications (as in Figure 1B) and the classifications assigned by anchoring human TG to the male mouse TG reference (see methods). Plot displays fraction of nuclei within the initial cell type assignment that is assigned to each TG cell type after anchoring to the mouse TG reference. D. Heatmap of evolutionarily conserved cell-type-specific gene expression (columns) in mouse and human TG cell types (rows, m = mouse, h = human). Cell-type-specific genes in each species are included in the heatmap if they are significantly enriched in a cell type compared to all other cell types (FDR < 0.01, top 50 genes by log2FC per cell type, Table S2). E. Heatmap of select gene expression patterns (columns) in mouse and human TG cell types (rows, m = mouse, h = human). Genes are included in the heatmap if they are significantly enriched in a cell type compared to all other cell types (FDR < 0.05, log2FC > 0.5, Table S2). F. Ligand-receptor interactions in mouse and human TG. Left) Putative interactions between ligands and receptors within mouse (top row) and human (bottom row) TG cell types. Vertical bars are colored by cell type and the height of bars depict the number of ligands (left column) and receptors (right column) in the given cell type. The thickness of connecting lines is proportional to the number of total ligand-receptor interactions between the two connecting cell types. Right) Dot size denotes relative expression of a gene in each cell type, and colors indicate cell type. Arrows between cell types denote the 10 highest ligand-receptor scores (The full set of ligand-receptor pairs can be found in Table S3).
Figure 3.
Figure 3.. Species-specific features of TG cell types
A. Heatmap of human and mouse TG cell-type-specific genes. Genes (columns) are included in the heatmap if they are both significantly enriched in a cell type (rows, m = mouse, h = human) compared to all other cell types (FDR < 0.01, log2FC > 1, see Table S3) and expressed significantly more in either human or in mouse (FDR < 0.01, top 5 genes by log2FC between human and mouse). B-C. UMAP plots of snRNA-seq data of 3,000 nuclei downsampled from 15,303 TG neurons (top) or 3,000 nuclei downsampled from 3,873 human (bottom) TG neurons. B). Nuclei are colored by cell type (same colors as in Figure 3A). C). Nuclei are colored by log2 expression of Calca/CALCA. Peptidergic nociceptors (PEP) and Sst-expressing pruriceptors (SST) are circled. D. Ligand-receptor interactions in mouse (top) and human (bottom) TG cell types. The dot size denotes relative expression of a gene in each cell type, and the color indicates cell type. Arrows between cell types denote the 10 highest ligand-receptor scores (The full set of ligand-receptor pairs can be found in Table S3). E. Florescent in situ hybridization images of mouse TG (top) and human TG (donor 3, bottom) stained with probes against Sst/SST (magenta) and Calca/CALCA (green). Magenta arrows point to examples of human SST neurons that co-express CALCA (bottom) or mouse SST neurons that do not co-express Calca (top). Lipofuscin is circled by grey dotted lines in human slides. Scale bars = 25μm.
Figure 4.
Figure 4.. Latent alphaherpes virus expression in human TG neurons
A. Percentage of HSV1_LAT+ neurons or non-neuronal cells in each donor. Dots show percentage of HSV1_LAT+ nuclei in each library and bars indicate the average across libraries. B. Percentage of each neuronal subtype that are HSV1_LAT+ across all donors. C. Volcano plot displaying differential gene expression between HSV1_LAT+ and HSV1_LAT- nuclei. HSV1-LAT (n = 115) and the same number of randomly selected cells of the same cell type distribution without detectable expression of HSV1_LAT. Significance is displayed on the Y-axis as -log10 False Discovery Rate (FDR); magnitude of differences is displayed on X-axis as log2 Fold Change (FC). D. Gene ontology analysis of differentially expressed genes (Log2FC > 1, FDR < 0.05) between HSV1_LAT+ and HSV1_LAT- nuclei. Enrichment is the number of times an ontology term is observed in the differentially expressed gene set over a random gene set of expressed genes. Bar shows enrichment and color shows P-value.
Figure 5.
Figure 5.. Single-nucleus epigenomic analysis of mouse trigeminal ganglion
A. Fraction of peaks in snATAC-seq data that map to promoter regions (−1,000bp to +100bp of transcription start site [TSS]), intragenic regions (within gene body excluding promoter region), distal regions (<200 kb upstream or downstream of TSS excluding promoter and intragenic regions), and intergenic regions (>200kb upstream or downstream of TSS) across 3 biological replicates of Vglut2-cre;Sun1-GFP+ TG nuclei. B-C. UMAP plots of 3,519 mouse TG nuclei profiled by snATAC-seq anchored to 5,584 male naive mouse TG nuclei profiled by snRNA-seq. Nuclei are colored by B) single-nucleus profiling technique or C) cell type classification. Cell types that are present in snRNA-seq data but not in snATAC-seq data are not shown. D. For each TG cell type (rows), chromatin accessibility is displayed at cell-type-specific genes (columns). snATAC-seq data is displayed as the average frequency of sequenced DNA fragments per cell for each cell type, grouped by 50 bins per displayed genomic region; Y-axis is scaled for each gene (column). E. Differential chromatin accessibility analysis of 90,996 cell-type-specific peaks in each TG cell type compared to all other TG cell types (Log2FC > 0.5, FDR < 0.05, Table S8). Heatmap displays log2FC for each peak (rows) in the respective TG cell type (columns). Transcription factor (TF) DNA binding motifs that are most significantly enriched within each cell type’s differentially accessible peaks (Log2FC > 0, FDR < 0.05) compared to randomly selected peaks (Table S9) are shown. The most enriched motif and its TF family are displayed for each cell type. Cell types with ≤ 500 differentially accessible peaks are not shown. F. Heatmap of TFs whose DNA binding motifs are significantly enriched (Log2FC > 0, FDR < 0.05) within each cell type’s differentially accessible peaks compared to randomly selected peaks (see methods). Top 5 TFs by motif enrichment per cell type are included in the heatmap. Heatmap shows the Z-score (column-scaled) of motif fold enrichment. G. Scatter plots of average normalized expression of cell-type-specific TF mRNA and its TF motif fold enrichment (Z-score as in Figure 5F) in each mouse TG cell type. Pearson’s r between gene expression and motif enrichment in each cell type is displayed. H. UMAP plots of 59,921 naive mouse TG nuclei profiled by snRNA-seq downsampled to display 28,000 nuclei (as in Figure 1A). Nuclei are colored by cell type (left) or by AUCell regulon scores of ESRRA (middle) and ZFX (right) using SCENIC (see methods).
Figure 6:
Figure 6:. Gene regulatory mechanisms in distinct trigeminal ganglion cell types
A. Chromatin accessibility is displayed at the genomic loci of Calca, Scn11a, or Ngfr. At each genomic locus, chromatin accessibility is displayed as the average fraction of transposase-sensitive fragments per nucleus at that region (grouped by 50 bins per displayed genomic region). Accessibility at each locus (Y-axis) is scaled to the max value across all cell types (column). Peaks are annotated as grey bars and differentially accessible peaks are colored red. Scatter plot shows the correlation of their chromatin accessibility of a given snATAC-seq peak and expression of a nearby gene in each cell type (chromatin accessibility and gene expression are normalized to their max values). Colors indicate cell types. B. Heatmap displays Log2FC of 1,080 cell-type-specific snATAC-seq peaks (rows, Log2FC > 0.5, FDR < 0.05) whose chromatin accessibility is highly correlated (Pearson’s r > 0.5, values are displayed as horizontal bars) with the expression of cell-type-specific genes (Log2FC > 1, FDR < 0.05, comparing gene expression in one TG cell type to all other cell types) in the respective cell type. These peaks are positioned within 200 kb upstream of the respective cell-type-specific gene’s TSS and are associated with its regulation by ABC score. C. Migraine-associated genomic variants exhibit preferential chromatin accessibility within distinct TG cell types. Heatmap displays the Z-score (row scaled) of the fraction per nucleus of transposase-sensitive fragments that overlap with a 1 kb window around the genomic locus that corresponds to migraine-associated genomic variants (rows). D. Dot plot displays the expression of migraine-associated genes (rows) in human TG cell types (columns) as measured by snRNA-seq. Dot size denotes the fraction of nuclei expressing a marker gene (>0 counts), and color denotes relative expression of a gene in each cell type.
Figure 7.
Figure 7.. Activation of multiple TG cell types in mouse models of headache
A. UMAP plots of snRNA-seq data from 96,933 mouse TG nuclei from both naive and headache models (downsampled to display 3,000 naive, 3,000 IS, and 3,000 CSD). Nuclei are colored by condition (left) or by cell type (right). B. Fraction of nuclei in each headache model that display a transcriptionally activated state after IS or CSD as defined by the expression of a panel of immediate early genes (IEG) (see Act-seq methods). There are significantly more transcriptionally activated nuclei after IS than in naive (*P < 0.05, two-tailed Student’s t-test, error bars are SEM). C. Heatmap showing change in percentage of transcriptionally activated nuclei in each TG cell type after IS or CSD compared naive. Significant effects of IS were observed in NP, satellite glia and fibroblasts (*P < 0.05 1-way ANOVA, see Figure S6C for ANOVA statistics); strong trends were observed in PEP and vascular cells. Significant effects of CSD were observed in satellite glia and fibroblasts (*P < 0.05, 1-way ANOVA, see Figure S6D for ANOVA statistics). D. Volcano plot of differentially expressed genes between transcriptionally activated nuclei in Left) IS or Right) CSD and the same number of randomly selected control cells of the same cell type distribution. Significance is displayed on the Y-axis as -log10 False Discovery Rate (FDR); magnitude of gene expression differences is displayed on X-axis as log2 Fold Change (FC). Top five genes by log2FC in each gene class are labeled. Immediate early genes (IEGs) are orange, genes that are activated by axonal injury (see methods) are green, and migraine-associated genes are purple.

Comment in

References

    1. Aibar S, Gonzalez-Blas CB, Moerman T, Huynh-Thu VA, Imrichova H, Hulselmans G, Rambow F, Marine JC, Geurts P, Aerts J, et al. (2017). SCENIC: single-cell regulatory network inference and clustering. Nat Methods 14, 1083–1086. - PMC - PubMed
    1. Akerman S, Holland PR, and Goadsby PJ (2011). Diencephalic and brainstem mechanisms in migraine. Nat Rev Neurosci 12, 570–584. - PubMed
    1. Ashina M, Hansen JM, Do TP, Melo-Carrillo A, Burstein R, and Moskowitz MA (2019). Migraine and the trigeminovascular system-40 years and counting. Lancet Neurol 18, 795–804. - PMC - PubMed
    1. Avona A, Mason BN, Burgos-Vega C, Hovhannisyan AH, Belugin SN, Mecklenburg J, Goffin V, Wajahat N, Price TJ, Akopian AN, et al. (2021). Meningeal CGRP-Prolactin Interaction Evokes Female-Specific Migraine Behavior. Ann Neurol 89, 1129–1144. - PMC - PubMed
    1. Bolay H, Reuter U, Dunn AK, Huang Z, Boas DA, and Moskowitz MA (2002). Intrinsic brain activity triggers trigeminal meningeal afferents in a migraine model. Nat Med 8, 136–142. - PubMed

Publication types