. 2022 May 9;32(9):1961-1973.e4.
doi: 10.1016/j.cub.2022.03.018. Epub 2022 Mar 28.

The cellular slime mold Fonticula alba forms a dynamic, multicellular collective while feeding on bacteria

Affiliations

The cellular slime mold Fonticula alba forms a dynamic, multicellular collective while feeding on bacteria

Christopher Toret et al. Curr Biol. .

Abstract

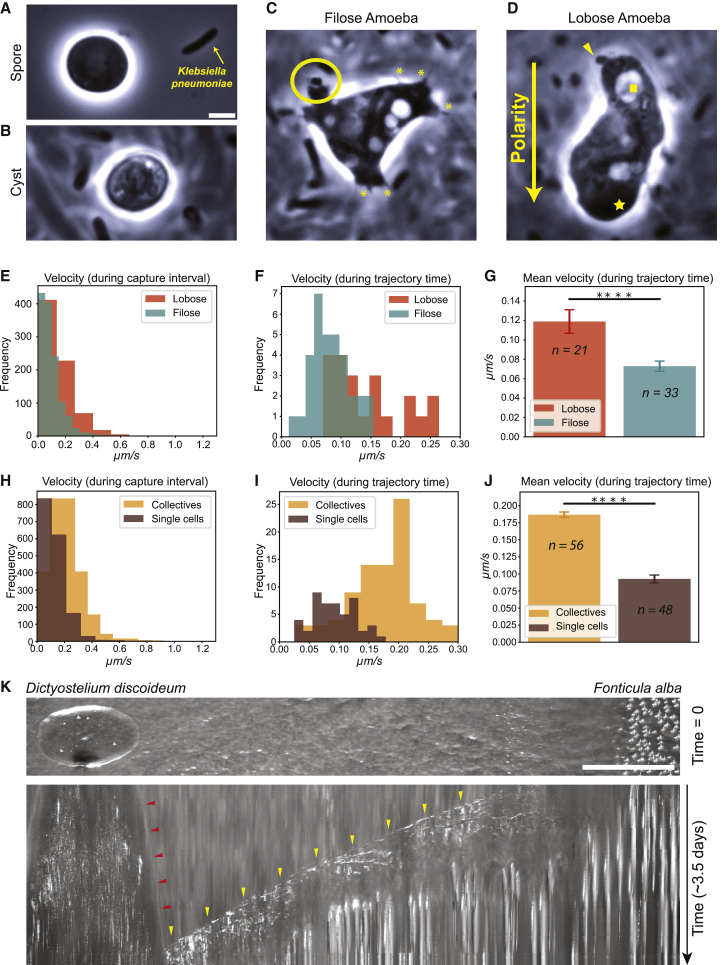
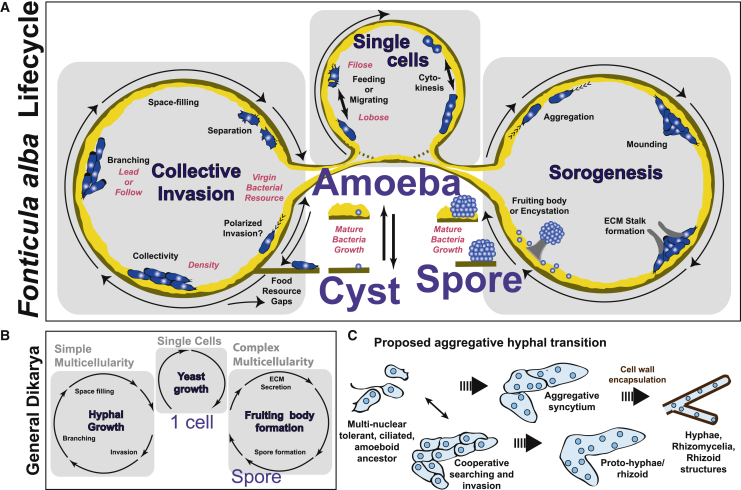
Multicellularity evolved in fungi and animals, or the opisthokonts, from their common amoeboflagellate ancestor but resulted in strikingly distinct cellular organizations. The origins of this multicellularity divergence are not known. The stark mechanistic differences that underlie the two groups and the lack of information about ancestral cellular organizations limits progress in this field. We discovered a new type of invasive multicellular behavior in Fonticula alba, a unique species in the opisthokont tree, which has a simple, bacteria-feeding sorocarpic amoeba lifestyle. This invasive multicellularity follows germination dependent on the bacterial culture state, after which amoebae coalesce to form dynamic collectives that invade virgin bacterial resources. This bacteria-dependent social behavior emerges from amoeba density and allows for rapid and directed invasion. The motile collectives have animal-like properties but also hyphal-like search and invasive behavior. These surprising findings enrich the diverse multicellularities present within the opisthokont lineage and offer a new perspective on fungal origins.

Keywords: amoeba; bacterial death phase; collective invasion; emerging models; evolutionary cell biology; multicellularity; opisthokonta; protist; slime mold.


Conflict of interest statement

Declaration of interests The authors declare no competing interests.

Figures

Figure 1
Figure 1
F. alba invades virgin bacterial sources collectively (A) Tree approximating F. alba location in eukaryotic evolution (for a more detailed tree, see Galindo et al. and Brown et al.19). (B) Schematic of the known life cycle of F. alba. (C) Macro photograph of an F. alba colony radius growing on a plate; original sorocarp was placed left, and invasion into the bacterial resource is rightward (arrow marks the colony front). Scale bars, 1 mm. (D) Montage cell organization at the invasion front over time. Scale bars, 100 μm. (E) Maximal intensity z stack of a confocal section of a phalloidin-stained collective at the colony front. Colored boxes show enlarged single planes of individual cell-cell contacts of corresponding colored regions. Scale bars, 5 μm. (F) SEM region of two cell-cell interfaces (yellow arrowheads) present at the colony front. Scale bars, 5 μm. See also Figures S1 and S2, and Videos S1 and S2.
Figure 2
Figure 2
Invasive collectives use a leader-follower organization (A) Brightfield images of a single invasive collective at the front over time. The yellow circle indicates an individual cell escaping the collective and yellow arrows indicate single cell tips. (B) Median filter of images shown in (A) to digitally enhance contrast. (C) Image of two cells migrating together over time with a leader cell (yellow arrow). Right panel shows temporal trajectories overlaid on the last capture. (D) Montage of a collective over time which lacks a leader. Right panel shows temporal trajectories overlaid on the last capture. (E) Montage of video of individual invasive collectives upon optical tickling (marked by blue bar). Yellow arrowheads point in the direction of travel of the cells at the start and end of the video. Yellow “X” indicates the site of photobleach. (F) Quantification of post-tickling directions (n = 20). (G) Montage of video of individual invasive collectives upon optical tickling. Yellow circle indicates separated follower cell. All scale bars, 25 μm. See also Videos S3 and S4.
Figure 3
Figure 3
F. alba fruiting and invasive collectives are distinct (A) Three cropped regions from a radial section of an F. alba colony to show organization. Yellow circle is around one cyst. Scale bars, 50 μm. (B) Single plane from a ∼24-h macro photography video of an advancing invasion front and fruiting region. Scale bars, 5 mm. (C) Kymographs of invasion front (top) and fruiting front (bottom) from Video S3. Yellow arrowheads highlight the invasion front location over time. Dashed line shows the relative position of the fruiting front over time. (D) Brightfield image of an emerging fruit and surrounding cells (left). Inverted time projection of mound structure formation over 18.75 min (right). Scale bars, 100 μm. (E) Inverted brightfield images of a mature sorocarp, focused on the tip of the sorus (left) and base (right). Scale bars, 100 μm. See also Videos S5, S6, and S7.
Figure 4
Figure 4
F. alba collective behavior favors invasion migration (A) Phase contrast image of spore immediately after placing a sorocarp in fresh media. (B) Phase contrast image of a cyst 24 h after inoculation of fresh media. (C and D) Phase contrast images of amoeba 24 h after inoculation into a 3-day-old culture of K. pneumonia. (A–D) Scale bars, 1 μm. (E) The velocity of lobose and filose amoebae during the exposure time interval (5 s). (F) The velocity of lobose and filose amoebae during the trajectory time, which is the time interval spanning the trajectory lengths. (G) Mean velocities of lobose and filose amoebae. p < 0.0001. (H) The velocity of single cells and collectives during the exposure time intervals (5 s). (I) The velocity of single cells and collectives during the trajectory time. (J) Mean velocities of single cells and collectives. p < 0.0001. (K) (Top panel: still image showing t = 0 of D. discoideum and F. alba colonies from Video S9. Scale bars, 5 mm. Bottom panel: kymograph from Video S9 with D. discoideum front advancement indicated by red arrowheads and F. alba front advancement by yellow arrowheads. (F, G, I, and J) The n values in (G and J) are the number of velocity data points during the trajectory time and also correspond to the respective histogram plots in (F and I). See also Videos S8 and S9.
Figure 5
Figure 5
Invasive collectives are density- and bacteria-dependent (A) Single brightfield capture of sorocarp edges 5 h after placement on an aged K. pneumonia lawn. A single amoeba (purple) and spores (blue) are circled. (B) Plot of an F. alba colony featuring appearance over time in relation to starting spore density. (C) Video montage of an invasive collective as it encounters a bacteria colony-agar transition. (D) Video montage of individual F. alba cells on agar as they encounter an untouched bacterial colony. Scale bars, 25 μm. See also Videos S10 and S11.
Figure 6
Figure 6
F. alba cells divide in aged bacterial cultures (A) Phase contrast image of cell division in a 24-h F. alba culture in aged bacteria. (B) Enlarged view of white-boxed region of (A). Yellow arrows indicate the membrane tube between cells. (C) Phase contrast image of a large cell division in a 24-h F. alba culture in aged bacteria. Yellow “x” indicates a small cell, yellow “y” indicates a large cell before division, and yellow “a,” b,” and “c” indicate daughter cells and are faded upon merging. (D) Enlarged view of white-boxed region of (C). Yellow arrows indicate the membrane tube. (E) Quantification of the percent of cell division events based on progeny from 10 fields of ∼50–100 cells imaged for 30 min. (F) Fixed cells stained with Hoescht. Yellow arrows indicate nuclei. (A, C, and E) Scale bars, (A and C) 10 μm, (E) 5 μm. See also Video S12.
Figure 7
Figure 7
Life cycle schematics (A) Detailed F. alba life cycle schematic with K. pneumonia associations. (B) Life cycle of a stereotypic fungi in the dikarya clade. (C) Proposed aggregative route for the origin of fungal hyphae.

Comment in

References

    1. Niklas K.J., Newman S.A. The origins of multicellular organisms. Evol. Dev. 2013;15:41–52. - PubMed
    1. Rokas A. The origins of multicellularity and the early history of the genetic toolkit for animal development. Annu. Rev. Genet. 2008;42:235–251. - PubMed
    1. Knoll A.H. The multiple origins of complex multicellularity. Annu. Rev. Earth Planet. Sci. 2011;39:217–239.
    1. Nagy L.G., Kovács G.M., Krizsán K. Complex multicellularity in fungi: evolutionary convergence, single origin, or both? Biol. Rev. Camb. Philos. Soc. 2018;93:1778–1794. - PubMed
    1. Brunet T., King N. The origin of animal multicellularity and cell differentiation. Dev. Cell. 2017;43:124–140. - PMC - PubMed

Publication types

LinkOut - more resources