Observational Study
. 2022 Apr:78:103967.
doi: 10.1016/j.ebiom.2022.103967. Epub 2022 Mar 27.

T cell response against SARS-CoV-2 persists after one year in patients surviving severe COVID-19

Affiliations
Observational Study

T cell response against SARS-CoV-2 persists after one year in patients surviving severe COVID-19

Fabienne Venet et al. EBioMedicine. 2022 Apr.

Abstract

Background: In critically ill COVID-19 patients, the initial response to SARS-CoV-2 infection is characterized by major immune dysfunctions. The capacity of these severe patients to mount a robust and persistent SARS-CoV-2 specific T cell response despite the presence of severe immune alterations during the ICU stay is unknown.

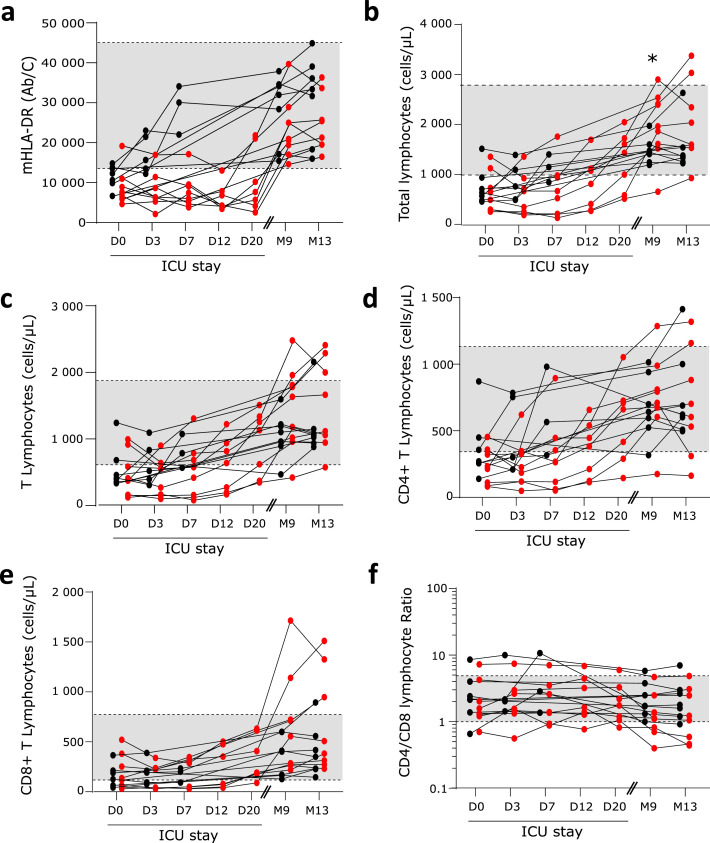
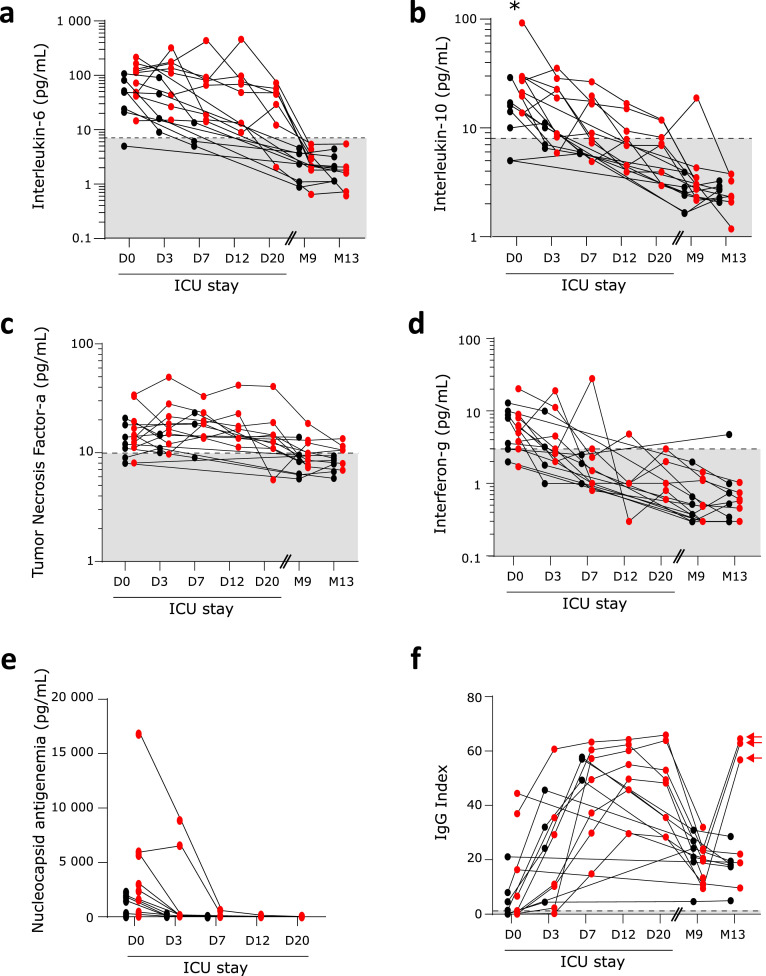
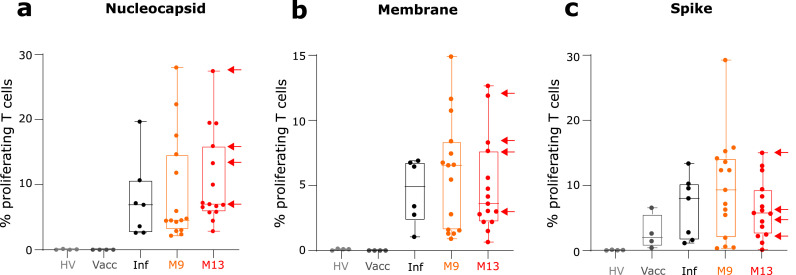
Methods: Critically ill COVID-19 patients were sampled five times during the ICU stay and 9 and 13 months afterwards. Immune monitoring included counts of lymphocyte subpopulations, HLA-DR expression on monocytes, plasma IL-6 and IL-10 concentrations, anti-SARS-CoV-2 IgG levels and T cell proliferation in response to three SARS-CoV-2 antigens.

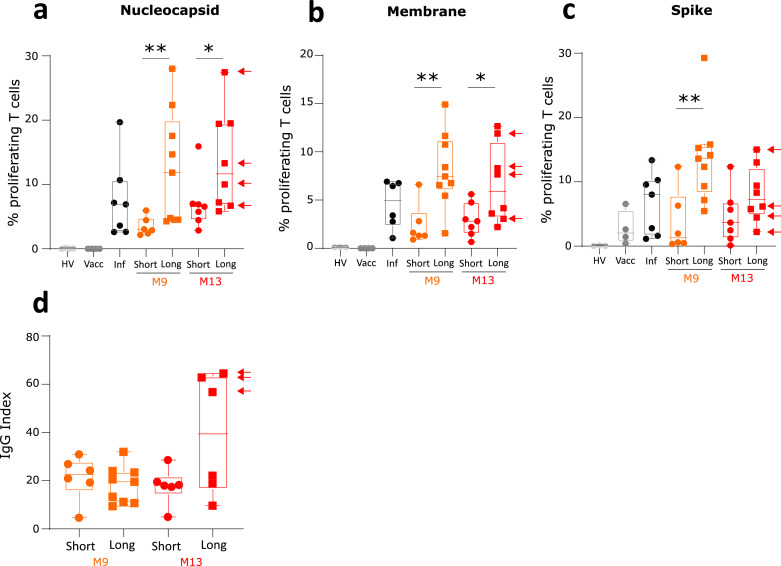
Findings: Despite the presence of major lymphopenia and decreased monocyte HLA-DR expression during the ICU stay, convalescent critically ill COVID-19 patients consistently generated adaptive and humoral immune responses against SARS-CoV-2 maintained for more than one year after hospital discharge. Patients with long hospital stays presented with stronger anti-SARS-CoV-2 specific T cell response but no difference in anti-SARS-CoV2 IgG levels.

Interpretation: Convalescent critically ill COVID-19 patients consistently generated a memory immune response against SARS-CoV-2 maintained for more than one year after hospital discharge. In recovered individuals, the intensity of SARS-CoV-2 specific T cell response was dependent on length of hospital stay.

Funding: This observational study was supported by funds from the Hospices Civils de Lyon, Fondation HCL, Claude Bernard Lyon 1 University and Région Auvergne Rhône-Alpes and by partial funding by REACTing (Research and ACTion targeting emerging infectious diseases) INSERM, France and a donation from Fondation AnBer (http://fondationanber.fr/).

Keywords: Critically ill patients; HLA-DR; Immune memory; SARS-CoV-2; Sepsis; T lymphocyte.


Conflict of interest statement

Declaration of interests MB, CT, KBG, VC and MAC are bioMérieux's employees. This private company had no role in the study design, result analysis and decision to publish this study. PV received consulting fees and payment for a literature review from Pfizer and Astellas. All other authors have declared no conflicts of interest.

Figures

Figure 1
Figure 1
Monitoring of COVID-19-induced cellular immune response. Sixteen convalescent critically ill COVID-19 patients were sampled 5 times during ICU stay: within the first 48 h after admission (Day 0: D0, n = 15), between 72 h and 96 h after admission (D3, n = 13), between D7 and D9 (D7, n = 11), between D12 and D15 (D12, n = 7), between D20 and D25 (D20, n = 7) and then twice at follow-up visits: after 9 and 13 months after hospital discharge (M9, n = 16; M13; n = 15). At each sampling time, the following immune parameters were monitored: a- monocytic expression of HLA-DR (mHLA-DR, numbers of antibodies bound per monocytes (Ab/C)), b- absolute counts of circulating lymphocytes (numbers of cells / µL), c- absolute count of CD3+ T lymphocytes (numbers of cells / µL), d- absolute count of CD4+ T cells (numbers of cells / µL), e- absolute count of CD8+ T cells (numbers of cells / µL) and f- ratio of numbers of CD4+ / CD8+ T cells. Results are presented as individual values. Patients with short hospital length of stay (HLS) are represented with black symbols; patients with long HLS with red symbols. Grey zones represent normal values from the routine Immunology Laboratory of Hospices Civils de Lyon for each immune parameter. At D0, M9 and M13, results were compared between patients with short and long HLS using non parametric Mann Whitney test. * p < 0.05.
Figure 2
Figure 2
Monitoring of COVID-19-induced plasmatic immune response. Sixteen convalescent critically ill COVID-19 patients were sampled 5 times during ICU stay: within the first 48 h after admission (Day 0: D0, n = 15), between 72 h and 96 h after admission (D3, n = 13), between D7 and D9 (D7, n = 11), between D12 and D15 (D12, n = 7), between D20 and D25 (D20, n = 7) and then twice at follow-up visits, i.e. after 9 and 13 months after hospital discharge (M9, n = 16; M13; n = 15). At each sampling time, the following immune parameters were monitored: a- plasmatic concentrations of interleukin-6 (pg/mL), b- plasmatic concentration of interleukin-10 (pg/mL), c- plasmatic concentration of tumor necrosis factor-α (pg/mL), d- plasmatic concentration of interferon-γ (pg/mL), e- plasmatic concentration of nucleoprotein antigen (pg/mL) and f- plasmatic levels of anti-SARS-CoV-2 immunoglobulin G (IgG Index). For this last parameter, results in vaccinated patients are identified by an arrow. To note, nucleoprotein levels were only measured during ICU stay as all patients tested negative for SARS-CoV-2 at M9 and M13 visits. Results are presented as individual values. Patients with short hospital length of stay (HLS) are represented with black symbols; patients with long HLS with red symbols. Grey zones represent normal values from the routine Immunology Laboratory of Hospices Civils de Lyon or from the manufacturer when available. At D0, M9 and M13, results were compared between patients with short and long HLS using non parametric Mann Whitney test. * p < 0.05.
Figure 3
Figure 3
Monitoring of SARS-CoV-2 specific T cell proliferation. Sixteen convalescent critically ill COVID-19 patients were sampled twice at follow-up visits (i.e. after 9 and 13 months after hospital discharge (M9, n = 16, orange symbols and boxes; M13; n = 15, red symbols and boxes; M13; n = 15). Fifteen healthy donors either non-infected and non-vaccinated (HV, n = 4, light grey symbols), or after full vaccination (Vacc, n = 4, dark grey symbols and boxes) or after resolution of a non-severe SARS-CoV-2 infection (Inf, n = 7, black symbols and boxes) were concomitantly included. At each sampling time, the percentage of T lymphocytes that had proliferated in response to 3 SARS-CoV-2 antigens (Nucleocapsid – Panel a, Membrane – Panel b, Spike – Panel c) was monitored. Results in vaccinated patients are identified by an arrow. Results are expressed as the percentage of proliferating T cells among total T cells and are presented as individual values and as Tukey Box-plots.
Figure 4
Figure 4
Monitoring of SARS-CoV-2 specific immune response in patients depending on hospital length of stay. Sixteen convalescent critically ill COVID-19 patients were sampled twice at follow-up visits (i.e. after 9 (M9, n = 16, orange symbols and boxes) and 13 months after hospital discharge (M13; n = 15, red symbols and boxes) and stratified according to length of hospital stay. Results obtained in patients with length of hospital stay inferior to 30 days (n = 7 patients, short, symbols = circles) and in patients with length of hospital stay superior to 30 days (n = 9 patients, Long, symbols = squares) are shown. Fifteen healthy donors either non-infected and non-vaccinated (HV, n = 4, light grey symbols), or after full vaccination (Vacc, n = 4, dark grey symbols and boxes) or after resolution of a non-severe SARS-CoV-2 infection (Inf, n = 7, black symbols and boxes) were concomitantly included. The percentages of T lymphocytes that had proliferated in response to 3 SARS-CoV-2 antigens (Nucleocapsid – Panel a, Membrane – Panel b, Spike –Panel c, expressed as percentages of proliferating T cells among total T cells) and the plasmatic concentrations of anti-SARS-CoV-2 IgG (IgG index – Panel d) were monitored. Results in vaccinated patients are identified by an arrow. Results are presented as individual values and as Tukey Box-plots. Comparison between the two groups of patients at each time point were performed using non parametric Mann Whitney test. * p < 0.05 ** p < 0.01.

References

    1. Osuchowski M.F., Winkler M.S., Skirecki T., et al. The COVID-19 puzzle: deciphering pathophysiology and phenotypes of a new disease entity. Lancet Respir Med. 2021;9(6):622–642. - PMC - PubMed
    1. Venet F., Cour M., Rimmele T., et al. Longitudinal assessment of IFN-I activity and immune profile in critically ill COVID-19 patients with acute respiratory distress syndrome. Crit Care. 2021;25(1):140. - PMC - PubMed
    1. Remy K.E., Mazer M., Striker D.A., et al. Severe immunosuppression and not a cytokine storm characterizes COVID-19 infections. JCI Insight. 2020;5(17) - PMC - PubMed
    1. Saadatian-Elahi M., Picot V., Henaff L., et al. Protocol for a prospective, observational, hospital-based multicentre study of nosocomial SARS-CoV-2 transmission: NOSO-COR Project. BMJ Open. 2020;10(10) - PMC - PubMed
    1. Gossez M., Malcus C., Demaret J., Frater J., Poitevin-Later F., Monneret G. Evaluation of a novel automated volumetric flow cytometer for absolute CD4+ T lymphocyte quantitation. Cytom B Clin Cytom. 2017;92(6):456–464. - PubMed

Publication types