. 2022 Sep 6;130(2):215-230.
doi: 10.1093/aob/mcac043.

Scaling the leaf length-times-width equation to predict total leaf area of shoots

Affiliations

Scaling the leaf length-times-width equation to predict total leaf area of shoots

Kohei Koyama et al. Ann Bot. .

Abstract

Background and aims: An individual plant consists of different-sized shoots, each of which consists of different-sized leaves. To predict plant-level physiological responses from the responses of individual leaves, modelling this within-shoot leaf size variation is necessary. Within-plant leaf trait variation has been well investigated in canopy photosynthesis models but less so in plant allometry. Therefore, integration of these two different approaches is needed.

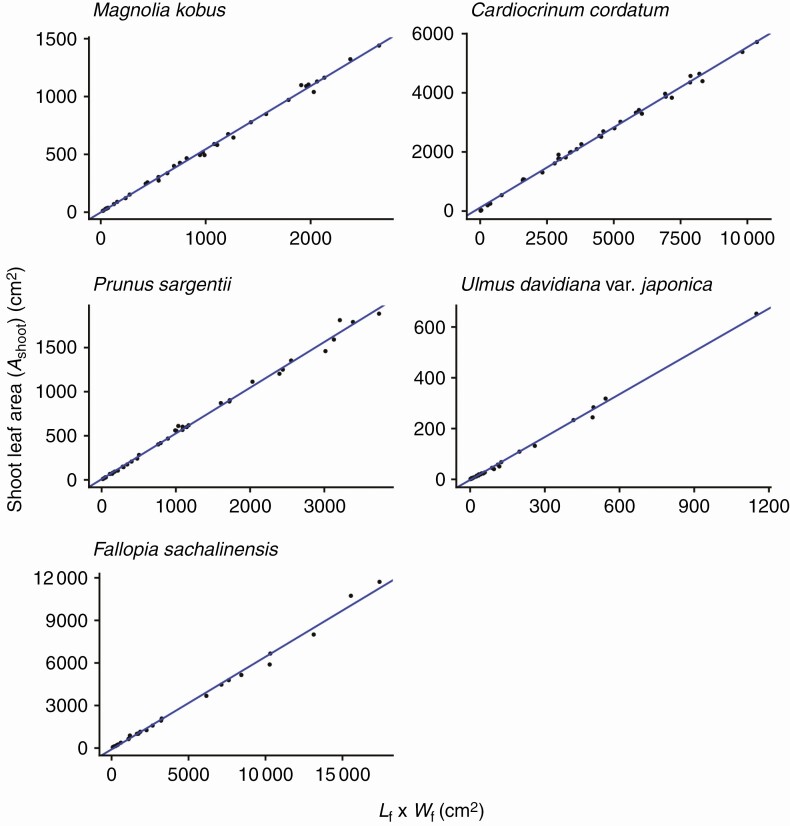
Methods: We focused on an established leaf-level relationship that the area of an individual leaf lamina is proportional to the product of its length and width. The geometric interpretation of this equation is that different-sized leaf laminas from a single species share the same basic form. Based on this shared basic form, we synthesized a new length-times-width equation predicting total shoot leaf area from the collective dimensions of leaves that comprise a shoot. Furthermore, we showed that several previously established empirical relationships, including the allometric relationships between total shoot leaf area, maximum individual leaf length within the shoot and total leaf number of the shoot, can be unified under the same geometric argument. We tested the model predictions using five species, all of which have simple leaves, selected from diverse taxa (Magnoliids, monocots and eudicots) and from different growth forms (trees, erect herbs and rosette herbs).

Key results: For all five species, the length-times-width equation explained within-species variation of total leaf area of a shoot with high accuracy (R2 > 0.994). These strong relationships existed despite leaf dimensions scaling very differently between species. We also found good support for all derived predictions from the model (R2 > 0.85).

Conclusions: Our model can be incorporated to improve previous models of allometry that do not consider within-shoot size variation of individual leaves, providing a cross-scale linkage between individual leaf-size variation and shoot-size variation.

Keywords: Cardiocrinum cordatum; Fallopia sachalinensis; Magnolia kobus; Prunus sargentii; Ulmus davidiana var. japonica; Allometry; Corner’s rule; intraspecific; leaf size; scaling; self-affine; shoot size.


Figures

Fig. 1.
Fig. 1.
Definition of the words ‘similar’ and ‘affine’ used in this article. (A) Two similar triangles share the same length-to-width ratio. (B) Two affine triangles may have different length-to-width ratios. For an affine transformation to change the small triangle into the large triangle, the scaling factor in one direction (a) is not necessarily equal to that in the other direction (b), and similar transformation is a special case of affine transformation when a = b. In both cases, the area is proportional to the product of the length (L) and width (W).
Fig. 2.
Fig. 2.
The length-times-width model for (A) an individual leaf and (B) a shoot.
Fig. 3.
Fig. 3.
The total leaf area of a shoot (Ashoot) is proportional to the product of foliage length (Lf) and width (Wf), as predicted by eqn (4). Each closed circle indicates an individual shoot. See Fig. 2B for the definition of foliage length and width. The blue lines show OLS (ordinary least squares) regression lines (R2 > 0.994). See Table 2 for the regression results.
Fig. 4.
Fig. 4.
The total leaf area of a shoot (Ashoot) is a power function of foliage width (Wf), defined as the maximum individual leaf length of the shoot, as predicted by eqn (6). Each closed circle indicates one individual shoot. The blue lines show the OLS (ordinary least squares) regression lines (R2 = 0.944–0.976). See Table 2 for the regression results.
Fig. 5.
Fig. 5.
The total leaf area of a shoot (Ashoot) is a power function of the maximum individual leaf width of the shoot, as predicted by eqn (7). Each closed circle indicates an individual shoot. The blue lines show the OLS (ordinary least squares) regression lines (R2 = 0.930–0.967). See Table 2 for the regression results.
Fig. 6.
Fig. 6.
Log–log linear (allometric) relationship between foliage length (Lf) and width (Wf). The regression slopes correspond to β in eqn (5). Each closed circle indicates an individual shoot. The red lines show the SMA (standardized major axis) regression lines (R2 = 0.905–0.960). See Table 2 for the regression results.
Fig. 7.
Fig. 7.
Log–log linear (allometric) relationship between the total leaf area of a shoot (Ashoot) and the total number of leaves on the shoot (N). The regression slopes correspond to α in eqn (9). Each closed circle indicates one individual shoot. The red lines show the SMA (standardized major axis) regression lines (R2 = 0.859–0.964). See Table 2 for the regression results.
Fig. 8.
Fig. 8.
The total leaf area of a shoot (Ashoot) is proportional to the product of the maximum individual leaf area and the number of leaves on the shoot (N), as predicted by eqn (8). Each closed circle indicates one individual shoot. The blue lines show the OLS (ordinary least squares) regression lines (R2 > 0.976).
Fig. 9.
Fig. 9.
The total leaf area of a shoot divided by foliage width (Ashoot/Wf) is a power function of the number of leaves on the shoot (N). The regression slopes correspond to γ in eqn (12). Each closed circle indicates an individual shoot. The blue lines show the OLS (ordinary least squares) regression lines (R2 = 0.871–0.977). See Table 2 for the regression results.
Fig. 10.
Fig. 10.
The total leaf area of a shoot (Ashoot) is proportional to the product of the number of leaves (N) times (maximum + minimum individual leaf area) divided by 2. The regression slopes correspond to k in eqn (13). Each closed circle indicates an individual shoot. The blue lines show the OLS (ordinary least squares) regression lines (R2 > 0.981). See Table 2 for the regression results.

Similar articles

Cited by

References

    1. Ackerly DD, Bazzaz FA. 1995. Leaf dynamics, self-shading and carbon gain in seedlings of a tropical pioneer tree. Oecologia 101: 289–298. doi:10.1007/BF00328814. - DOI - PubMed
    1. Ackerly DD, Donoghue MJ. 1998. Leaf size, sapling allometry, and Corner’s rules: phylogeny and correlated evolution in maples (Acer). The American Naturalist 152: 767–791. doi:10.1086/286208. - DOI - PubMed
    1. Anten NPR. 2016. Optimization and game theory in canopy models. In: Hikosaka K, Niinemets Ü, Anten NPR, eds. Canopy photosynthesis: from basics to applications. Dordrecht: Springer Netherlands, 355–377.
    1. APG IV. 2016. An update of the Angiosperm Phylogeny Group classification for the orders and families of flowering plants: APG IV. Botanical Journal of the Linnean Society 181: 1–20.
    1. Auguie B. 2017. https://CRAN.R-project.org/package=gridExtra.

Publication types