[Preprint]. 2022 Mar 23:rs.3.rs-1276578.
doi: 10.21203/rs.3.rs-1276578/v1.

Robust, persistent adaptive immune responses to SARS-CoV-2 in the oropharyngeal lymphoid tissue of children

Affiliations

Robust, persistent adaptive immune responses to SARS-CoV-2 in the oropharyngeal lymphoid tissue of children

Qin Xu et al. Res Sq. .

Update in

  • Adaptive immune responses to SARS-CoV-2 persist in the pharyngeal lymphoid tissue of children.
    Xu Q, Milanez-Almeida P, Martins AJ, Radtke AJ, Hoehn KB, Oguz C, Chen J, Liu C, Tang J, Grubbs G, Stein S, Ramelli S, Kabat J, Behzadpour H, Karkanitsa M, Spathies J, Kalish H, Kardava L, Kirby M, Cheung F, Preite S, Duncker PC, Kitakule MM, Romero N, Preciado D, Gitman L, Koroleva G, Smith G, Shaffer A, McBain IT, McGuire PJ, Pittaluga S, Germain RN, Apps R, Schwartz DM, Sadtler K, Moir S, Chertow DS, Kleinstein SH, Khurana S, Tsang JS, Mudd P, Schwartzberg PL, Manthiram K. Xu Q, et al. Nat Immunol. 2023 Jan;24(1):186-199. doi: 10.1038/s41590-022-01367-z. Epub 2022 Dec 19. Nat Immunol. 2023. PMID: 36536106 Free PMC article.

Abstract

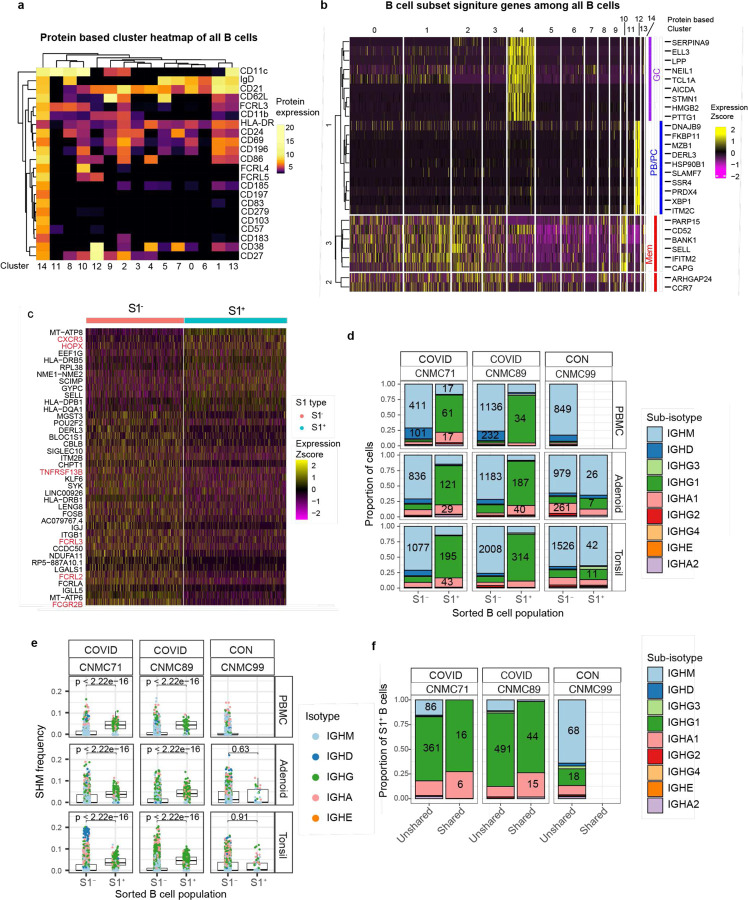
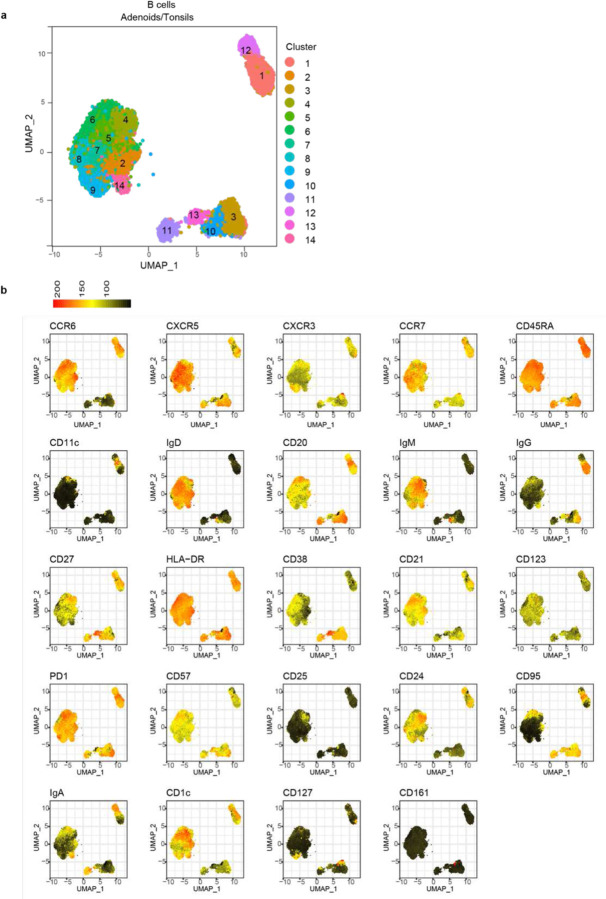
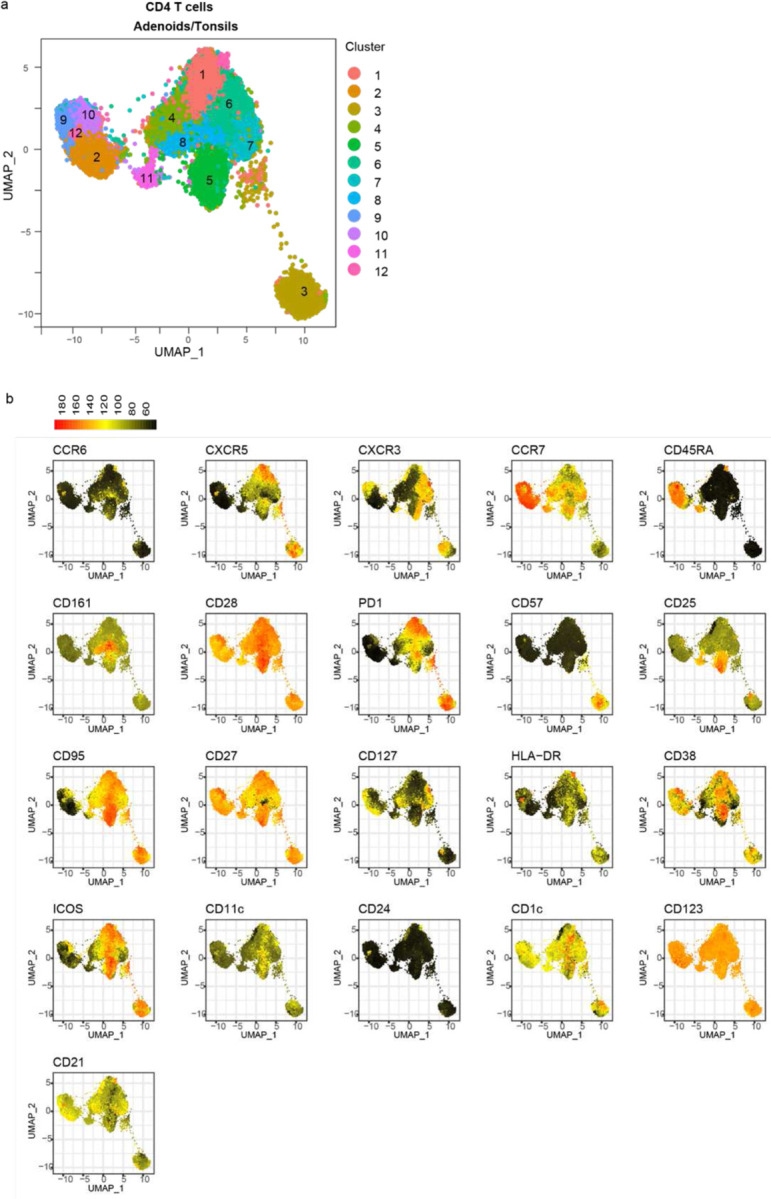
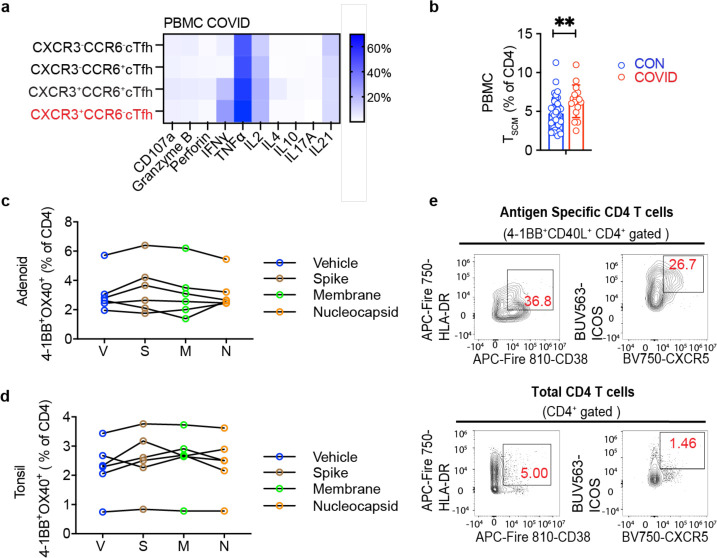
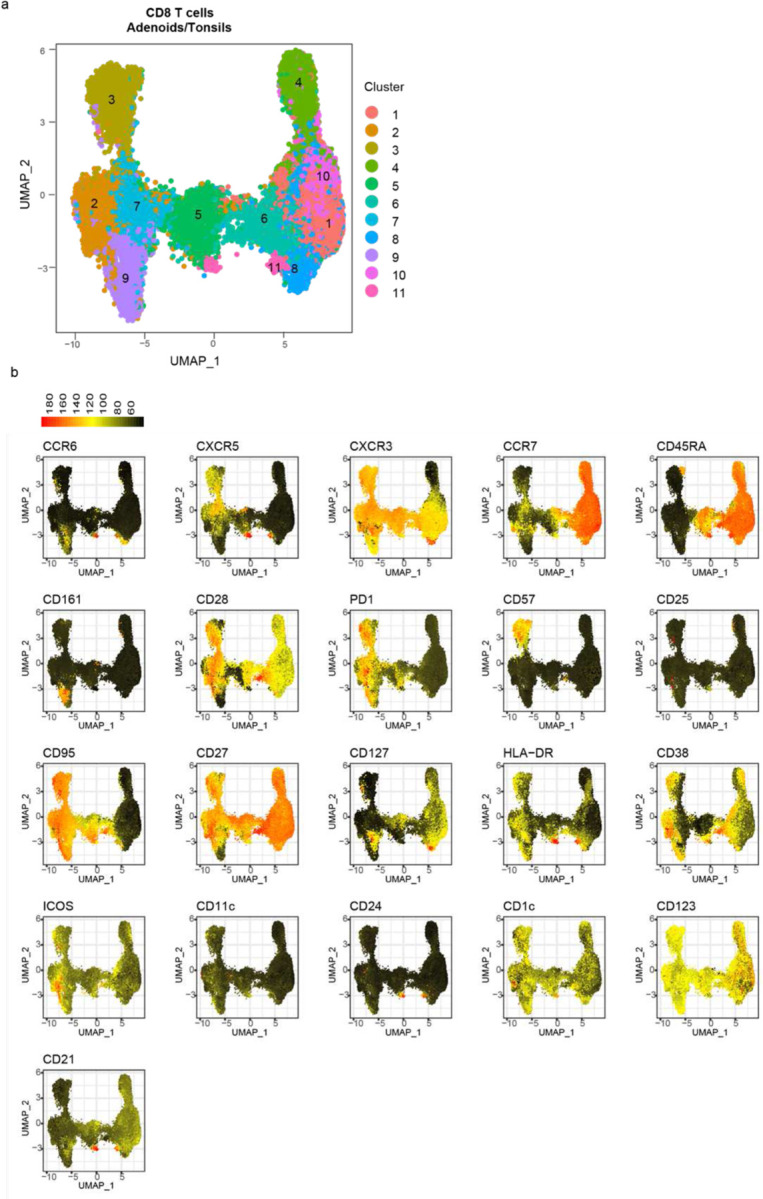
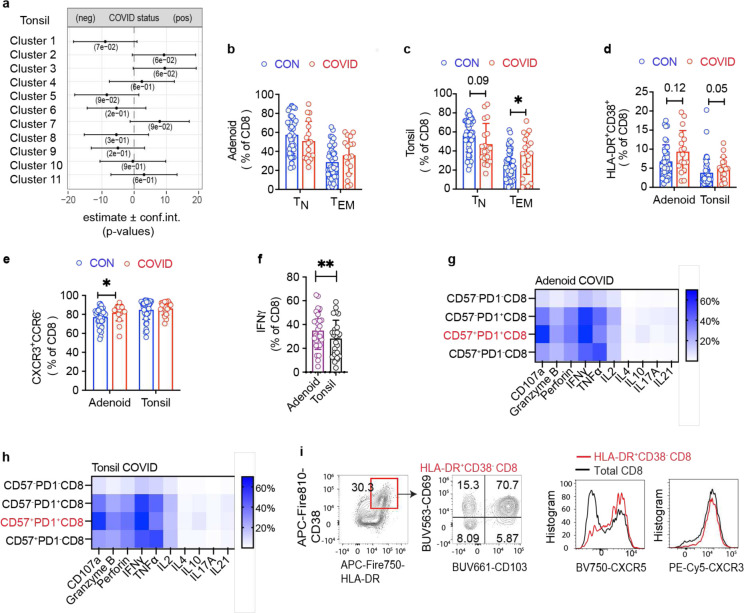
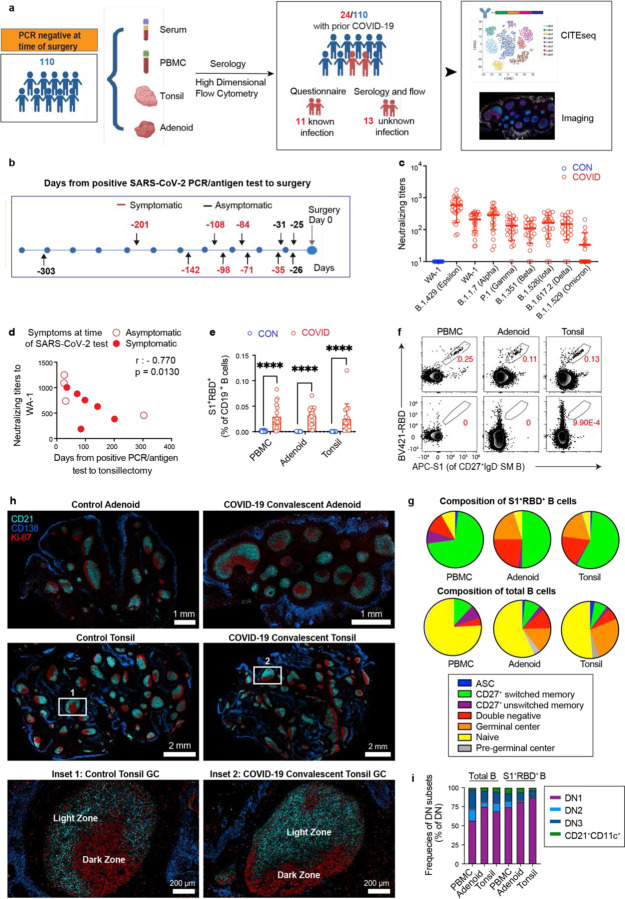
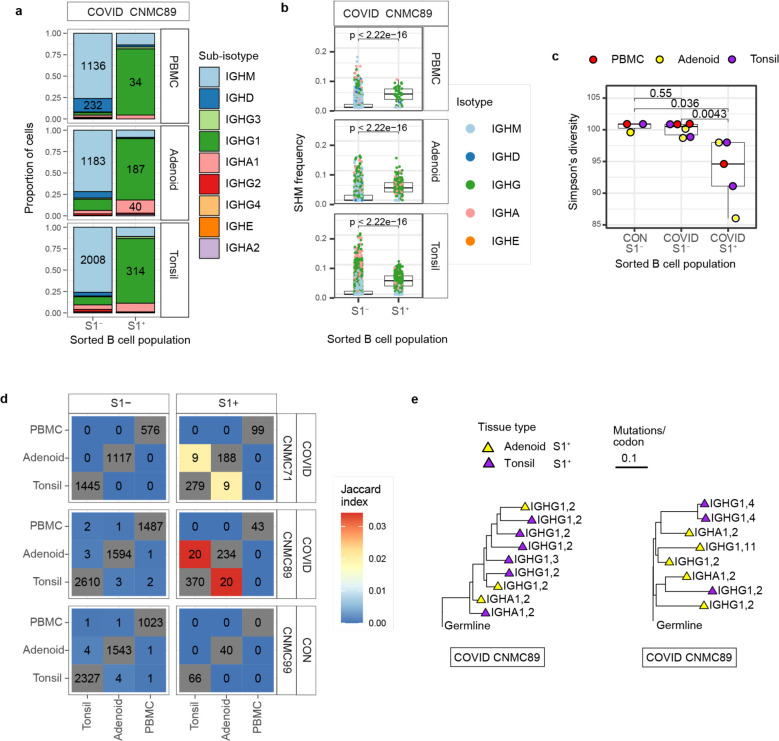
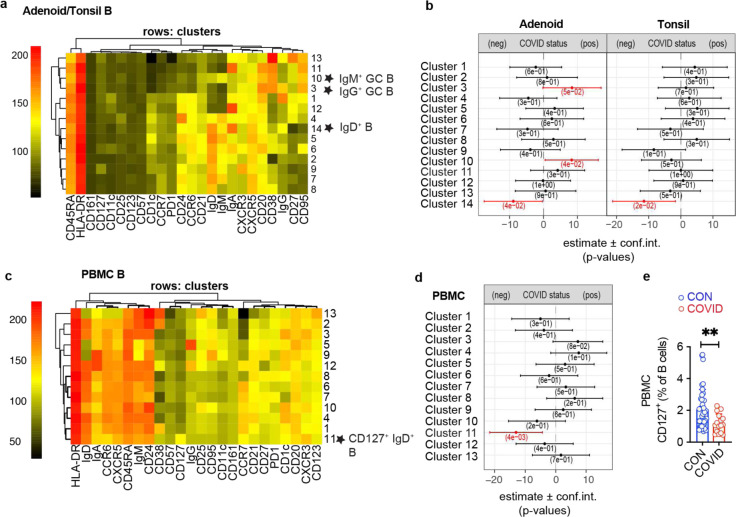
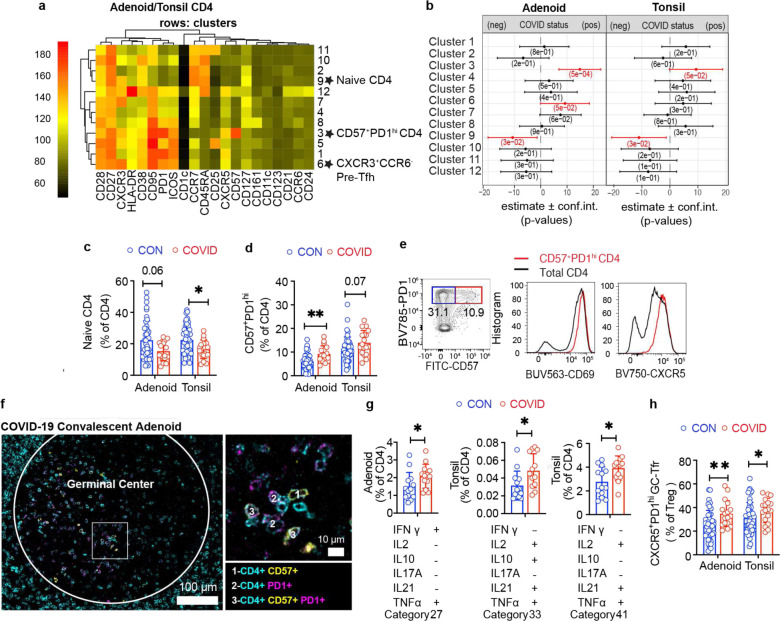
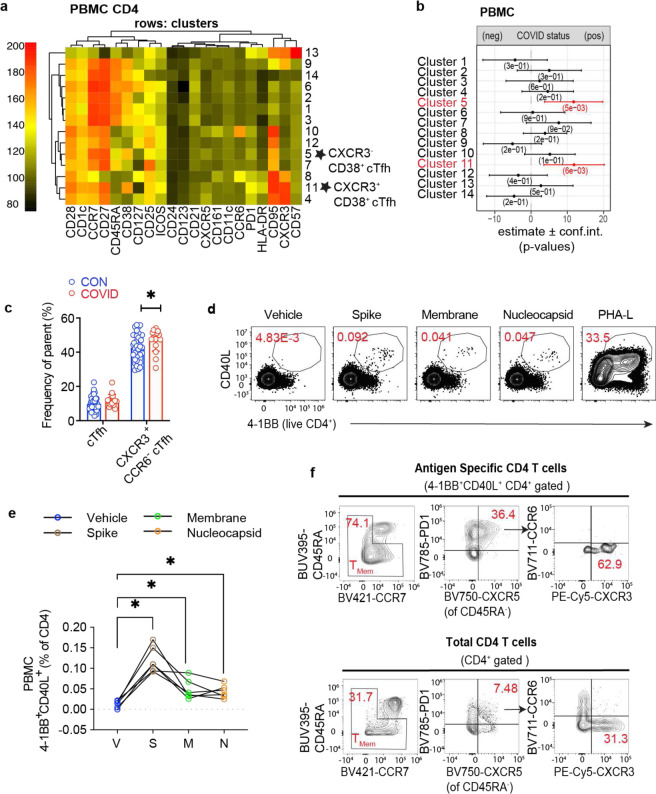
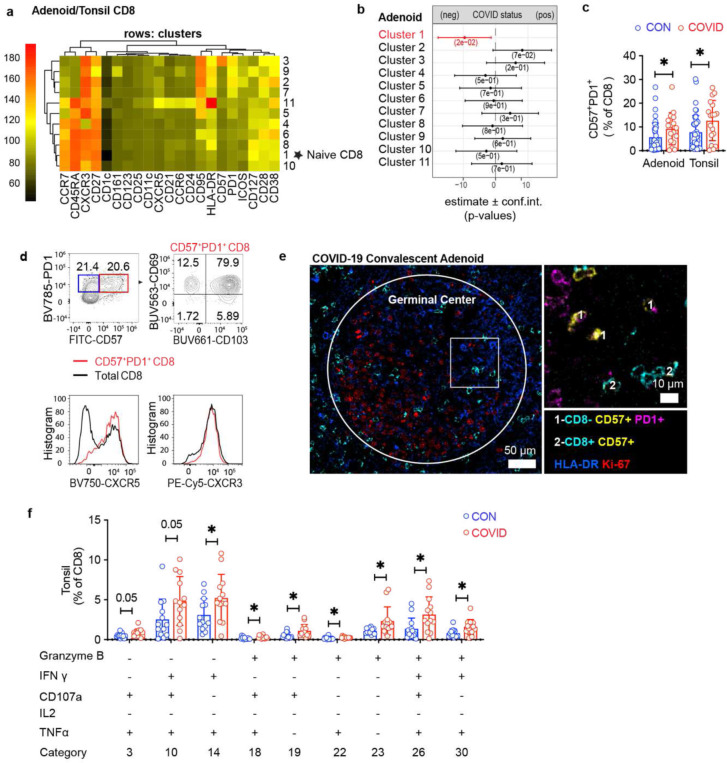
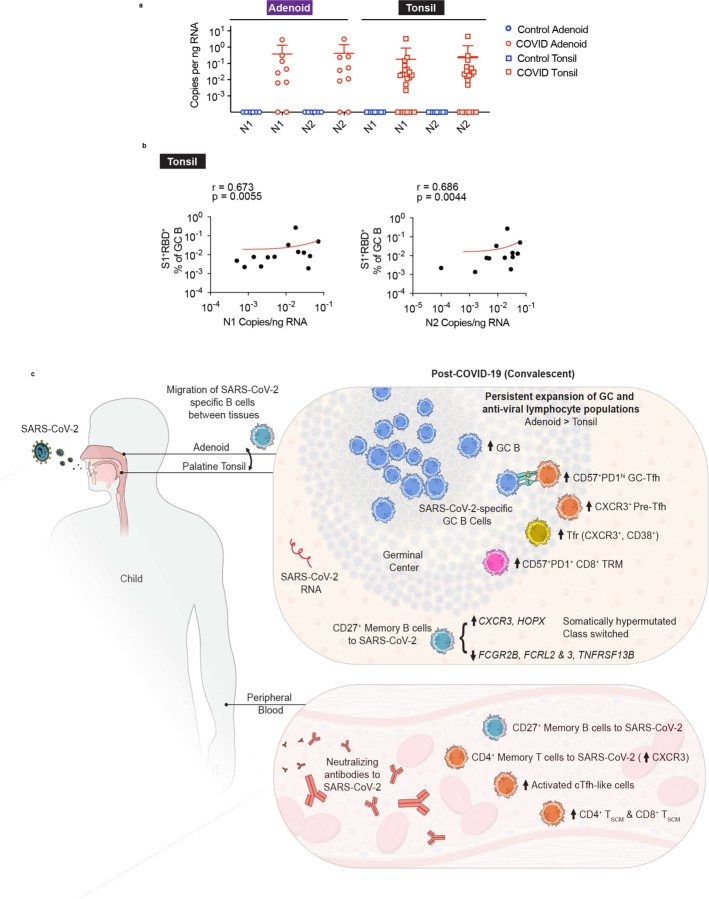
SARS-CoV-2 infection triggers adaptive immune responses from both T and B cells. However, most studies focus on peripheral blood, which may not fully reflect immune responses in lymphoid tissues at the site of infection. To evaluate both local and systemic adaptive immune responses to SARS-CoV-2, we collected peripheral blood, tonsils, and adenoids from 110 children undergoing tonsillectomy/adenoidectomy during the COVID-19 pandemic and found 24 with evidence of prior SARS-CoV-2 infection, including detectable neutralizing antibodies against multiple viral variants. We identified SARS-CoV-2-specific germinal center (GC) and memory B cells; single cell BCR sequencing showed that these virus-specific B cells were class-switched and somatically hypermutated, with overlapping clones in the adenoids and tonsils. Oropharyngeal tissues from COVID-19-convalescent children showed persistent expansion of GC and anti-viral lymphocyte populations associated with an IFN-γ-type response, with particularly prominent changes in the adenoids, as well as evidence of persistent viral RNA in both tonsil and adenoid tissues of many participants. Our results show robust, tissue-specific adaptive immune responses to SARS-CoV-2 in the upper respiratory tract of children weeks to months after acute infection, providing evidence of persistent localized immunity to this respiratory virus.


Conflict of interest statement

Competing interests: S. Preite and A.S. are currently employees of AstraZeneca and may own stock or stock options. S.H.K. receives consulting fees from Peraton. K.B.H. receives consulting fees from Prellis Biologics.

Figures

Extended Figure Data 1.
Extended Figure Data 1.. Characterization of neutralization titers and S1+RBD+ B cells
a. Correlation among frequencies of S1+RBD+ cell among B cells in peripheral blood, tonsils, and adenoids. The color of data points indicates neutralizing titers (PsVNA50) to the WA-1 variant. Donors 32, 91, 104, who had the lowest frequencies of S1+RBD+ B cells, are labeled in the plot. b. Frequency of CD27+ switched memory (SM) B cells among total B cells and among S1+RBD+ B cells from adenoid and tonsil samples from COVID-19-convalescent participants c. Frequency of S1+RBD+ cells among CD27+ SM B cells in adenoid and tonsil according to time from presumed active infection (positive PCR/antigen test from nasopharyngeal swab) to surgery d. Proportion of each isotype among S1+RBD+ SM B cells and total SM B cells in PBMC, adenoid, and tonsil following COVID-19. The percentage of IgA+ cells was significantly lower among S1+RBD+ SM B cells compared to total SM B cells in the tissue (p < 0.0001 for adenoid, p < 0.0001 for tonsil). e. Percentage of S1+RBD+ cells among CD27+ SM B cells from PBMC, adenoid, and tonsil following COVID-19 (COVID) vs. controls (CON) f and g. Percentage of S1+RBD+ cells among total B cells (f) and GC B cells (g) from 14 pairs of adenoid and tonsil COVID samples vs. CON h. Summary of correlations among neutralizing titers (PsVNA50) against several SARS-CoV-2 variants and frequencies of S1+RBD+ cells among B cells in peripheral blood, adenoids, and tonsils. i. and j. Mean number of GCs per total scanned tissue area (i) and mean GC area (total GC area in section/total number of GCs in section) (j) from adenoid and tonsil in COVID vs. CON samples. Samples imaged are in Supplementary Table 9. Gating strategy is shown in Supplementary Fig. 1–2. Samples used in panels a-h are listed in Supplementary Table 2 and 4 (PBMC COVID n = 18, CON n = 33; adenoid COVID n = 16, CON n = 27; and tonsil COVID n = 16, CON n = 30). Each symbol represents data from one donor. Means ± S.D. are displayed in the scatter and bar plots. Significance calculated with Mann-Whitney U test for unpaired values or Wilcoxon signed ranks test for paired values from the same donor. Correlation analysis performed with Spearman’s rank correlation. * p<0.05, *** p<0.001, **** p<0.0001.
Extended Data Figure 2.
Extended Data Figure 2.. CITE-seq analysis of SARS-CoV-2 antigen-specific B cells
a. Heatmap of unsupervised clustering by CITE-seq antibody expression of S1+ and S1 B cells from tonsil, adenoid, and PBMCs from three donors (2 COVID-19 convalescent and 1 control) yielding 15 clusters. Most S1+ B cells are in cluster 2 which is IgD and CD27+, indicative of a memory B cell phenotype. b. Heatmap showing expression of signature gene sets for germinal center (GC) B cells, memory B cells, and plasma cells/plasmablasts (PC/PB) among all B cells (S1+ and S1) from tonsil, adenoid, and PBMC organized by cluster. c. Heatmap showing differentially expressed (DE) genes in S1+ vs. S1 B cells from tonsil and adenoid from cluster 2 (which are CD27+ memory B cells, shown in Fig. 2a and Extended Data Fig. 2a). DE gene list is in Supplementary Table 5. d. Sub-isotype frequencies among S1+ and S1 B cells from adenoid, tonsil and PBMC of two COVID-19 convalescent donors (CNMC 71 and 89) and one control (CNMC 99). Labels show the raw number of cells with a given sub-isotype and are only shown for sub-isotypes that make up at least 10% of a given category. e. Somatic hypermutation (SHM) frequency among S1+ and S1 B cells of all isotypes from PBMC, adenoid, and tonsil of each donor. Mutation frequency calculated in V gene. Significance calculated with the Mann Whitney U test. f. Sub-isotype frequencies among S1+ B cells from clones shared between tonsil and adenoid vs. unshared clones. Labels show the raw number of cells with a given sub-isotype and are only included for sub-isotypes that make up at least 10% of a given category.
Extended Data Figure 3.
Extended Data Figure 3.. Gene-based clustering of CITE-seq of S1+ and S1 B cells
Unsupervised clustering based on gene expression of sorted S1+ and S1 B cells from tonsil, adenoid, and PBMCs from three donors (2 COVID-19 convalescent and 1 control) yielding 19 clusters. Top defining genes for each cluster are noted. Top bar shows the corresponding cluster based on CITE-seq surface protein expression (shown in Extended Data Fig. 2a–b); middle bar indicates which cells are S1+, and lower bar indicates tissue of origin.
Extended Data Figure 4.
Extended Data Figure 4.. UMAP of unsupervised clustering of B cells from tonsil and adenoid
a. Uniform manifold approximation and projection (UMAP) of unsupervised clustering of surface markers from flow cytometric analysis of CD19+ B cells from adenoid and tonsil. b. Heatmaps of marker/antibody expression overlayed on UMAP.
Extended Data Figure 5.
Extended Data Figure 5.. Phenotyping of expanded CD4+ T cell populations in tissue
a. Comparison of CD3+, CD4+, and CD8+ T cell frequency in adenoid of COVID-19-convalescent donors (COVID) vs. controls (CON). b and c. Correlation between frequency of CD57+PD-1hi CD4+ T cells and frequency of GC B in adenoids (b) and tonsil (c) (adenoid n = 59, tonsil n = 64, includes both COVID-19-convalescent samples and controls). d. Summary of correlations among various subsets of SARS-CoV-2 antigen-specific B cells and significantly different clusters from unsupervised analysis of tissue CD4+ T cells (clusters 3, 6, 9). USM = unswitched memory B, SM = switched memory B, DN = double negative B, GC = germinal center. e and f. Intracellular cytokine and cytotoxic factor expression in various CD4+ T cell subsets gated on CD57 and PD-1 from COVID-19-convalescent adenoids (e, n = 13) and tonsil (f, n = 13) after PMA and ionomycin stimulation. Mean frequency expressing each cytokine is plotted in the heatmap. g. Frequency of CXCR3+CCR6 cells among pre-Tfh cells (PD-1intCXCR5+ conventional CD4+ T) in adenoids and tonsils of COVID vs. CON. h. Intracellular cytokine and cytotoxic factor expression in different pre-Tfh cell subsets gated on CXCR3 and CCR6 from COVID-19-convalescent adenoids (n = 13) and tonsils (n = 13) after PMA and ionomycin stimulation. Mean frequency expressing of each cytokine is plotted in the heatmap. i. Comparison of IFN-γ production by CD4+ T cells in adenoid versus tonsil following PMA/ionomycin stimulation (n = 26 which includes 13 COVID and 13 CON of each tissue). j. Correlation between frequency of GC-Tfr and GC B frequencies in adenoid (n = 59, includes both COVID and CON). k. Correlation between frequency of GC-Tfr and GC B frequencies in tonsil (n = 64, includes both COVID and CON). l and m. Frequencies of HLA-DR+CD38+ (d) CXCR3+CCR6 (e) cells among Treg cells in adenoid and tonsil. (COVID adenoid n = 17, CON adenoid n = 42, COVID tonsil n = 18, CON tonsil n = 46). Gating strategy shown in Supplementary Fig. 5. Samples analyzed in panels a-c, g and j-m are listed in Supplementary Table 2 (COVID adenoid n = 17, CON adenoid n = 42, COVID tonsil n = 18, CON tonsil n = 46). Samples analyzed for panel d-e and h-i are in Supplementary Table 9. Each symbol represents data from one donor. Means ± S.D. are displayed on scatter and bar plots. Significance calculated using Mann-Whitney U test to compare two groups and Spearman’s rank test for correlations. * p<0.05
Extended Data Figure 6.
Extended Data Figure 6.. UMAP of unsupervised clustering of CD4+ T cells from tonsil and adenoid
a. Uniform manifold approximation and projection (UMAP) of unsupervised clustering of surface markers from flow cytometric analysis of CD4+ T cells from adenoid and tonsil. b. Heatmaps of marker/antibody expression overlayed on UMAP.
Extended Data Figure 7.
Extended Data Figure 7.. SARS-CoV-2 antigen-specific CD4+ T cells following COVID-19
a. Intracellular cytokine and cytotoxic factor production by various circulating Tfh (cTfh) cell subsets in PBMC gated by CXCR3 and CCR6 from COVID-19-convalescent donors (n = 4) following PMA and ionomycin stimulation. Mean frequency expressing each cytokine is plotted in heatmap. b. Frequency of stem cell-like memory CD4+ T (TSCM, CD45RA+CCR7+CD28+CD27+CD95+) subsets in PBMC of COVID-19-convalescent donors (COVID) vs. controls (CON) (COVID = 16, CON = 41). Significance calculated using Mann-Whitney U test. Gating strategy in Supplementary Fig. 7. c and d. Frequencies of AIM+ (OX40+4–1BB+) CD4+ T cells from adenoid (c) and tonsil (d) of COVID-19-convalescent donors following SARS-CoV-2 peptide pool stimulation (adenoid n = 6, tonsil n = 6). Significance calculated with Wilcoxon signed rank test for paired samples from the same donor. e. Flow cytometry plots showing frequency of HLA-DR+CD38+ and ICOS+CXCR5+ cells from concatenated antigen-specific CD4+ T cells from PBMC following SARS-CoV-2 peptide stimulation compared to total CD4+ T cells. AIM+ CD4+ T cells were concatenated from all three peptide pool stimulations of PBMCs from all 6 donors. Samples analyzed in panel a, c, and d are listed in Supplementary Table 9, and in panel b are in Supplementary Table 2. ** p<0.01.
Extended Data Figure 8.
Extended Data Figure 8.. UMAP of unsupervised clustering of CD8+ T cells from tonsil and adenoid
a. Uniform manifold approximation and projection (UMAP) of unsupervised clustering of surface markers from flow cytometric analysis of CD8+ T cells from adenoid and tonsil. b. Heatmaps of marker/antibody expression overlayed on UMAP.
Extended Data Figure 9.
Extended Data Figure 9.. Phenotyping of CD8+ T cells from tonsil and adenoid
a. Quantification of the effect of prior SARS-CoV-2 infection on CD8+ T cell clusters in tonsil estimated with a linear model controlling for age and sex. Regression coefficients with 95% confidence intervals and p values are shown (COVID n = 15, CON n = 42). b and c. Frequencies of naïve (TN, CD45RA+CCR7+) and effector memory (TEM, CD45RACCR7) CD8+ T cells in adenoid (b) and tonsil (c) of COVID-19-convalescent samples (COVID) vs. controls (CON). d and e. Frequency of HLA-DR+CD38+ (d) and CXCR3+CCR6 (e) cells among CD8+ T cells in adenoid and tonsil from COVID vs. CON. f. Comparison of IFN-γ production by CD8+ T cells in adenoid versus tonsil following PMA and ionomycin stimulation (n = 26 which includes 13 COVID and 13 CON of each tissue). g and h. Intracellular cytokine and cytotoxic factor production by different CD8+ T cell subsets gated by CD57 and PD-1 from adenoid (g, n = 13) and tonsil (h, n = 13) from COVID-19-convalescent donors. Mean expression of each cytokine is plotted in the heatmap. i. Representative flow cytometry plots showing the expression of CD69, CD103, CXCR3, and CXCR5 levels on HLA-DR+CD38+ CD8+ T cells in tonsil. Phenotypes are similar in adenoid. Gating strategy shown in Supplementary Fig. 5. Samples analyzed in panels a-e are listed in Supplementary Table 2 (COVID adenoid n = 17, CON adenoid n = 42, COVID tonsil n = 18, CON tonsil n = 46), and in panel f-h are in Supplementary Table 9. Each symbol represents data from one donor. Means ± S.D. are displayed on scatter and bar plots. Significance calculated using Mann-Whitney U test. * p<0.05, ** p<0.01.
Extended Data Figure 10.
Extended Data Figure 10.. Phenotyping of CD8+ T cells from PBMC
a. Unsupervised clustering of CD8+ T cells from PBMC according to surface antibodies from flow cytometric analysis. No clusters showed significant differences (p<0.05) in COVID-19-convalescent samples (COVID) vs. controls (CON) (COVID n = 13, CON n = 34). b. Quantification of the effect of prior SARS-CoV-2 infection on CD8+ T cell clusters in PBMC estimated with a linear model controlling for age and sex. Regression coefficients with 95% confidence intervals and p values are shown. So significantly different clusters were found. Statistical analysis is described in Methods. c. Frequency of T stem cell-like memory (TSCM, CD45RA+CCR7+CD28+CD27+CD95+) among CD8+ T cells in PBMC of COVID (n = 16) vs CON (n = 41). Gating strategy shown in Supplementary Fig. 8. Means ± S.D. are displayed on scatter and bar plots. Significance calculated using Mann-Whitney U test. Samples analyzed are listed in Supplementary Table 2. Each symbol represents data from one donor. ** p<0.01
Figure 1.
Figure 1.. SARS-CoV-2 elicits robust humoral immune responses in children
a. Participant enrollment and study design. b. Time from positive SARS-CoV-2 PCR/antigen test from nasopharyngeal swab to tonsillectomy and/or adenoidectomy surgery. c. Neutralization titers (PsVNA50) against the early isolate WA-1 and seven other SARS-CoV-2 variants of interest in COVID-19 convalescent subjects (COVID) vs. controls (CON) (COVID n=23, CON n=14, samples listed in Supplementary Table 4). d. Correlation between neutralizing antibody titers to WA-1 and days from positive SARS-CoV-2 test to surgery (n = 10). e. Frequency of S1+RBD+ cells among total CD19+ B cells from PBMC, adenoid, and tonsil from COVID vs. CON (PBMC COVID n = 18, CON n = 33; adenoid COVID n = 16, CON n = 27; and tonsil COVID n = 16, CON n = 30). f. Representative flow cytometry plots demonstrating the percentage of SARS-CoV-2-specific (S1+RBD+) cells among CD27+IgD switched memory B cells in PBMC, adenoid, and tonsil following COVID-19. Gating strategy shown in Supplementary Fig 1–2. g. Composition of S1+RBD+ B cells and total B cells from PBMC, adenoid, and tonsil from COVID-19 convalescent subjects. Mean frequency of each B cell subset is presented in the pie chart. B cell subsets are defined in Supplementary Fig 1–2. ASC = antibody secreting cells, equivalent to plasma cells and plasmablasts. h. Representative images of adenoid and tonsil from a COVID-19-convalescent donor showing multiple, intact germinal centers (GCs) comparable to that from controls. Inset shows close-up of GC with discrete light and dark zones. CD21 (follicular dendritic cells, light zone) in cyan, Ki-67 (dividing cells, dark zone) in red, CD138 (plasma cells and epithelial cell marker) in blue. i. Composition of S1+RBD+ double negative (DN) B cells and total DN B cells from PBMC, adenoid, and tonsil (COVID PBMC n = 18, adenoid n = 16, tonsil n = 16). Mean frequency of each DN subset is presented in the bar chart. Each symbol represents data from one donor. Means ± S.D. are displayed in the scatter and bar plots. Significance calculated with Mann-Whitney U test. Correlations assessed with Spearman’s rank correlation. **** p<0.0001.
Figure 2.
Figure 2.. CITE-seq analysis of SARS-CoV-2 antigen-specific B cells
a. Uniform manifold approximation and projection (UMAP) showing 15 clusters of sorted S1+ and S1 B cells from tonsil, adenoid, and PBMCs of three donors (2 COVID-19-convalescent and 1 control) clustered according to CITE-seq surface antibody expression. b and c. Tissue distribution of cells is shown in b. S1+ B cells are highlighted c. d. Proportion of each cluster among S1 and S1+ B cells. e. Heat map showing expression of signature gene sets for germinal center B cells (GC), memory B cells(Mem), and plasma cells/plasmablasts (PB/PC) among S1+ B cells organized by cluster. IgD, CD38, and CD27 CITE-seq antibody expression are shown in lower heat map in grey. Tissue origin is shown in purple (tonsil), yellow (adenoid), and red (PBMC), while clones shared between tonsil and adenoid are marked in black in the top bar. Sorting strategy shown in Supplementary Fig. 3.
Figure 3.
Figure 3.. Single cell BCR sequencing of SARS-CoV-2 antigen-specific B cells
a. Sub-isotype frequencies among S1+ and S1 B cells from PBMC, adenoid, and tonsil of one COVID-19 convalescent donor (CNMC 89). Labels show the raw number of cells with a given sub-isotype and are only included for sub-isotypes that make up at least 10% of a given category. b. Somatic hypermutation (SHM) frequency among S1+ and S1 B cells from PBMC, adenoid, and tonsil of CNMC 89. Mutation frequency calculated in V gene. c. Simpson’s diversity of S1+ and S1 B cells from PBMCs, adenoids, and tonsils from 2 COVID-19 convalescent donors (COVID, CNMC 71 and 89) and one control (CON, CNMC 99). Lower Simpson’s diversity values indicate a greater frequency of large clones. To adjust for sequence depth, diversity is calculated as the mean of 1000 uniform resampling repetitions. d. Overlap of B cell clones among PBMC, tonsil, and adenoid from COVID and CON. Off-diagonal elements are colored by the Jaccard index of clonal overlap between the two tissues and are labelled by the raw number of overlapping clones. Diagonal elements are labelled by the total number of clones within a particular tissue. e. Clonal lineage trees from two of the largest S1+ B cell clones shared between tonsil and adenoid from CNMC 89. Triangles indicate S1+ cells, and tip color indicates tissue of origin. Isotype and CITE-seq cluster of each cell are listed next to the symbol. Branch lengths represent SHM frequency/codon in VDJ sequence according to the scale bar. Significance calculated with Mann Whitney U test.
Figure 4.
Figure 4.. GC B cells are expanded in adenoids after COVID-19
a and c. Unsupervised clustering of CD19+ B cells from adenoid and tonsil (a) and PBMC (c) according to flow cytometric surface markers. Stars indicate clusters with significant differences (p<0.05) in COVID-19-convalescent samples (COVID) vs. controls (CON) (COVID adenoid n = 11, CON adenoid n = 33, COVID tonsil n = 15, CON tonsil n = 42, COVID PBMC n = 14, CON PBMC n = 36). b and d. Quantification of the effect of prior SARS-CoV-2 infection on CD19+ B cell clusters in adenoid and tonsil (b) and PBMC (d) estimated with a linear model controlling for age and sex. Regression coefficients with 95% confidence intervals and p values are shown. Significantly different clusters are highlighted in red. Analyzed samples are listed in Supplementary Table 2. Statistical analysis described in Methods. e. Frequency of CD127+ B cells in PBMC of COVID (n = 16) vs. CON (n = 41). Significance calculated using Mann-Whitney U test. Each symbol represents data from one donor. Mean ± S.D. are displayed. ** p<0.01.
Figure 5.
Figure 5.. CD4+ Tfh cells are expanded in pharyngeal tissues post-COVID-19
a. Unsupervised clustering of CD4+ T cells from adenoid and tonsil according to surface markers from flow cytometry. Stars indicate clusters with significant differences (p<0.05) in COVID-19-convalescent samples (COVID) vs. controls (CON) (COVID adenoid n = 12, CON adenoid n = 38, COVID tonsil n = 15, CON tonsil n = 43). b. Quantification of the effect of prior SARS-CoV-2 infection on CD4+ T cell clusters in adenoid and tonsil estimated with a linear model controlling for age and sex. Regression coefficients with 95% confidence intervals and p values are shown. Significantly different clusters are highlighted in red. Statistical analysis is described in Methods. c. and d. Frequencies of naïve (CD45RA+CCR7+) CD4+ T cells (c) and CD57+PD-1hi CD4+ T cells (d) in adenoids and tonsils of COVID vs. CON. e. Representative plots of CD69 and CXCR5 expression on CD57+PD-1hi CD4+ T cells vs. total CD4+ T cells from tonsil. Phenotypes are similar in adenoid. f. Representative multicolor immunofluorescence staining of COVID adenoid showing the location of CD57+PD-1hi CD4+ T cells in the GC. CD4 shown in cyan, CD57 in yellow, and PD-1 in magenta. GC boundaries were defined using Ki-67 (not shown) as demonstrated in Figure 1h. g. Significantly different cytokine combinations produced by tonsillar and adenoid CD4+ T cells from COVID (n = 13) vs. CON (n = 13) following PMA and ionomycin stimulation. Fifty-nine combinations of cytokines (IFN-γ, IL-2, IL-10, IL-17A, IL-21, and TNF-α) made by CD4+ T cells were included in the SPICE analysis (see Supplementary Fig. 6). h. Frequencies of CXCR5+PD-1hi GC-Tfr cells in adenoid and tonsil of COVID vs. CON. Gating strategy shown in Supplementary Figure 5. Samples analyzed in panels c-d and h are listed in Supplementary Table 2 (COVID adenoid n = 17, CON adenoid n = 42, COVID tonsil n = 18, CON tonsil n = 46). Samples included in panel f-g are listed in Supplementary Table 9. Each symbol represents data from one donor. Means ± S.D. are displayed on scatter and bar plots. Significance calculated using Mann-Whitney U test. * p<0.05, ** p<0.01.
Figure 6.
Figure 6.. SARS-CoV-2 antigen-specific CD4+ T cells in PBMC following COVID-19
a. Unsupervised clustering of CD4+ T cells from PBMC according to surface markers from flow cytometric analysis. Stars indicate clusters with significant differences (p<0.05) in COVID-19-convalescent samples (COVID) vs. controls (CON) (COVID n = 13, CON n = 34). b. Quantification of the effect of prior SARS-CoV-2 infection on CD4+ T cell clusters in PBMC estimated with a linear model controlling for age and sex. Regression coefficients with 95% confidence intervals and p values are shown. Significantly different clusters are highlighted in red. Statistical analysis is described in Methods. c. Frequencies of cTfh (CD45RACXCR5+PD-1+) and CXCR3+CCR6 cTfh cells in PBMC of COVID (n=16) vs. CON (n=41). Significance calculated with Mann-Whitney U. d. Representative flow cytometry plots showing gating of antigen-specific CD4+ T cells from PBMC of a COVID-19-convalescent donor expressing activation induced markers (AIM+: CD40L+4–1BB+) following stimulation with SARS-CoV-2 peptide pools of spike, membrane, and nucleocapsid. DMSO was used as negative control (vehicle), and PHA-L was used as positive control. e. Frequencies of AIM+ CD4+ T cells from PBMC of COVID-19-convalescent donors following SARS-CoV-2 peptide pool stimulation (n = 6). Significance calculated with Wilcoxon signed rank test for paired samples from the same donor. f. Flow cytometry plots showing frequency of TMem, cTfh (CD45RACXCR5+PD-1+), and CXCR3+CCR6 cTfh cells from concatenated antigen-specific CD4+ T cells following SARS-CoV-2 peptide stimulation compared to total CD4+ T cells in PBMC. AIM+ CD4+ T cells were concatenated from all three peptide pool stimulations from all 6 donors. Gating strategy shown in Supplementary Figure 8. Samples used in AIM analyses are shown in Supplementary Table 9. * p<0.05.
Figure 7.
Figure 7.. Tissue-resident memory CD8+ T cells are expanded in pharyngeal tissues post-COVID-19
a. Unsupervised clustering of CD8+ T cells from adenoid and tonsil according to surface antibody expression from flow cytometry analysis. Stars indicate clusters with significant differences (p<0.05) in COVID-19-convalescent samples (COVID) vs. controls (CON). (COVID adenoid n = 12, CON adenoid n = 35, COVID tonsil n = 15, CON tonsil n = 42). b. Quantification of the effect of prior SARS-CoV-2 infection on CD8+ T cell clusters in adenoid estimated with a linear model controlling for age and sex. Regression coefficients with 95% confidence intervals and p values are shown. Significantly different clusters are highlighted in red. Statistical analysis is described in Methods. c. Frequency of CD57+PD-1+ CD8+ T cells in adenoid and tonsil from COVID vs. CON (COVID adenoid n = 17, CON adenoid n = 42, COVID tonsil n = 18, CON tonsil n = 46). d. Representative flow cytometry plots showing CD69, CD103, CXCR5, and CXCR3 expression on CD57+PD-1+ CD8+ T cells from tonsil. Phenotypes are similar in adenoid. e. Representative multicolor immunofluorescence staining of adenoid from COVID-19-convalescent donor showing the location of CD57+PD-1+ CD8+ T in the GC. CD8 is shown in cyan, CD57 is yellow, PD-1 is pink. HLA-DR (blue) stains follicles, and Ki-67 (red) stains GC. f. Significantly different cytokine combinations produced by tonsillar CD8+ T cells from COVID (n=13) vs. CON (n=13) following PMA and ionomycin stimulation. Thirty-one combinations of cytotoxic factors and cytokines (granzyme B, IFN-γ, CD107a, IL-2 and TNF-α) made by CD8+ T cells were included in the SPICE analysis (see Supplementary Fig. 9). Gating strategy shown in Supplementary Figure 5. Samples analyzed in panels a-c are listed in Supplementary Table 2. Samples included in panels e-f are listed in Supplementary Table 9. Each symbol represents data from one donor. Means ± S.D. are displayed in scatter and bar plots. Significance calculated using Mann-Whitney U test. * p<0.05.
Figure 8.
Figure 8.. Persistence of SARS-CoV-2 RNA in the pharyngeal tissues post-COVID-19
a. Quantification of SARS-CoV-2 nucleocapsid RNA by digital droplet PCR (ddPCR) from adenoid and tonsil FFPE tissue blocks (COVID adenoid n = 9, control adenoid = 6, COVID tonsil n = 22, control tonsil n = 9). N1 and N2 represent two regions of the gene encoding the SARS-CoV-2 nucleocapsid. Each symbol represents data from one donor. Means ± S.D. are displayed. b. Correlation of nucleocapsid (N1 and N2) copies per nanogram RNA with percentage of S1+RBD+ B cells among GC B cells from tonsils following SARS-CoV-2 infection (COVID tonsil n = 13). c. Schematic illustrating the immunologic profile of the oropharyngeal lymphoid tissues and peripheral blood of COVID-19-convalescent children including (1) SARS-CoV-2-specific GC and memory B cells with overlapping clones in the tonsils and adenoids, (2) persistent changes in lymphocyte populations involved in germinal center and anti-viral responses, which were most prominent in the adenoid, with type 1 skewing of several T lymphocyte populations, and (3) persistence of viral RNA in the tissue. Samples analyzed are in Supplementary Table 7. Each symbol represents data from one donor. Means ± S.D. are displayed in scatter plots. Correlations assessed with Spearman’s rank correlation.

References

Main References:

    1. Weisberg S. P. et al. Distinct antibody responses to SARS-CoV-2 in children and adults across the COVID-19 clinical spectrum. Nature Immunology 22, 25–31, doi: 10.1038/s41590-020-00826-9 (2021). - DOI - PMC - PubMed
    1. Pierce C. A. et al. Immune responses to SARS-CoV-2 infection in hospitalized pediatric and adult patients. Science Translational Medicine 12, eabd5487, doi: 10.1126/scitranslmed.abd5487 (2020). - DOI - PMC - PubMed
    1. Wölfel R. et al. Virological assessment of hospitalized patients with COVID-2019. Nature 581, 465–469, doi: 10.1038/s41586-020-2196-x (2020). - DOI - PubMed
    1. Huang N. et al. SARS-CoV-2 infection of the oral cavity and saliva. Nature Medicine 27, 892–903, doi: 10.1038/s41591-021-01296-8 (2021). - DOI - PMC - PubMed
    1. Wagar L. E. et al. Modeling human adaptive immune responses with tonsil organoids. Nature Medicine 27, 125–135, doi: 10.1038/s41591-020-01145-0 (2021). - DOI - PMC - PubMed

Methods References:

    1. Michael S. et al. Standardization of ELISA protocols for serosurveys of the SARS-CoV-2 pandemic using clinical and at-home blood sampling. Nature communications 12, doi: 10.1038/s41467-020-20383-x (2021). - DOI - PMC - PubMed
    1. Zahra F. T., Bellusci L., Grubbs G., Golding H. & Khurana S. Neutralisation of circulating SARS-CoV-2 delta and omicron variants by convalescent plasma and SARS-CoV-2 hyperimmune intravenous human immunoglobulins for treatment of COVID-19. Annals of the Rheumatic Diseases, annrheumdis-2022–222115, doi: 10.1136/annrheumdis-2022-222115 (2022). - DOI - PubMed
    1. Ravichandran S. et al. Antibody signature induced by SARS-CoV-2 spike protein immunogens in rabbits. Sci Transl Med 12, doi: 10.1126/scitranslmed.abc3539 (2020). - DOI - PMC - PubMed
    1. Tang J. et al. Antibody affinity maturation and plasma IgA associate with clinical outcome in hospitalized COVID-19 patients. Nat Commun 12, 1221, doi: 10.1038/s41467-021-21463-2 (2021). - DOI - PMC - PubMed
    1. Park L. M., Lannigan J. & Jaimes M. C. OMIP-069: Forty-Color Full Spectrum Flow Cytometry Panel for Deep Immunophenotyping of Major Cell Subsets in Human Peripheral Blood. Cytometry A 97, 1044–1051, doi: 10.1002/cyto.a.24213 (2020). - DOI - PMC - PubMed

Publication types

LinkOut - more resources