

Network Crosstalk as a Basis for Drug Repurposing
- PMID: 35350247
- PMCID: PMC8958038
- DOI: 10.3389/fgene.2022.792090
Network Crosstalk as a Basis for Drug Repurposing
Erratum in
-
Corrigendum: Network Crosstalk as a Basis for Drug Repurposing.Front Genet. 2022 May 16;13:921286. doi: 10.3389/fgene.2022.921286. eCollection 2022. Front Genet. 2022. PMID: 35656321 Free PMC article.
Abstract
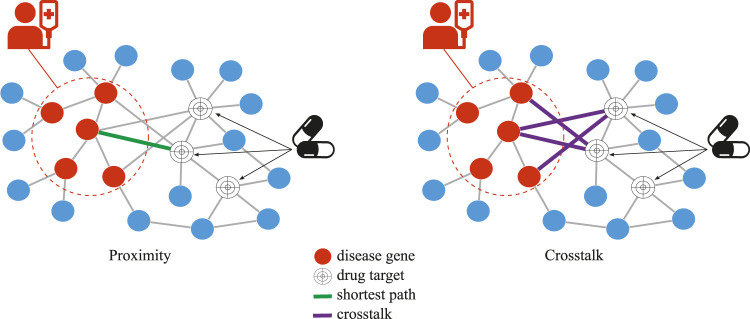
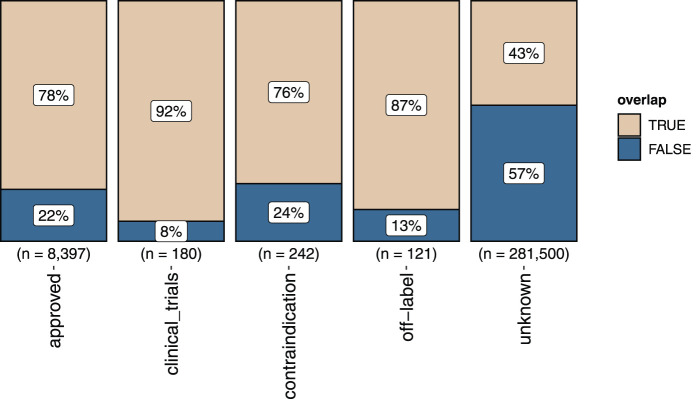
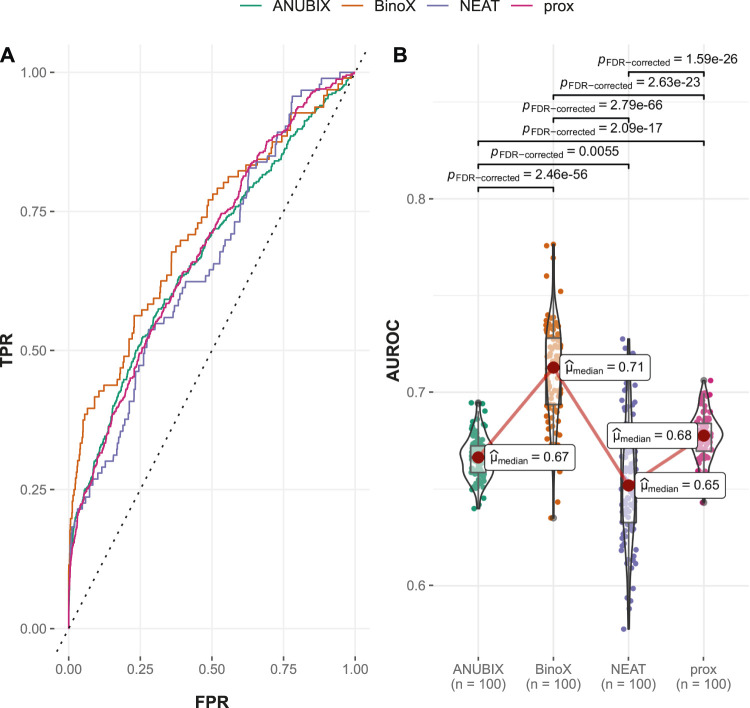
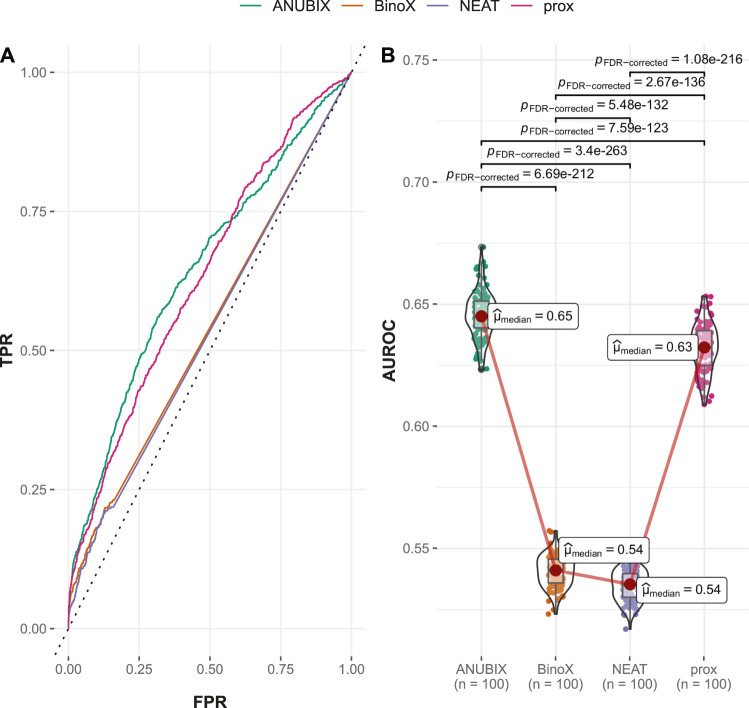
The need for systematic drug repurposing has seen a steady increase over the past decade and may be particularly valuable to quickly remedy unexpected pandemics. The abundance of functional interaction data has allowed mapping of substantial parts of the human interactome modeled using functional association networks, favoring network-based drug repurposing. Network crosstalk-based approaches have never been tested for drug repurposing despite their success in the related and more mature field of pathway enrichment analysis. We have, therefore, evaluated the top performing crosstalk-based approaches for drug repurposing. Additionally, the volume of new interaction data as well as more sophisticated network integration approaches compelled us to construct a new benchmark for performance assessment of network-based drug repurposing tools, which we used to compare network crosstalk-based methods with a state-of-the-art technique. We find that network crosstalk-based drug repurposing is able to rival the state-of-the-art method and in some cases outperform it.
Keywords: benchmark; drug repositioning; drug repurposing; functional association network; network crosstalk; network-based; shortest path.
Copyright © 2022 Guala and Sonnhammer.
Conflict of interest statement
The authors declare that the research was conducted in the absence of any commercial or financial relationships that could be construed as a potential conflict of interest.
Figures
Similar articles
-
Corrigendum: Network Crosstalk as a Basis for Drug Repurposing.Front Genet. 2022 May 16;13:921286. doi: 10.3389/fgene.2022.921286. eCollection 2022. Front Genet. 2022. PMID: 35656321 Free PMC article.
-
DRviaSPCN: a software package for drug repurposing in cancer via a subpathway crosstalk network.Bioinformatics. 2022 Oct 31;38(21):4975-4977. doi: 10.1093/bioinformatics/btac611. Bioinformatics. 2022. PMID: 36066432
-
A drug repurposing method based on inhibition effect on gene regulatory network.Comput Struct Biotechnol J. 2023 Sep 9;21:4446-4455. doi: 10.1016/j.csbj.2023.09.007. eCollection 2023. Comput Struct Biotechnol J. 2023. PMID: 37731599 Free PMC article.
-
Repurposing Drugs via Network Analysis: Opportunities for Psychiatric Disorders.Pharmaceutics. 2022 Jul 14;14(7):1464. doi: 10.3390/pharmaceutics14071464. Pharmaceutics. 2022. PMID: 35890359 Free PMC article. Review.
-
Harnessing Drug Repurposing for Exploration of New Diseases: An Insight to Strategies and Case Studies.Curr Mol Med. 2021;21(2):111-132. doi: 10.2174/1566524020666200619125404. Curr Mol Med. 2021. PMID: 32560606 Review.
Cited by
-
Computational Drug Repositioning in Cardiorenal Disease: Opportunities, Challenges, and Approaches.Proteomics. 2025 Jun;25(11-12):e202400109. doi: 10.1002/pmic.202400109. Epub 2025 Jan 31. Proteomics. 2025. PMID: 39888210 Free PMC article. No abstract available.
-
Strategies for robust, accurate, and generalizable benchmarking of drug discovery platforms.bioRxiv [Preprint]. 2024 Dec 16:2024.12.10.627863. doi: 10.1101/2024.12.10.627863. bioRxiv. 2024. PMID: 39764006 Free PMC article. Preprint.
References
-
- Benjamini Y., Hochberg Y. (1995). Controlling the False Discovery Rate: A Practical and Powerful Approach to Multiple Testing. J. R. Stat. Soc. Ser. B (Methodological) 57, 289–300. 10.1111/j.2517-6161.1995.tb02031.x - DOI
LinkOut - more resources
Full Text Sources
Miscellaneous