

Integrative Analysis of Gene Expression and DNA Methylation Depicting the Impact of Obesity on Breast Cancer
- PMID: 35350384
- PMCID: PMC8957964
- DOI: 10.3389/fcell.2022.818082
Integrative Analysis of Gene Expression and DNA Methylation Depicting the Impact of Obesity on Breast Cancer
Abstract
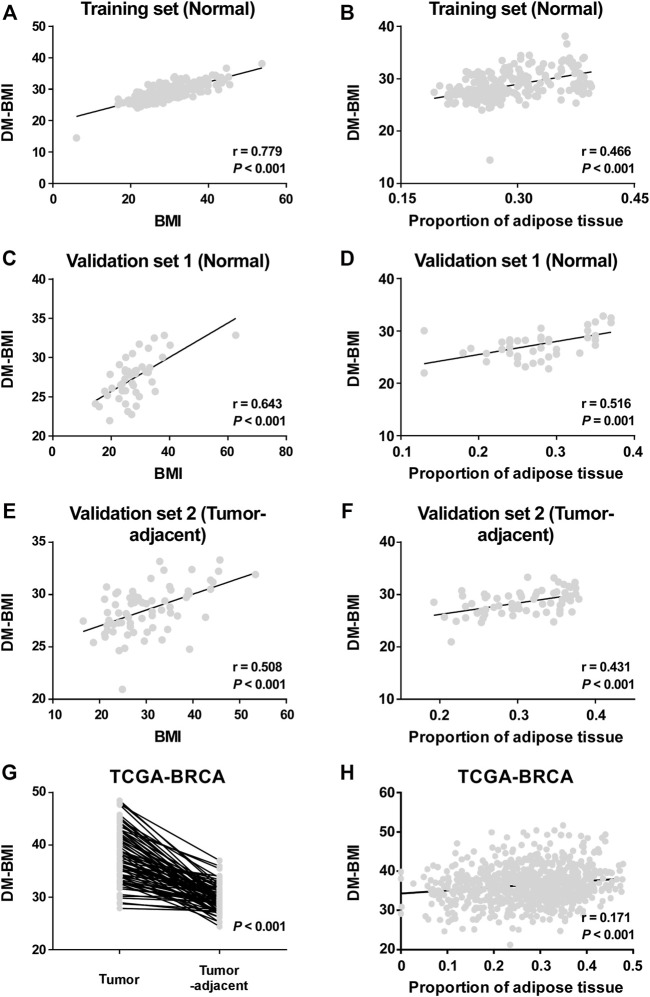
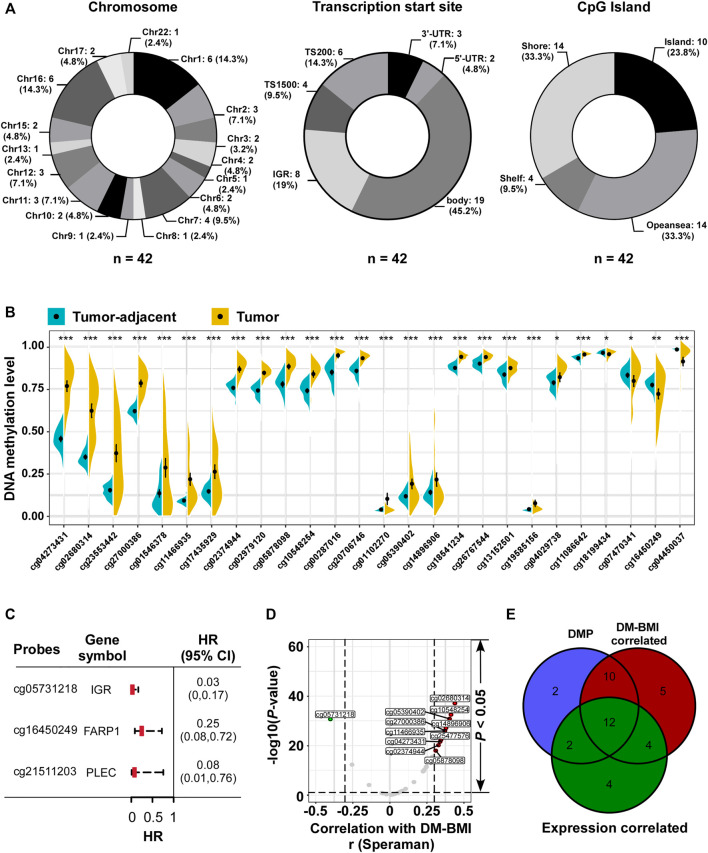
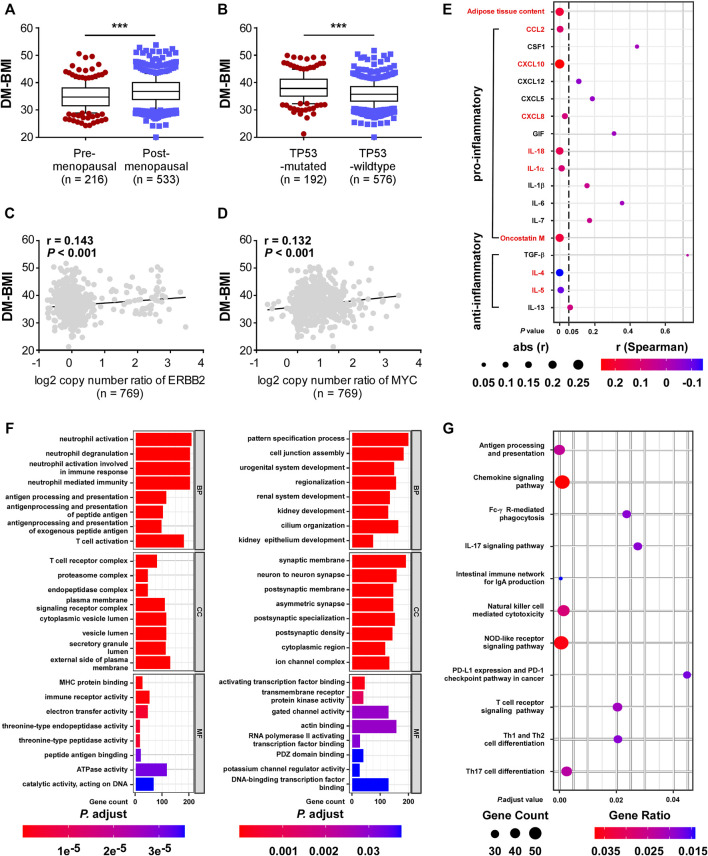
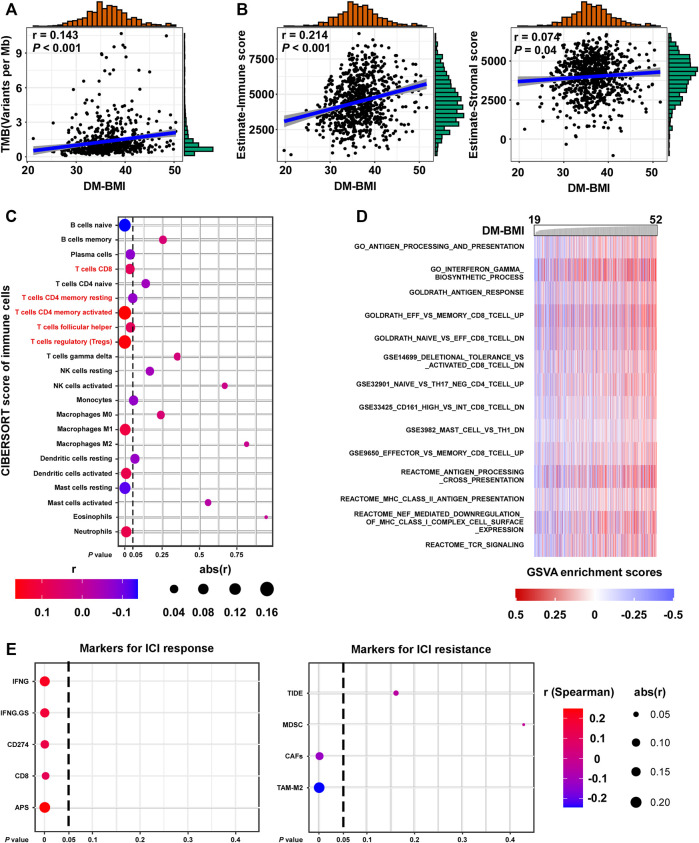
Obesity has been reported to be a risk factor for breast cancer, but how obesity affects breast cancer (BC) remains unclear. Although body mass index (BMI) is the most commonly used reference for obesity, it is insufficient to evaluate the obesity-related pathophysiological changes in breast tissue. The purpose of this study is to establish a DNA-methylation-based biomarker for BMI (DM-BMI) and explore the connection between obesity and BC. Using DNA methylation data from The Cancer Genome Atlas (TCGA) and Gene Expression Omnibus (GEO), we developed DM-BMI to evaluate the degree of obesity in breast tissues. In tissues from non-BC and BC population, the DM-BMI model exhibited high accuracy in BMI prediction. In BC tissues, DM-BMI correlated with increased adipose tissue content and BC tissues with increased DM-BMI exhibited higher expression of pro-inflammatory adipokines. Next, we identified the gene expression profile relating to DM-BMI. Using Gene Ontology (GO) and the Kyoto Encyclopedia of Genes and Genomes (KEGG) database, we observed that the DM-BMI-related genes were mostly involved in the process of cancer immunity. DM-BMI is positively correlated with T cell infiltration in BC tissues. Furthermore, we observed that DM-BMI was positively correlated with immune checkpoint inhibitors (ICI) response markers in BC. Collectively, we developed a new biomarker for obesity and discovered that BC tissues from obese individuals exhibit an increased degree of immune cell infiltration, indicating that obese BC patients might be the potential beneficiaries for ICI treatment.
Keywords: DNA methylation; biomarker; breast cancer; immune checkpoint inhibitor; obesity.
Copyright © 2022 Xiong, Li, Yang, WU, Xie, Xu and Xie.
Conflict of interest statement
The authors declare that the research was conducted in the absence of any commercial or financial relationships that could be construed as a potential conflict of interest.
Figures
Similar articles
-
A Prognostic Model for Breast Cancer Based on Cancer Incidence-Related DNA Methylation Pattern.Front Genet. 2022 Jan 3;12:814480. doi: 10.3389/fgene.2021.814480. eCollection 2021. Front Genet. 2022. PMID: 35047022 Free PMC article.
-
Identification of DRP1 as a prognostic factor correlated with immune infiltration in breast cancer.Int Immunopharmacol. 2020 Dec;89(Pt B):107078. doi: 10.1016/j.intimp.2020.107078. Epub 2020 Oct 10. Int Immunopharmacol. 2020. PMID: 33049497
-
Expression and potential molecular mechanisms of miR‑204‑5p in breast cancer, based on bioinformatics and a meta‑analysis of 2,306 cases.Mol Med Rep. 2019 Feb;19(2):1168-1184. doi: 10.3892/mmr.2018.9764. Epub 2018 Dec 14. Mol Med Rep. 2019. PMID: 30569120 Free PMC article.
-
Obesity and breast cancer: not only a risk factor of the disease.Curr Treat Options Oncol. 2015 May;16(5):22. doi: 10.1007/s11864-015-0341-9. Curr Treat Options Oncol. 2015. PMID: 25904412 Review.
-
Impact of Physical Activity on DNA Methylation Signatures in Breast Cancer Patients: A Systematic Review with Bioinformatic Analysis.Cancers (Basel). 2024 Sep 3;16(17):3067. doi: 10.3390/cancers16173067. Cancers (Basel). 2024. PMID: 39272925 Free PMC article. Review.
Cited by
-
Epigenetic modifications in obesity-associated diseases.MedComm (2020). 2024 Feb 24;5(2):e496. doi: 10.1002/mco2.496. eCollection 2024 Feb. MedComm (2020). 2024. PMID: 38405061 Free PMC article. Review.
-
Value of altered methylation patterns of genes RANBP3, LCP2 and GRAP2 in cfDNA in breast cancer diagnosis.J Med Biochem. 2024 Jun 15;43(4):387-396. doi: 10.5937/jomb0-47507. J Med Biochem. 2024. PMID: 39139156 Free PMC article.
-
The association between body mass index and molecular subtypes in endometrial carcinoma.Gynecol Oncol Rep. 2024 Jul 1;54:101447. doi: 10.1016/j.gore.2024.101447. eCollection 2024 Aug. Gynecol Oncol Rep. 2024. PMID: 39055290 Free PMC article.
-
Death receptors 4/5 mediate tumour sensitivity to natural killer cell-mediated cytotoxicity in mismatch repair deficient colorectal cancer.Br J Cancer. 2024 Jul;131(2):334-346. doi: 10.1038/s41416-024-02673-z. Epub 2024 May 25. Br J Cancer. 2024. PMID: 38796599 Free PMC article.
-
DNA Methylation-Based Diagnosis and Treatment of Breast Cancer.Curr Cancer Drug Targets. 2025;25(1):26-37. doi: 10.2174/0115680096278978240204162353. Curr Cancer Drug Targets. 2025. PMID: 38441008 Review.
References
LinkOut - more resources
Full Text Sources