

Comparison of Cecal Microbiota and Performance Indices Between Lean-Type and Fatty-Type Pekin Ducks
- PMID: 35350611
- PMCID: PMC8957900
- DOI: 10.3389/fmicb.2022.820569
Comparison of Cecal Microbiota and Performance Indices Between Lean-Type and Fatty-Type Pekin Ducks
Abstract
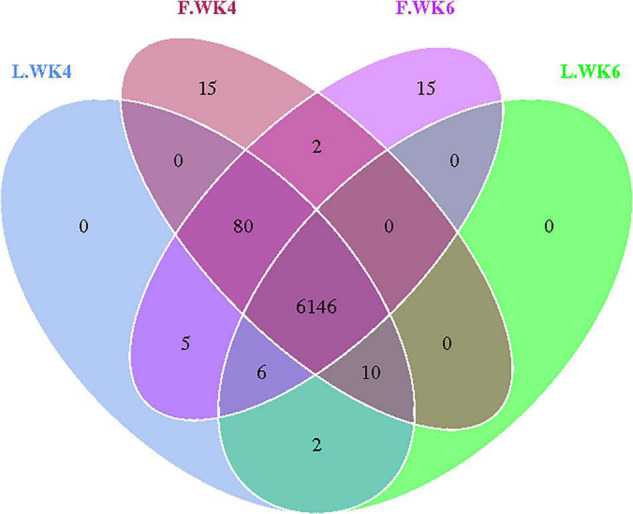
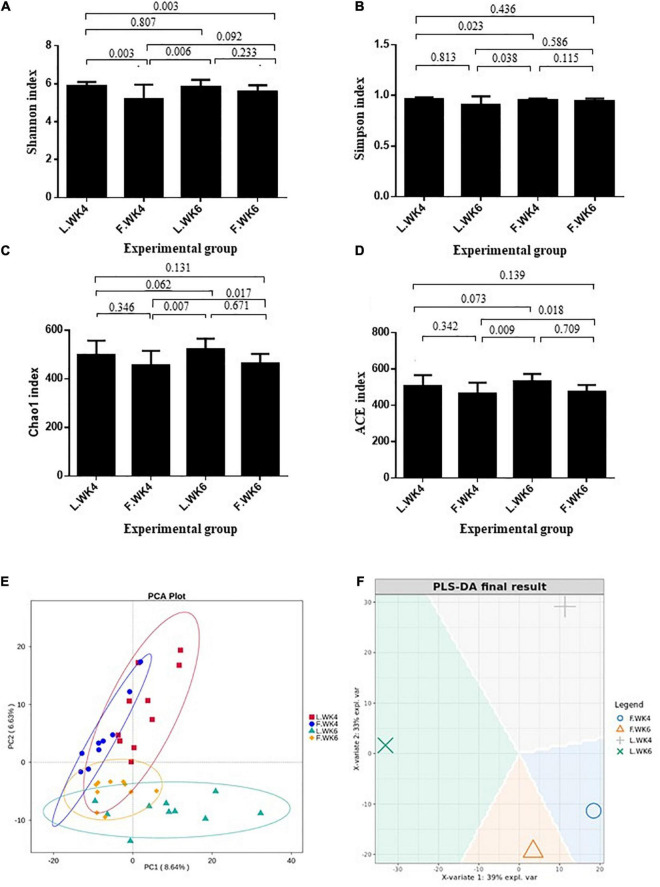
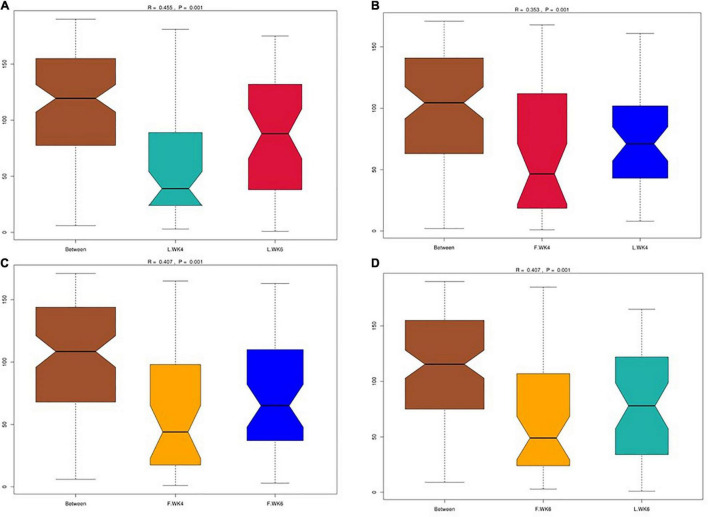
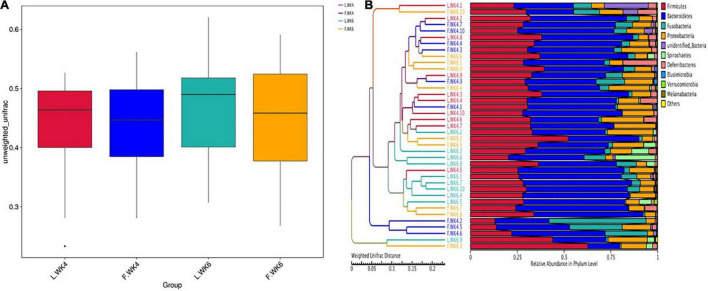
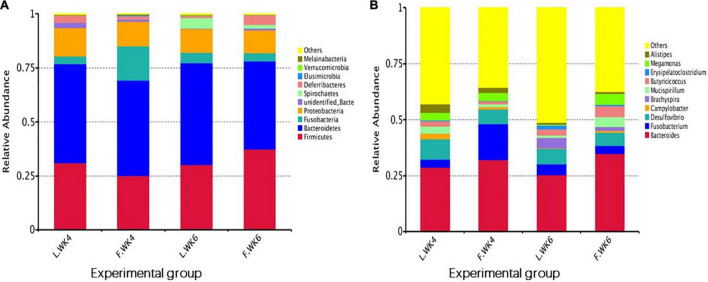
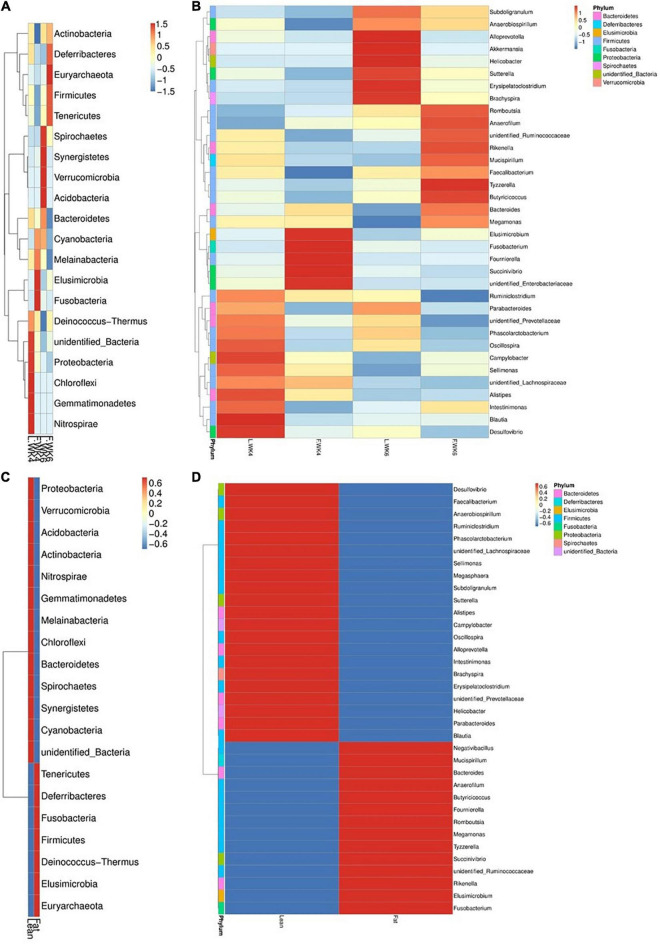
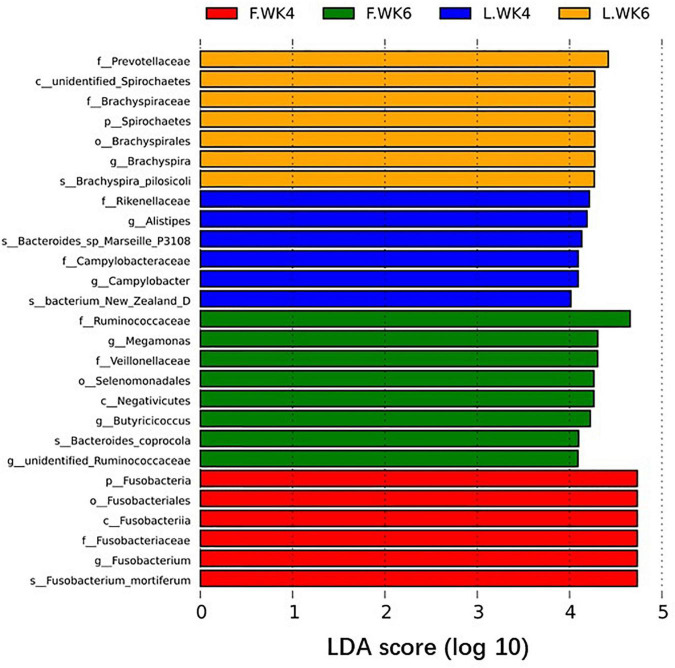
Fatty-type (FT) Pekin ducks exhibit higher lipid deposition than lean-type (LT) ducks. The gut microbiota plays an important role in modulating fat metabolism. We compared the growth performance, slaughter performance, and cecal microbiota of FT and LT Pekin ducks and analyzed the role of cecal microbiota in lipid deposition in Pekin ducks. A total of 140 1-day-old FT and LT Pekin ducks with similar body weights were randomly assigned to 10 cages, with 14 ducks in each replicate. All ducks were fed commercial diets from 28 to 42 days of age. Results showed that the average body weight and feed intake of FT ducks were higher than those of LT ducks. The breast muscle and eviscerated percentages of LT ducks were higher than those of FT ducks; the abdominal fat and sebum percentages of LT ducks were lower than those of FT ducks at 6 weeks of age (P < 0.01). 16S DNA sequencing of the cecal microbiota revealed that the bacterial abundance differed between FT and LT ducks at 4 and 6 weeks of age. The abundance of Firmicutes was higher, while that of Fusobacteria and Fusobacterium was lower in LT ducks than in FT ducks at 4 weeks of age. The abundance of Spirochaetes was higher, while that of Firmicutes and Bacteroides was lower in LT ducks than in FT ducks at 6 weeks of age. The abundance of Spirochaetes and Brachyspira in LT ducks was higher at 6 weeks than at 4 weeks of age. Interestingly, the abundance of Firmicutes and Bacteroides in FT ducks was higher at 6 weeks of age than at 4 weeks of age, while that of Fusobacteria and Fusobacterium was lower at 6 weeks than at 4 weeks of age. Linear discriminant analysis effect size analysis showed that Spirochaetes, Brachyspira, Alistipes, Campylobacter, Megamonas, Butyricicoccus, and Fusobacteria may be involved in the fat metabolism pathway as specific markers. We reveal the differences in microbial abundance in the cecal microbiota between FT and LT Pekin ducks and provide an insight into the role of cecal microbiota in lipid deposition in Pekin ducks.
Keywords: Pekin duck; cecal microbiota; fat deposition; fatty-type; growth performance; lean-type; plasma biochemical index; slaughter percentage.
Copyright © 2022 Yang, Jiang, Tang, Chang, Zhao, Hou and Chen.
Conflict of interest statement
The authors declare that the research was conducted in the absence of any commercial or financial relationships that could be construed as a potential conflict of interest.
Figures


Similar articles
-
Temporal variation in production performance, biochemical and oxidative stress markers, and gut microbiota in Pekin ducks during the late growth stage.Poult Sci. 2024 Sep;103(9):103894. doi: 10.1016/j.psj.2024.103894. Epub 2024 May 30. Poult Sci. 2024. PMID: 39013293 Free PMC article.
-
Cecal Microbiota Modulates Fat Deposition in Muscovy Ducks.Front Vet Sci. 2021 Mar 31;8:609348. doi: 10.3389/fvets.2021.609348. eCollection 2021. Front Vet Sci. 2021. PMID: 33869315 Free PMC article.
-
Integrated omics analysis reveals the differentiation of intestinal microbiota and metabolites between Pekin ducks and Shaoxing ducks.Poult Sci. 2024 Sep;103(9):103976. doi: 10.1016/j.psj.2024.103976. Epub 2024 Jun 23. Poult Sci. 2024. PMID: 39024692 Free PMC article.
-
Effect of Dietary Bacillus licheniformis Supplementation on Growth Performance and Microbiota Diversity of Pekin Ducks.Front Vet Sci. 2022 Feb 21;9:832141. doi: 10.3389/fvets.2022.832141. eCollection 2022. Front Vet Sci. 2022. PMID: 35265695 Free PMC article.
-
Effects of Fatty-Type and Lean-Type on Growth Performance and Lipid Droplet Metabolism in Pekin Ducks.Animals (Basel). 2022 Sep 1;12(17):2268. doi: 10.3390/ani12172268. Animals (Basel). 2022. PMID: 36077988 Free PMC article.
Cited by
-
Association of residual feed intake with intestinal microbiome and metabolome in laying period of ducks.Front Microbiol. 2023 May 12;14:1138914. doi: 10.3389/fmicb.2023.1138914. eCollection 2023. Front Microbiol. 2023. PMID: 37250027 Free PMC article.
-
Temporal variation in production performance, biochemical and oxidative stress markers, and gut microbiota in Pekin ducks during the late growth stage.Poult Sci. 2024 Sep;103(9):103894. doi: 10.1016/j.psj.2024.103894. Epub 2024 May 30. Poult Sci. 2024. PMID: 39013293 Free PMC article.
-
Distribution of bacteria in different regions of the small intestine with Zanthoxylum bungeanum essential oil supplement in small-tailed Han sheep.Front Microbiol. 2022 Dec 23;13:1062077. doi: 10.3389/fmicb.2022.1062077. eCollection 2022. Front Microbiol. 2022. PMID: 36619991 Free PMC article.
-
Unlocking the Potential of Paper Mulberry Powder in Cherry Valley Ducks: Impacts on Growth, Serum Biochemistry, and Cecum Microbiome.Animals (Basel). 2025 May 30;15(11):1602. doi: 10.3390/ani15111602. Animals (Basel). 2025. PMID: 40509068 Free PMC article.
-
The Impact of Early-Life Cecal Microbiota Transplantation on Social Stress and Injurious Behaviors in Egg-Laying Chickens.Microorganisms. 2024 Feb 26;12(3):471. doi: 10.3390/microorganisms12030471. Microorganisms. 2024. PMID: 38543522 Free PMC article. Review.
References
LinkOut - more resources
Full Text Sources