. 2022 Mar 8:13:799546.
doi: 10.3389/fmicb.2022.799546. eCollection 2022.

In vitro Evaluation of Antiviral Efficacy of a Standardized Hydroalcoholic Extract of Poplar Type Propolis Against SARS-CoV-2

Affiliations

In vitro Evaluation of Antiviral Efficacy of a Standardized Hydroalcoholic Extract of Poplar Type Propolis Against SARS-CoV-2

Giuseppe Sberna et al. Front Microbiol. .

Abstract

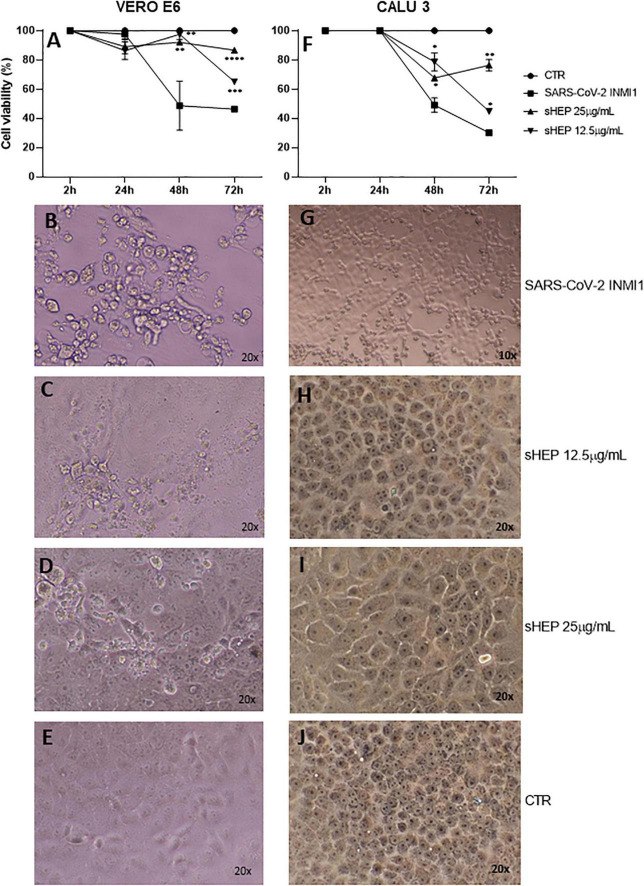
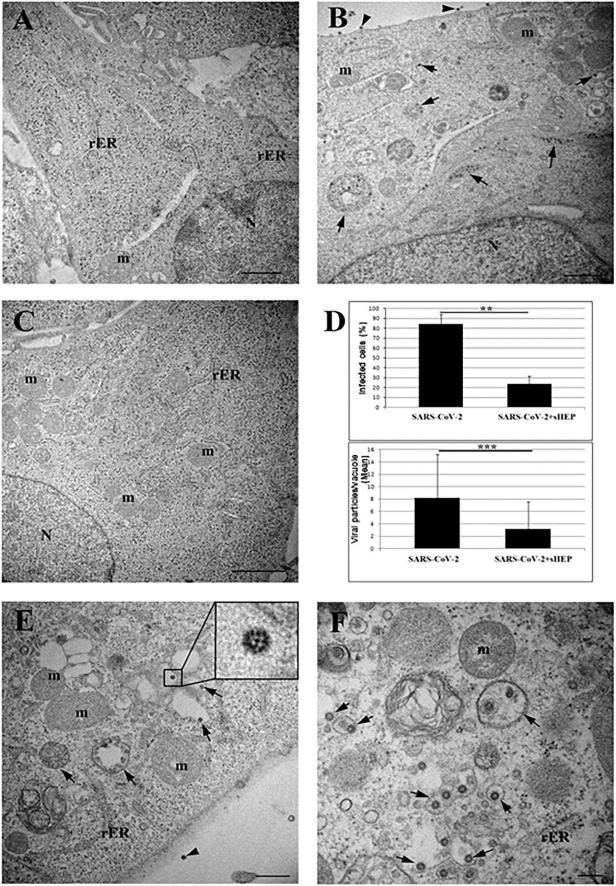
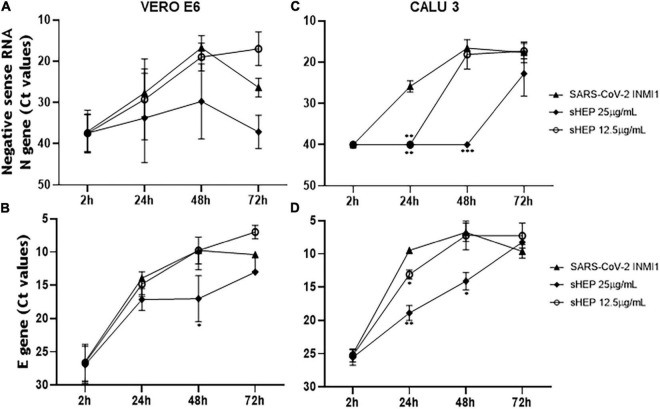
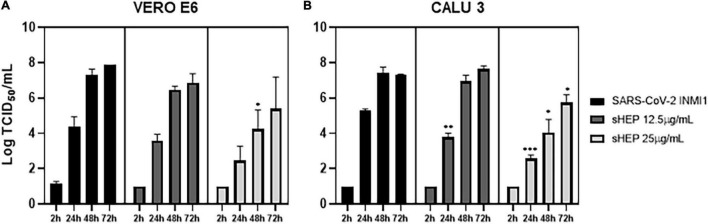
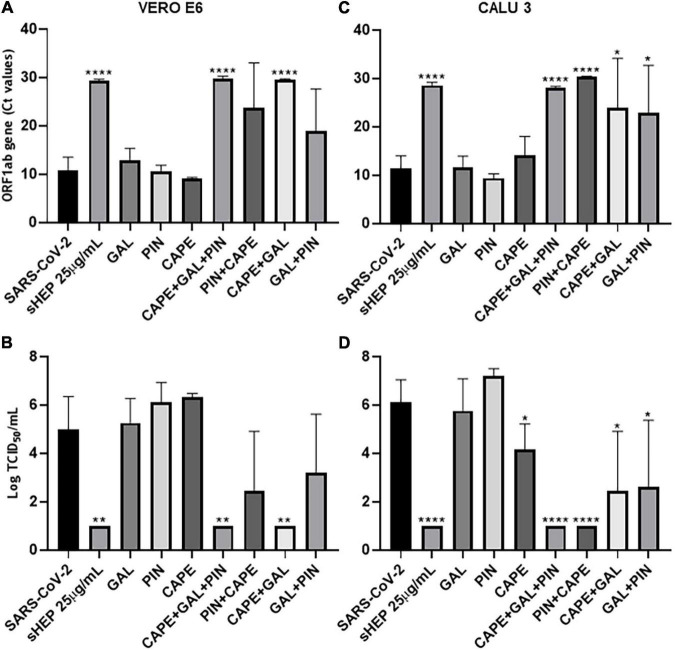
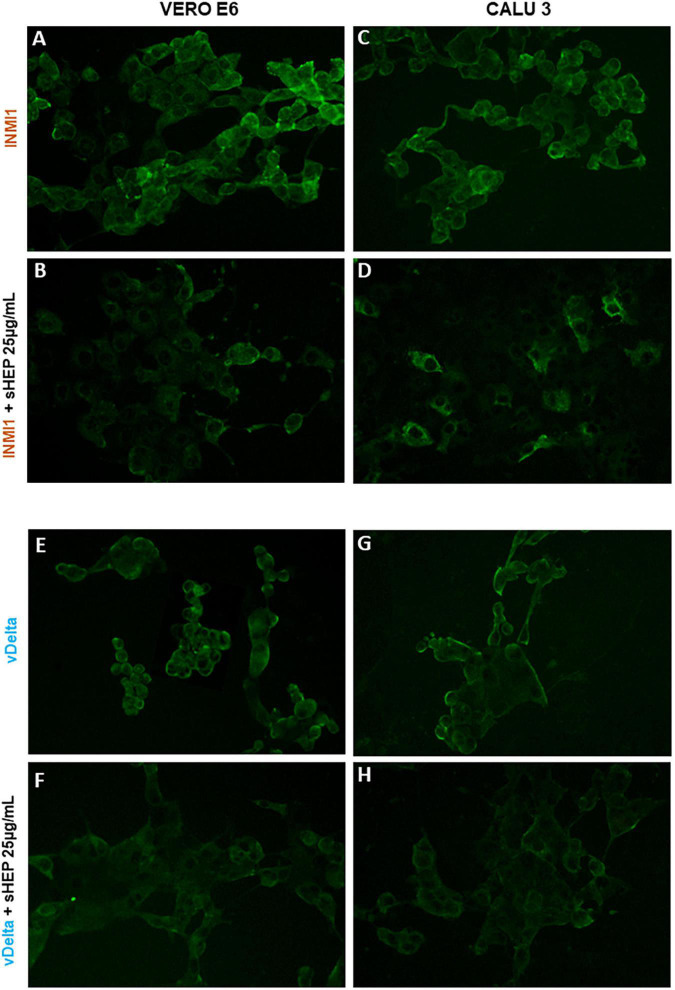
Except for specific vaccines and monoclonal antibodies, effective prophylactic or post-exposure therapeutic treatments are currently limited for COVID-19. Propolis, a honeybee's product, has been suggested as a potential candidate for treatment of COVID-19 for its immunomodulatory properties and for its powerful activity against various types of viruses, including common coronaviruses. However, direct evidence regarding the antiviral activities of this product still remains poorly documented. VERO E6 and CALU3 cell lines were infected with SARS-CoV-2 and cultured in the presence of 12.5 or 25 μg/ml of a standardized Hydroalcoholic Extract acronym (sHEP) of Eurasian poplar type propolis and analyzed for viral RNA transcription, for cell damage by optical and electron microscopy, and for virus infectivity by viral titration at 2, 24, 48, and 72 h post-infection. The three main components of sHEP, caffeic acid phenethyl ester, galangin, and pinocembrin, were tested for the antiviral power, either alone or in combination. On both cell lines, sHEP showed significant effects mainly on CALU3 up to 48 h, i.e., some protection from cytopathic effects and consistent reduction of infected cell number, fewer viral particles inside cellular vesicles, reduction of viral titration in supernatants, dramatic drop of N gene negative sense RNA synthesis, and lower concentration of E gene RNA in cell extracts. Interestingly, pre-treatment of cells with sHEP before virus inoculation induced these same effects described previously and was not able to block virus entry. When used in combination, the three main constituents of sHEP showed antiviral activity at the same levels of sHEP. sHEP has a remarkable ability to hinder the replication of SARS-CoV-2, to limit new cycles of infection, and to protect host cells against the cytopathic effect, albeit with rather variable results. However, sHEP do not block the virus entry into the cells. The antiviral activity observed with the three main components of sHEP used in combination highlights that the mechanism underlying the antiviral activity of sHEP is probably the result of a synergistic effect. These data add further emphasis on the possible therapeutic role of this special honeybee's product as an adjuvant to official treatments of COVID-19 patients for its direct antiviral activity.

Keywords: COVID-19; COVID-19 treatment; SARS-CoV-2; pandemic (COVID-19); propolis.


Conflict of interest statement

The authors declare that the research was conducted in the absence of any commercial or financial relationships that could be construed as a potential conflict of interest.

Figures

FIGURE 1
FIGURE 1
Effects of sHEP addition in the medium of culture of SARS-CoV-2 infected VERO E6 and CALU3. Panels (A,F) VERO E6 and CALU3 cell viability was measured with CellTiter-Glo ® Luminescent Cell Viability Assay. After SARS-CoV-2 infection (MOI0.001) for l h at 37°C and sHEP addition in the culture medium, cell viability was assessed at each indicated time points and compared with that of control infected cells. Data points represent the mean (+SD) of three independent experiments. Panels (B–D) and panels (G–I) show light microscopy images of VERO E6 and CALU 3 cell lines, respectively, 48 h after SARS-CoV-2 infection and culture in presence of sHEP at indicated concentrations. Panels (E,J) refer to control uninfected cells. The asterisks indicate statistically significant differences determined by Student’s t-test (****p < 0.0001; ***p < 0.001; **p < 0.01; *p < 0.05; no asterisk, p ≥ 0.05) between infected cell and those infected and cultured in presence of sHEP.
FIGURE 2
FIGURE 2
Electron microscopy ultrastructure features of SARS-CoV-2-hfected VERO E6 cells treated with sHEP. Panel (A) the image shows the typical morphology of VERO E6 cells after 24 h culturing in presence of sHEP 25 μg/mL. No signs of ultrastructural alterations were evident. Panel (B) SARS-CoV-2 infected VERO E6 cell: arrows point to membrane bound vacuoles containing numerous viral particles. Mature viral particles are visible at the cell surface (arrowheads). Panel (C) among infected VERO E6 cultured in presence of sHEP 25 μg/mL, numerous uninfected cells were observed showing normal intracellular morphology and no sign of viral presence, as here shown. Panel (D) percentage of infected cells (top graph) and mean number of viral particles counted within vesicles (bottom graph) measured in infected cultures were compared to those observed among cultures infected and treated with 25 μg/mL sHEP (SARS-CoV-2 + sHEP). The differences were significant. Data reported as means values ± SD (**p < 0.01; ***p < 0.001; no asterisk, p ≥ 0.05). Panel (E) sHEP 25 μg/mL treated SARS-CoV-2 infected cell. Arrows point to membrane bound vacuoles containing typical viral particles. Mature viral particle is visible at the cell surface (arrowhead). Higher magnification of viral particle is visible in the boxed area: black dots are visible inside the viral particles due to cross section through the nucleocapside. Panel (F) higher magnification of an infected cell showing numerous single virions, or small group of virions, enclosed in single membrane vacuoles (arrows). N, nucleus; m, mitochondrion; rER, rough endoplasmic reticulum. Scale bars: A,B = l μm; C = 2 μm; E = 500 nm; F = 200 nm.
FIGURE 3
FIGURE 3
Kinetics of intracellular SARS-CoV-2 N and E genes expression in VERO E6 and CALU3. After viral infection, sHEP was added at 12.5 or 25 μg/mL and SARS-CoV-2 N and E genes RNA transcripts expression was evaluated at indicated time points by real-time RT-PCR. Panels (A,C) Ct values refer to negative sense RNA transcripts for N gene detected in VERO E6 and CALU3 cell extracts, respectively. Panel (A) in VERO E6, no significant differences were observed. Panel (C) in CALU3, the negative sense RNA transcript levels of the N gene were significantly lower at 24 h p.i. (p = 0.0024) and at 48 h p.i. (p = 0.0002) with 25 μg/mL sHEP, with respect to untreated but infected cells. Panels (B,D) Ct values of E gene RNA detected in VERO E6 and CALU3 cell extracts, respectively. Panel (B) in VERO E6, E gene was significantly lower at 48 h p.i. (p = 0.05) Panel (D) accordingly, E gene RNA transcripts in CALU3 were also significantly lower at 24 h and 48 h p.i. (p = 0.066, and p = 0.0302, respectively). Data points represent the mean (±SD) of three independent experiments, each performed in quadruplicate. The asterisks indicate statistically significant differences determined by Student’s t-test (***p < 0.001, **p < 0.01; *p < 0.05; no asterisk, p ≥ 0.05) between infected cells and those infected and cultured in presence of sHEP.
FIGURE 4
FIGURE 4
Effects of sHEP on SAR-CoV-2 yield in SNs of VERO E6 and CALU3 cell lines. Panels (A,B) SARS-CoV-2 titration (Log TCID50/mL) in SNs of VERO E6 and CALU3, respectively, after infection and culturing in presence of 12.5 or 25 μg/mL sHEP or medium alone was measured at indicated time points. Data represent the mean (+SD) of three independent experiments. Virus titration was performed on VERO E6 cell line by limiting dilution assay; the viral titer was calculated using the method of Reed and Muench and expressed as tissue culture infectious dose TCID50/mL. The asterisks indicate statistically significant differences determined by Student’s t-test (***, p < 0.001, **, p < 0.01; *p < 0.05; no asterisk, p ≥ 0.05) between Infected cells and those infected and cultured in presence of sHEP.
FIGURE 5
FIGURE 5
Ability of the three main components of sHEP, the Caffeic Acid Phenethyl Ester (CAPE), the Galangin (GAL), and the Pinocembrin (PIN), to reduce viral replication on infected VERO E6 and CALU 3 cells. The three components of sHEP where added to the culture medium of VERO E6 and CALU 3 after virus inoculation, at the same concentration they were contained in sHEP. The sHEP components were tested singly (CAPE or GAL or PIN), or in combination two by two (CAPE + GAL; GAL + PIN; CAPE + PIN), or all together (CAPE + GAL + PIN), as indicated in the graphs; as a reference, the values measured in the presence of sHEP (sHEP 25 μg/mL) or the SARS-CoV-2 INMI1 alone (SARS-CoV-2) were also shown. After 48 h of culture, viral yield and virus titration in SNs were analyzed. Panels (A,C): viral yield (expressed as Ct values of ORF1ab gene transcripts) observed in SNs of VERO E6 and CALU3, respectively. Panels (B,D): virus titration (expressed as Tissue Culture Infectious Dose TCID50/mL) measured in SNs of VERO E6 and CALU3, respectively. Data represent the mean (±SD) of three independent experiments. The asterisks indicate statistically significant differences determined by Student’s t-test (****p < 0.0001, **p < 0.01; *p < 0.05; no asterisk, p ≥ 0.05) between infected cells and those infected and cultured in presence of sHEP or components used singly or in combination.
FIGURE 6
FIGURE 6
Immunofluorescence staining for SARS-CoV-2 of VERO E6 and GALU 3 cells 48 h post-infection with INMI1 or vDelta and treated with sHEP. Panels (A,C): VERO E6 and CALU 3 infected with INMI1, respectively; Panels (B,D) show these same cells respectively, infected with INMI1 and incubated with sHEP 25 μg/mL for 48 h. Panels (E,G) refer to VERO E6 and CALU 3 after 48 h infection with vDelta; Panels (F,H) show the same cells respectively, infected with vDelta and treated with sHEP 25 μg/mL. The staining with human anti-SARS-CoV-2 antibodies illustrates the difference in fluorescence intensity between cells infected and those infected and then incubated in presence of sHEP. Magnification: 20X.

Similar articles

Cited by

References

    1. Al Naggar Y., Giesy J. P., Abdel-Daim M. M., Javed Ansari M., Al-Kahtani S. N., Yahya G. (2021). Fighting against the second wave of COVID-19: can honeybee products help protect against the pandemic? Saud. J. Biol. Sci. 28 1519–1527. 10.1016/j.sjbs.2020.12.031 - DOI - PMC - PubMed
    1. Ali A. M., Kunugi H. (2021). Propolis, bee honey, and their components protect against coronavirus disease 2019 (COVID-19): a review of in silico, in vitro, and clinical studies. Molecules 26:1232. 10.3390/molecules26051232 - DOI - PMC - PubMed
    1. Bachevski D., Damevska K., Simeonovski V., Dimova M. (2020). Back to the basics: propolis and COVID-19. Dermatol. Ther. 33:e13780. 10.1111/dth.13780 - DOI - PMC - PubMed
    1. Bellegrandi S., D’Offizi G., Ansotegui I. J., Ferrara R., Scala E., Paganelli R. (1996). Propolis allergy in an HIV-positive patient. J. Am. Acad. Dermatol. 35:644. 10.1016/s0190-9622(96)90702-1 - DOI - PubMed
    1. Berretta A. A., Arruda C., Miguel F., Baptista N., Nascimento A., Marquele- Oliveira F., et al. (2017). “Functional properties of Brazilian propolis: from chemical composition until the market,” in Superfood and Functional Food - An Overview of Their Processing and Utilization, ed. Waisundara V. (London: Intech Open; ), 55–98.