

Linkages Among Dissolved Organic Matter Export, Dissolved Metabolites, and Associated Microbial Community Structure Response in the Northwestern Sargasso Sea on a Seasonal Scale
- PMID: 35350629
- PMCID: PMC8957919
- DOI: 10.3389/fmicb.2022.833252
Linkages Among Dissolved Organic Matter Export, Dissolved Metabolites, and Associated Microbial Community Structure Response in the Northwestern Sargasso Sea on a Seasonal Scale
Abstract
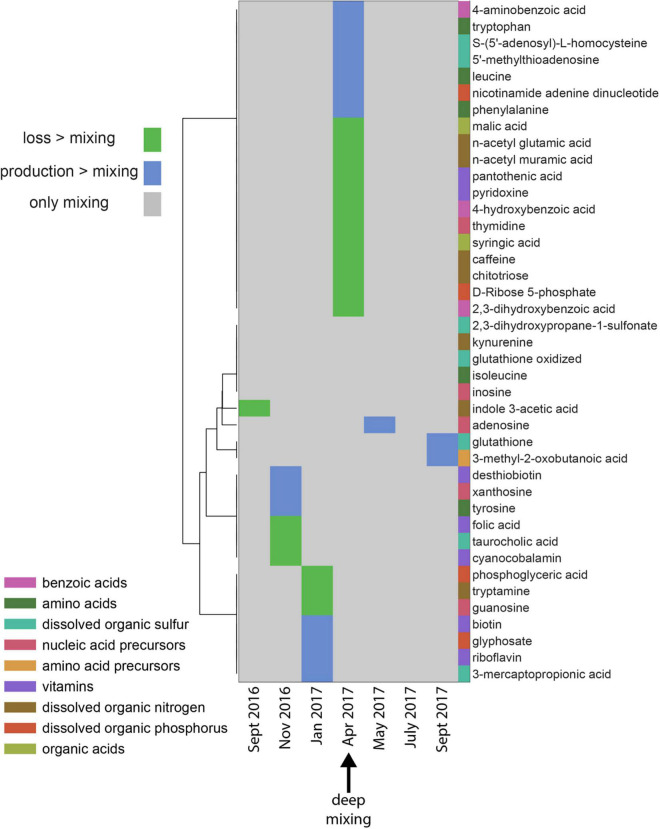
Deep convective mixing of dissolved and suspended organic matter from the surface to depth can represent an important export pathway of the biological carbon pump. The seasonally oligotrophic Sargasso Sea experiences annual winter convective mixing to as deep as 300 m, providing a unique model system to examine dissolved organic matter (DOM) export and its subsequent compositional transformation by microbial oxidation. We analyzed biogeochemical and microbial parameters collected from the northwestern Sargasso Sea, including bulk dissolved organic carbon (DOC), total dissolved amino acids (TDAA), dissolved metabolites, bacterial abundance and production, and bacterial community structure, to assess the fate and compositional transformation of DOM by microbes on a seasonal time-scale in 2016-2017. DOM dynamics at the Bermuda Atlantic Time-series Study site followed a general annual trend of DOC accumulation in the surface during stratified periods followed by downward flux during winter convective mixing. Changes in the amino acid concentrations and compositions provide useful indices of diagenetic alteration of DOM. TDAA concentrations and degradation indices increased in the mesopelagic zone during mixing, indicating the export of a relatively less diagenetically altered (i.e., more labile) DOM. During periods of deep mixing, a unique subset of dissolved metabolites, such as amino acids, vitamins, and benzoic acids, was produced or lost. DOM export and compositional change were accompanied by mesopelagic bacterial growth and response of specific bacterial lineages in the SAR11, SAR202, and SAR86 clades, Acidimicrobiales, and Flavobacteria, during and shortly following deep mixing. Complementary DOM biogeochemistry and microbial measurements revealed seasonal changes in DOM composition and diagenetic state, highlighting microbial alteration of the quantity and quality of DOM in the ocean.
Keywords: Sargasso Sea; amino acids; bacterioplankton; dissolved organic matter; metabolites; mixing; seasonal.
Copyright © 2022 Liu, Longnecker, Kujawinski, Vergin, Bolaños, Giovannoni, Parsons, Opalk, Halewood, Hansell, Johnson, Curry and Carlson.
Conflict of interest statement
KV was employed by Microbial DNA Analytics. The remaining authors declare that the research was conducted in the absence of any commercial or financial relationships that could be construed as a potential conflict of interest.
Figures


Similar articles
-
The Seasonal Flux and Fate of Dissolved Organic Carbon Through Bacterioplankton in the Western North Atlantic.Front Microbiol. 2021 Jun 18;12:669883. doi: 10.3389/fmicb.2021.669883. eCollection 2021. Front Microbiol. 2021. PMID: 34220753 Free PMC article.
-
Stable Isotope Probing Identifies Bacterioplankton Lineages Capable of Utilizing Dissolved Organic Matter Across a Range of Bioavailability.Front Microbiol. 2020 Oct 7;11:580397. doi: 10.3389/fmicb.2020.580397. eCollection 2020. Front Microbiol. 2020. PMID: 33117322 Free PMC article.
-
Suboxic DOM is bioavailable to surface prokaryotes in a simulated overturn of an oxygen minimum zone, Devil's Hole, Bermuda.Front Microbiol. 2023 Dec 20;14:1287477. doi: 10.3389/fmicb.2023.1287477. eCollection 2023. Front Microbiol. 2023. PMID: 38179459 Free PMC article.
-
The removal of dissolved organic matter by marine sponges is a function of its composition and concentration: An in situ seasonal study of four Mediterranean species.Sci Total Environ. 2023 May 1;871:161991. doi: 10.1016/j.scitotenv.2023.161991. Epub 2023 Feb 3. Sci Total Environ. 2023. PMID: 36740056
-
Humic substances-part 7: the biogeochemistry of dissolved organic carbon and its interactions with climate change.Environ Sci Pollut Res Int. 2009 Sep;16(6):714-26. doi: 10.1007/s11356-009-0176-7. Epub 2009 May 22. Environ Sci Pollut Res Int. 2009. PMID: 19462191 Review.
Cited by
-
Marine particle size-fractionation indicates organic matter is processed by differing microbial communities on depth-specific particles.ISME Commun. 2024 Jul 12;4(1):ycae090. doi: 10.1093/ismeco/ycae090. eCollection 2024 Jan. ISME Commun. 2024. PMID: 39165394 Free PMC article.
-
Recurring seasonality exposes dominant species and niche partitioning strategies of open ocean picoeukaryotic algae.Commun Earth Environ. 2024;5(1):266. doi: 10.1038/s43247-024-01395-7. Epub 2024 May 20. Commun Earth Environ. 2024. PMID: 38779128 Free PMC article.
-
Glucose Enhances Salinity-Driven Sea Spray Aerosol Production in Eastern Arctic Waters.Environ Sci Technol. 2024 May 21;58(20):8748-8759. doi: 10.1021/acs.est.4c02826. Epub 2024 May 6. Environ Sci Technol. 2024. PMID: 38709019 Free PMC article.
-
Microdiversity Shapes the Seasonal Niche of Prokaryotic Plankton Inhabiting Surface Waters in a Coastal Upwelling System.Environ Microbiol Rep. 2025 Aug;17(4):e70131. doi: 10.1111/1758-2229.70131. Environ Microbiol Rep. 2025. PMID: 40692173 Free PMC article.
-
Long-read powered viral metagenomics in the oligotrophic Sargasso Sea.Nat Commun. 2024 May 14;15(1):4089. doi: 10.1038/s41467-024-48300-6. Nat Commun. 2024. PMID: 38744831 Free PMC article.
References
-
- Allen J. T., Fuda J.-L., Perivoliotis L., Munoz-Mas C., Alou E., Reeve K. (2018). Guidelines for the Delayed Mode Scientific Correction of Glider Data. WP 5, Task 5.7, D5.15. Version 4.1.
-
- Alonso-Sáez L., Unanue M., Latatu A., Azua I., Ayo B., Artolozaga I., et al. (2009). Changes in marine prokaryotic community induced by varying types of dissolved organic matter and subsequent grazing pressure. J. Plankton Res. 31 1373–1383. 10.1093/plankt/fbp081 - DOI